

Weekly – This report starts with the general macro backdrop, Fed thoughts, and cross-asset commentary before diving into the factor implication. Economic indicators have slowed, but inflation remains sticky. What is driving bond yields changed as a result. Above-trend growth was the reason for higher yields, but now it is more about inflation. Bond and stock volatility are likely to remain higher until investors get a better sense of the stickiness of inflation. Many economists are leaning on seasonal factors to explain the strength in inflation. But the burden of proof on inflation has shifted after a string of hot readings. Investors will need to see March inflation data come back down rather than assuming it will come back down as seasonal factors fade. March is a no-excuse month, as seasonal influence should be gone. This uncertainty should keep the USD and rates biased somewhat higher and volatile.
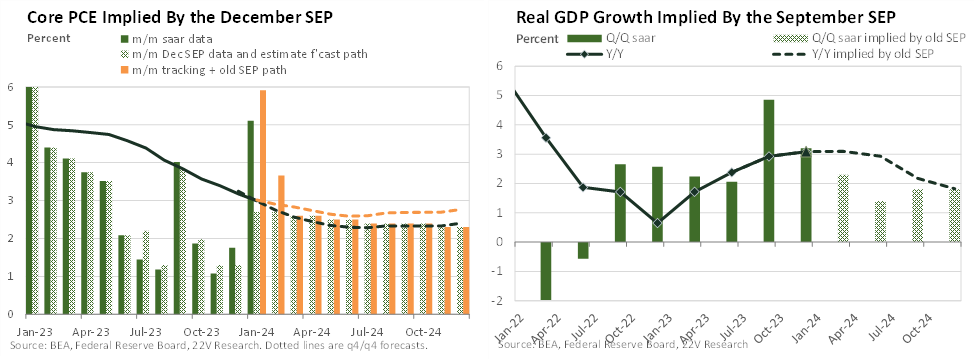
How to Think About the Fed This Week: Peter Williams thinks (HERE) “the Fed likely will have anticipated some of the 24Q1 bounce in inflation but how much remains to be seen…I think the 2024 core PCE forecast will be revised up 0.3p.p. to 2.7%” from the current 2.4% forecast. FYI, given the inflation data in hand and assuming a reasonable path of m/m deceleration in inflation across 2024 makes 2.7% a safe forecast. Importantly, a 2.6% or anything below would be dovish. It would imply a shift towards a stronger view of seasonality impacting inflation in Jan/Feb than the Fed had held before. Above 2.7%ish would be on the hawkish side. Our base case is that the Fed will keep 3 cuts for 2024, but there is material risk they will shift to 2. Shifting to 2 would be hawkish. The 2025 and 2026 dots will likely shift up by 25bps. A 2.6% PCE forecast and 3 cuts would be a positive surprise for markets. 2.8% PCE and 2 cuts would be negative.
Assuming we are correct on the dot forecast, an obvious question from a reporter at the FOMC press conference would be: Mr. Chairman, how could you raise the 2024 PCE forecast to 2.7% but keep 3 cuts? I asked Peter Williams this, and below is how he thinks Powell COULD answer. “There has been some hot inflation data to start the year. This caused us to revise up our forecasts but the medium-term outlook itself, rather than the incorporation of the incoming data and tracking, seems little changed given developments in financial conditions, labor markets, and inflation expectations. Those trends give us some comfort the trend toward lower inflation is still being maintained, although it does highlight some risks.”
Also, expect Powell to diss the dots further and emphasize that the dots are not a plan and that the Fed will follow the data.
Factor Implications of The Changing Macro Backdrop: Our call coming into last week was to continue pressing the risk-on internal market rotation with an emphasis on Value and Energy catching up on a relative basis. Energy worked, and Value outperformed, but small caps and Earnings Risk factors lagged. Earnings Risk factors and small caps should be volatile given our view of bond vol remaining higher over the next month.
The Price Momentum moved lower on the week, surprising some investors. Currently, Price Momentum is largely made up of Size, Quality, and Low Volatility stocks. The type of stocks that have done well when interest rates and economic uncertainty increase. That correlation broke down last week. We have been negative on high Momentum names recently (we officially made a Price Momentum reversal call two weeks ago), but last week we were right for the wrong reason. We thought economic uncertainty would decrease, which didn’t happen. Inflation data was hotter than expected, but Price Momentum lagged.
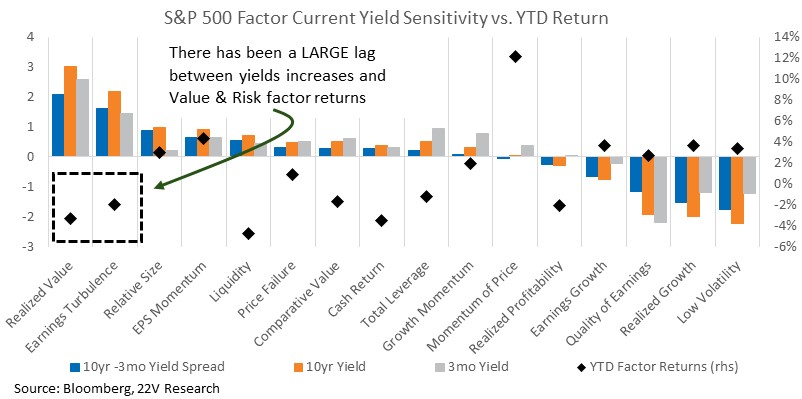
The REASON UST yields are moving has changed, which is likely impacting the Price Momentum factor. As we have pointed out before (HERE, HERE) it is a change in WHY yields or financial conditions have moved is tied to Price Momentum reversals. Not the direction.
What Is Driving Yields Has Changed: Gerard pointed out in our weekly webinar last Friday that, over the back half of 2023 and early 2024, inflation data surprised the dovish side. The Fed was being held off cutting because of above-trend growth in the presence of what seemed to be at least a fully employed labor market. But now it is the opposite. Growth is cooling, but inflation looks sticky. That fits with Deep Cyclical and Value outperformance. Consistent with this view, the Fed is likely to materially increase their forecast for Core PCE inflation for 2024, from 2.4% to the 2.7% range, and increase the economic growth forecast from 1.4%ish to 1.6%ish for 2024, according to Peter Williams (HERE). i.e., still below trend GDP growth, but an inflation forecast moving further away from the Fed’s target.
As a reminder, the NTM PE spread between the High and Low Price Momentum basket is in the 91st %tile. There is a 12.6x point NTM PE spread between the two. At the same time, NTM EPS growth expectations are roughly their median level. In other periods of significant Price Momentum outperformance, investors were forecasting stronger EPS growth for high Price Mo vs. Low Price Mo stocks. That is not the case today. Also, going into what appears to be a shift in why 10yr yields are moving, Momentum’s performance had FAR OUTPACED its sensitivity to 10yr yields. Value has SIGNIFICANTLY unperformed what would expected given its sensitivity to yields. This was a large part of the reason we called for a reversal in Momentum and Value.
It is not lost on us that 10yr yields continuing to increase because of inflation risk could tighten financial conditions in a way that increases recession risk. That outcome would theoretically favor Price Momentum, given its exposure to size, quality, and low vol. Those factors should benefit from increased economic uncertainty. However, under that scenario, the overall market is likely headed lower, so seeing the 2024 winners (Size, Quality, and Low Vol) lead to the downside wouldn’t be surprising. This stuff is hard…
Charts and commentary below…
Indicators: From Gerard “The distribution of inflation across goods and services ex-housing was interesting this month, in the sense that all the strength was in goods. Great call by Fed Chairman Powell who had been anticipating this and thus suggesting that he needed to see some relief in core services ex-housing. That was a problem because recently core services had been arguably in an accelerating trend, but it looks somewhat less so now. The fact that this month was dominated by goods is probably net dovish in isolation, because goods prices shed less light into the state of the labor market and are more noisy, at least typically.”
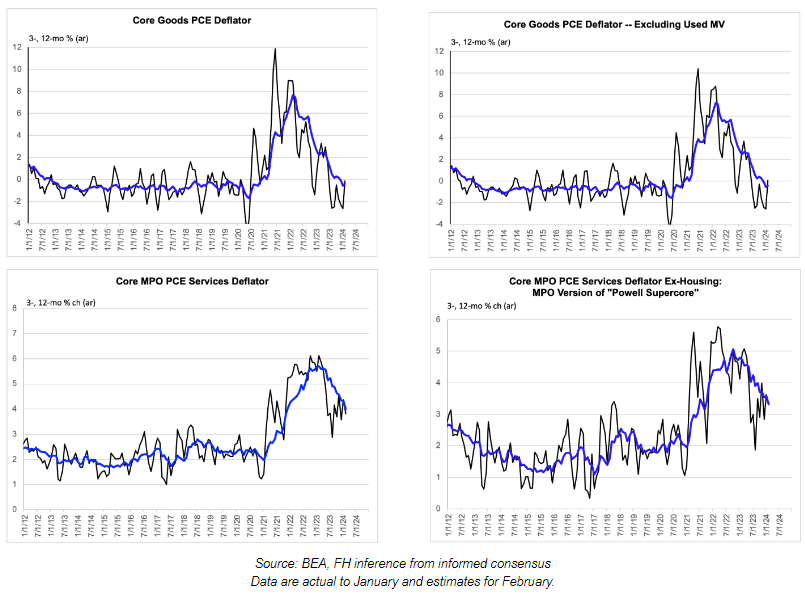
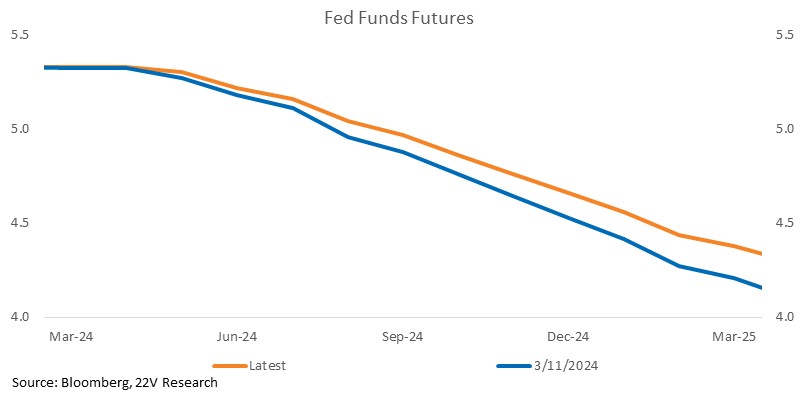
Economic indicators have slowed, but inflation remains sticky. What is driving bond yields changed as a result. Above-trend growth was the reason for higher yields, but now it is more about inflation. A month ago, investors were more willing to wait and see if seasonals would fade. Interestingly, the Fed funds futures curve did not shift much last week.
Peter Williams thinks (HERE) “the Fed likely will have anticipated some of the 24Q1 bounce in inflation but how much remains to be seen…I think the 2024 core PCE forecast will be revised up 0.3p.p. to 2.7%” from the current 2.4% forecast. FYI, given the inflation data in hand and assuming a reasonable path of m/m deceleration in inflation across 2024 makes 2.7% a safe forecast.
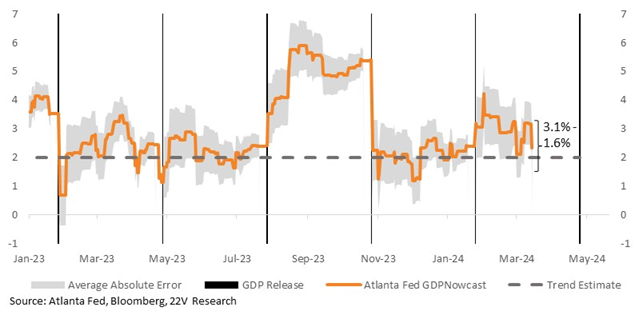
We are not changing our call on 2-2.5% GDP growth and 3 cuts. The Atlanta Fed GDPNowcast moved lower again last week, and consumer spending is running at a roughly trend pace (see Gerard Post retail sales piece). If economic growth stays around current levels, inflation data will likely be “good enough” for the Fed to start cutting. That will be good for small caps, risk factors and Value. Unfortunately, that call will be tough to monetize in the near term, given the shifting burden of proof on inflation.
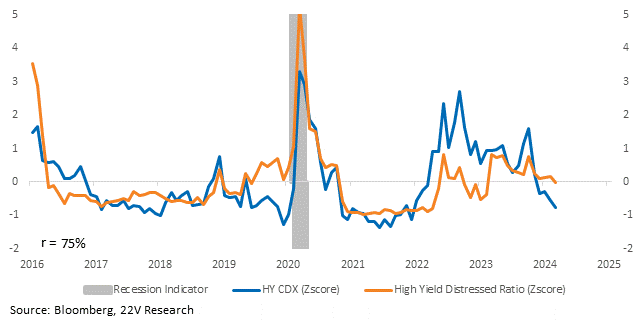
HY CDX keeps tightening, and the percent of high yield trading as distressed (>1000 OAS) keeps declining. Those trends are not consistent with a higher recessionary tail risk. Equity internals are very sensitive to the length of the economic cycle and the incremental odds, but deep recessionary tail risks are still not being priced.
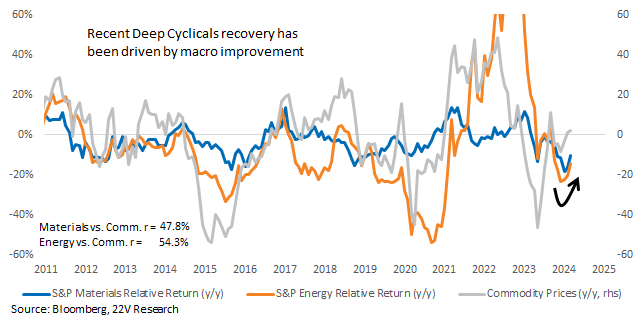
INTERNAL TRENDS: Deep Cyclicals are catching up to commodity trends (HERE). While inflation is stable/trending lower, as it is now, sensitivities to non-policy macro trends should increase. This week’s inflation data shifted rate cut odds further out of May and into June, which isn’t a scene changer for recession tail risk. Economic data has been consistent with lower macro influences (not necessarily pre-COVID low, but lower than the last few years).
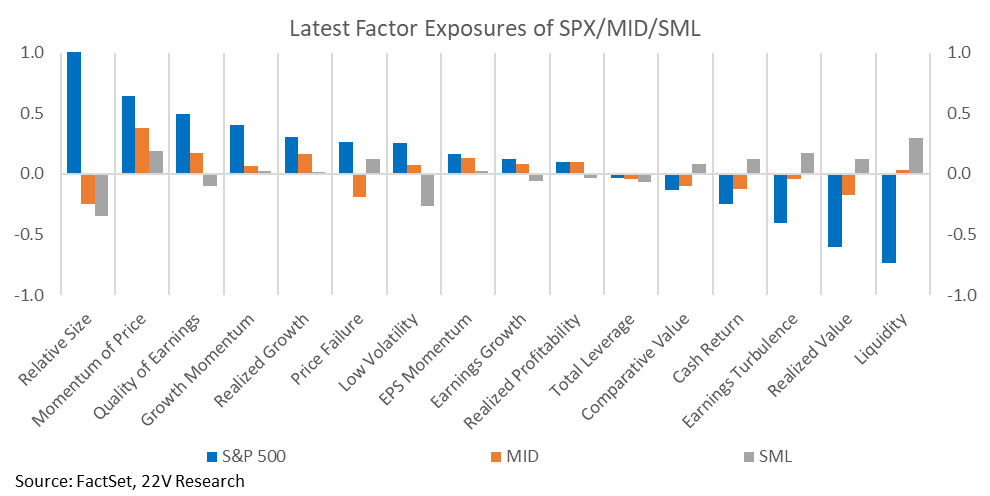
Small caps and risk-on lagged last week, as did small cap names in general. The S&P 500 is a much more risk-off index than the S&P 400 and 600.
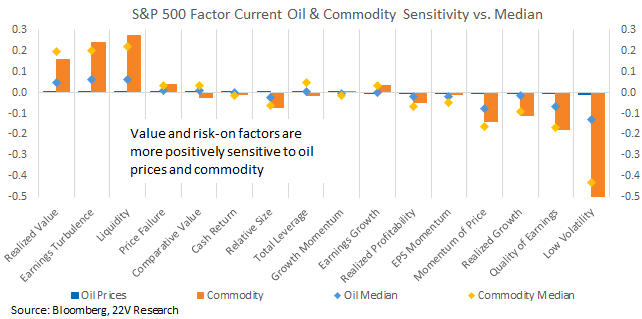
Value and risk-on factors tend to be most positively impacted by oil and commodity price gains. Low Volatility and Quality, two factors that surged higher earlier in the year, are negatively sensitive to commodity trends. The macro backdrop remains highly sensitive to short rates and yield curve trends and overpowered the influence of other macro forces earlier in the year. As long as inflation is stable/trending lower, sensitivities to OTHER macro trends, should increase. For now, that encourages a rotation into Value/Risk and out of Quality/Low Vol.
The correlation between the S&P and the 2yr is unstable, and the current reading is only -10%. Not much of a relationship. With the tightening bias from the Fed gone and medium-term recession risk low, the 2yr yield should continue to have little influence on the S&P.
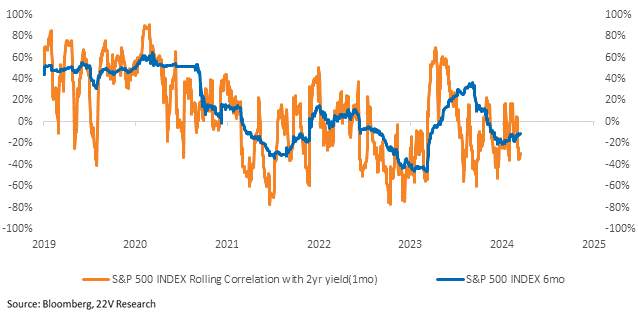
Yields continue to be an unusually strong contributor to market and factor vol. While the outlook for near-term policy rates remains a hot topic, the influence of yield fluctuations will remain high (HERE). Changes in yields can alter the macro regime, but with economic growth strong, 10yr yield and the inverted yield curve are biased higher.
EXTRA: Peter Williams Wrote us an Explainer on Seasonals: Residual seasonality, which is turn of the year price increases and used to be the norm before we had 10+ years of disinflation, more directly impacts core goods than core services. But it was core services ex housing which were notably hotter in the Jan data. If this reflects annual pricing resets that incorporate higher lagged inflation, it’s likely to resolve favorably by March but could still boost Feb. The risk is that the bump is a sign of more persistent upside pressures in services. A firm core services ex housing number will mean we debate how persistent inflation trends for another month and March will be the big one. It must be resolved in March.

