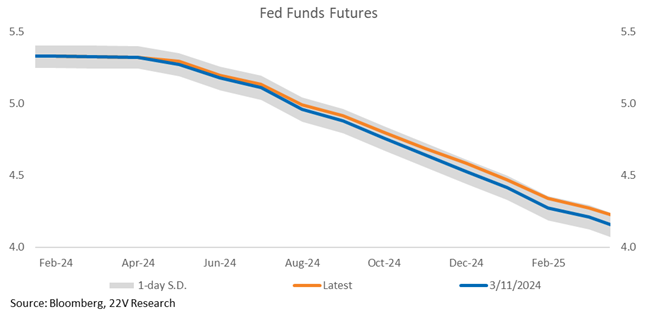
SUMMARY: The main driver of the increase in UST yields, following CPI data yesterday, seemed to be odds of a May cut being dismissed. The Fed funds futures curves barely budged, and June cut odds are still 63%ish. It’s tough for the markets to sell off if June cuts are still a base case and the economy is growing at 2%+ real as is currently the case.
The internal factor moves were a bit extreme, AGAIN, relative to what you would expect from changes in UST yields. Price Momentum and risk-off factors (Size, Quality, and Low Vol) overlap now and both outperformed significantly yesterday. Along with Early Cyclicals (Tech, Communications, Discretionary). 10yr UST yields had a decent move higher but are only back to last Tuesday’s levels.
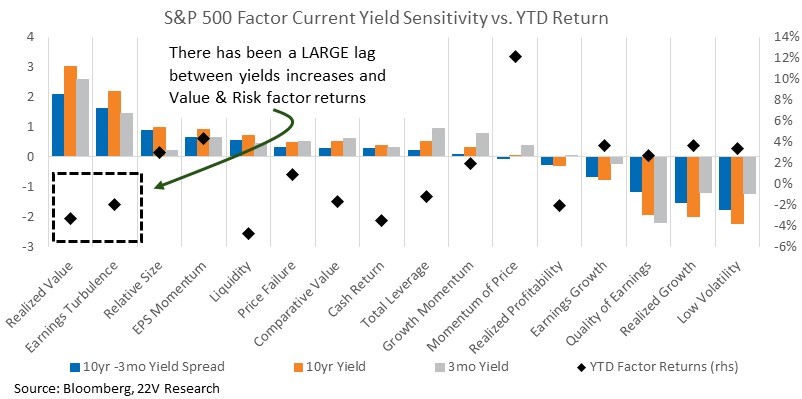
The practical point we are trying to make, Price Momentum’s sensitivity has been significantly more positive relative to UST yields vs history. Value’s sensitivity to yields has lagged significantly relative to what you would expect historically. The magnitude of the factor moves, relative to historical sensitivities raises concerns around positioning. I.e., it might take a slightly dovish PPI or Fed comment to reverse yesterday’s factor moves aggressively. Even if the 10yr yields only move marginally.
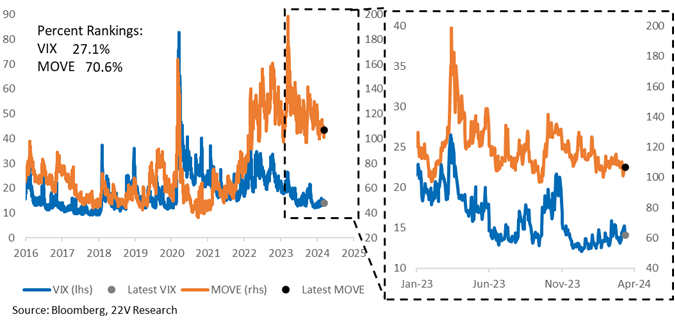
Bottom Line: With inflation still above target, there is a risk the Fed doesn’t cut at all, which is why bond vol is still unusually elevated relative to stock vol. Higher bond vol implies higher economic uncertainty longer term, which is bad for riskier factors, small caps etc., Those stocks more dependent an extension of the economic cycle. Longer Term economic uncertainty (+1year) is friendly for risk-on factors and small caps.
When bond volatility falls, expect significant and sustained outperformance of Small caps, Earnings risk factors etc., Bond vol has been trending lower, but has been stuck at an historically high level for a while. Less extreme vs. last year, but still high. There are a few important data points to get through over the coming month that will help solidify Fed policy expectations. Expect market internals to remain choppy in the meantime. That choppiness could be dangerous given the extreme sensitivity in factors relative to changes in 10yr yields we highlight above.
Our call remains 2-2.5% real GDP growth with 3 fed cuts. That backdrop should lead to much lower bond vol.

Full report below…
MARKET VIEWS: Price Momentum, which has significant exposure to the Size, Quality, and Low Vol factors, significantly outperformed yesterday following the CPI data. Early Cyclicals (Tech, Discretionary, Communications), which have underperformed Deep Cyclicals (Energy, Industrial, Materials) significantly over the last month bounced back as well. Value was weak. 10yr UST yields had a decent move higher but are only back to last Tuesday’s levels. The main driver of UST yields seemed to be the odds of a March cut being dismissed following the CPI. The Fed funds futures curves barely budged though, and June cut odds are still 63%ish.
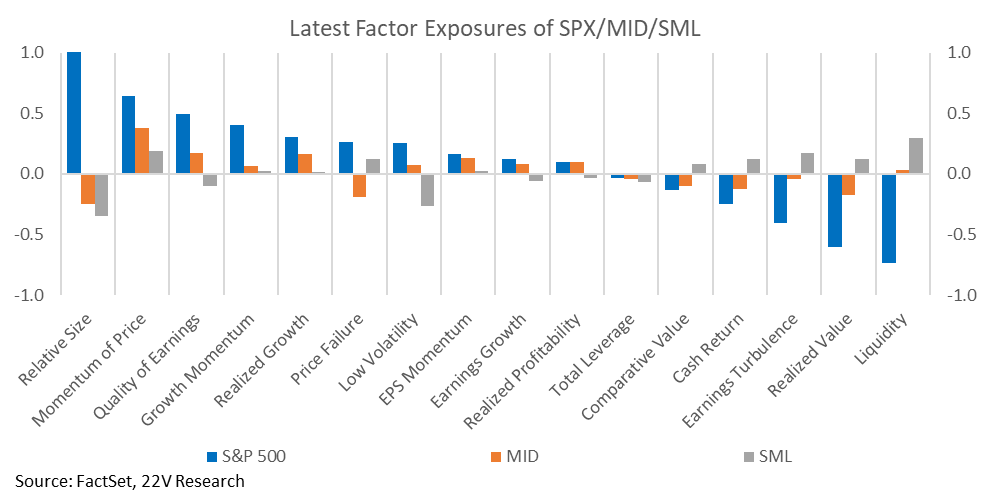
Bottom line, as we have detailed recently (HERE), Value’s sensitivity to yields has lagged significantly relative to what you would expect historically, and Price Momentum’s sensitivity has been significantly more positive vs history. Directionally it makes sense as investor fear that more Cyclical or riskier stocks (Small caps, Earnings Risk, Leverage Factors etc.,) would struggle in a higher interest rate environment. The higher the interest rate now, the shorter the economic Cycle is an argument as well. Hence, the outperformance of the S&P 500, vs S&P 600. The S&P 500 is a much more risk-off index than the S&P 400 and 600.
But the magnitude of the factor moves, relative to what you would expect, is extreme (see chart below) and does raise some concerns around positioning. I.e., it might take a slightly dovish PPI or Fed comment to reverse yesterday’s factor moves. Even if the 10yr yields only move marginally.
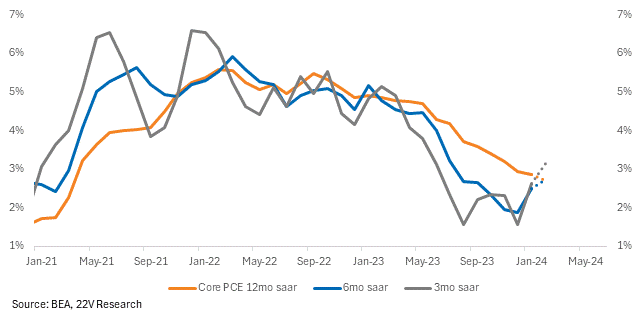
PPI is tomorrow and the combination of PPI/CPI will set the expectation of Core PCE, the Fed’s preferred metric, later this month. Some of the reads we have seen for Core PCE post CPI put the Core PCE YoY estimate around 2.7% y/y. This will change post PPI, but below is what Core PCE charts will looks like if that 2.7% hit. Not terrible at all IF YOU ASSUME the Jan/Feb MoM reading for Core inflation move back down as seasonal factors fade. June cuts would still be a base case.
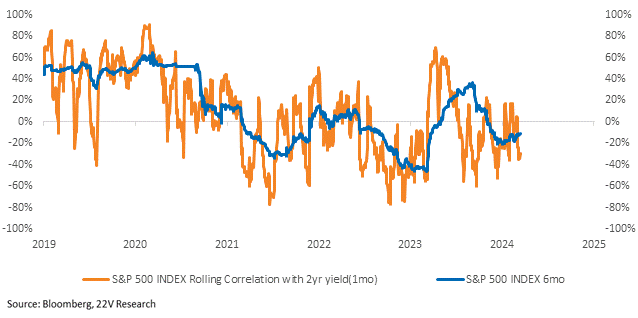
Bond vs Stock Correlations: The correlation between the S&P and the 2yr is unstable, and the current reading is only -10%. Not much of a relationship. With the tightening bias from the Fed gone and medium-term recession risk low, the 2yr yield should continue to have little influence on the S&P.
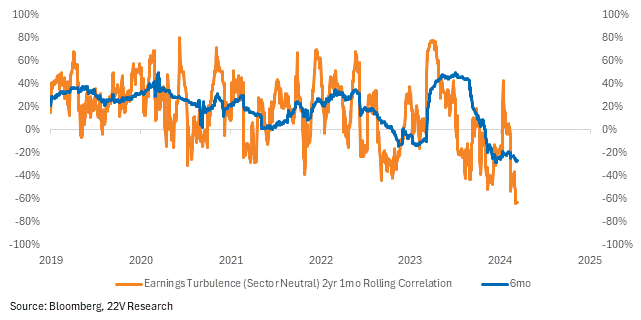
Risk-on factors, like the Earnings Turbulence, has a much more negative correlation with yields than the S&P. Yesterday’s internals were consistent with the move in 2yr yields and investors being are concerned that “higher for longer” will keep 1yr forward recession risk elevated. If recession risk is higher than normal on a 1yr+ basis, it’s hard for stocks that are dependent on the economic cycle (Deep Cyclicals, Value, Small caps, Earnings Risk factors) to outperform. Price Momentum, which is associated with Size, Quality and Low Vol, outperform.
Bottom line: The aggressive shift into riskier parts of the market will happen when the Fed cutting cycle gets going. There is still risk that the Fed doesn’t cut at all, which is why bond vol is still unusually elevated relative to stock vol. As bond volatility falls, that is when you should expect significant and sustained outperformance of Small caps, Earnings risk factors etc., We seem to be trending in the direction of lower bond vol, but we still have a few important data points to get through to firm up the start of the Fed cutting cycle. Expect the market internals to remain choppy in the meantime.