

Bottom Line: UST yields seem to be marking to market the current 2% economic growth estimate 1Q24 and incorporating some downside risk to growth. Payroll and CPI will be the major swing factors for UST yields, but if the Atlanta Fed GDPNowcast remains closer to 2%, there will be much less upside risk for 10yr yields and the USD.
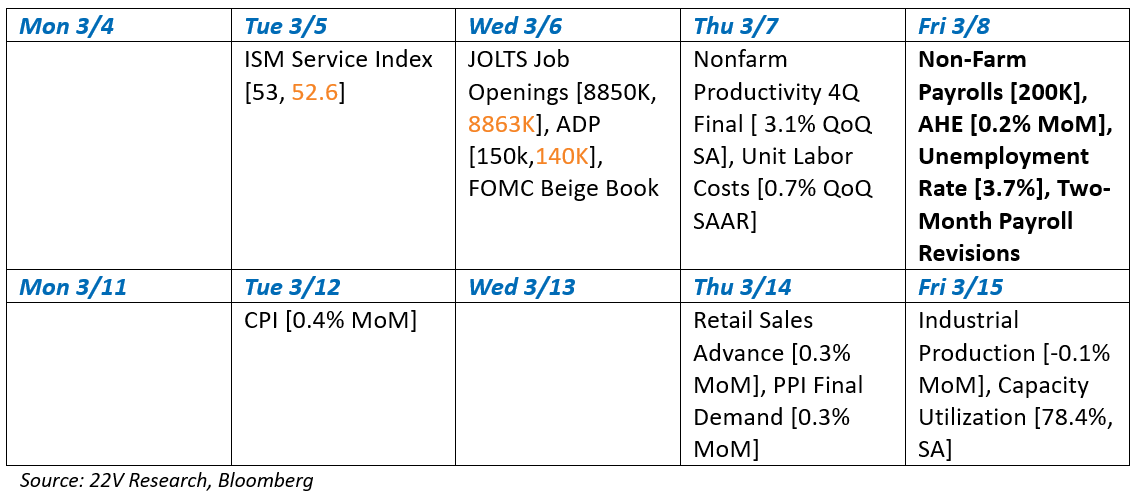
Relevant News: JOLTS came roughly in line (8863K actual, 8850K expected) while the previous reading was revised lower (from 9026K to 8889K). The quits rate continues to trend lower and fell from 2.2% to 2.1%. The overall report was slightly dovish. Again, the payroll report on Friday is a much more important data point.
Things to Watch [Consensus, Results]:
Quant: Yields and Yield Curve Influence on Sectors
Yields continue to be an unusually strong contributor to market and factor volatility. While the outlook for near-term policy rates remains a hot topic, the influence of yield fluctuations will remain high (HERE). Changes in yields can alter the macro regime, but with economic growth strong, 10yr yield and the inverted yield curve are biased higher. Sectors that benefit most from rising yield and yield curve are Financials and Energy while REITs and Utilities have seen the most negative beta with yields considering their median beta post-GFC. That is consistent with factors as Financials and Energy are usually more Value exposed.
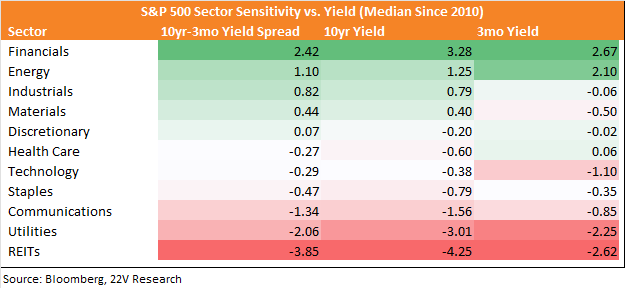
Yield sensitivity today at sector level is roughly aligned with historical pattern with the exception from Staples and Discretionary. Staples is having slightly positive beta to yields while Discretionary beta is unusually negative today. As we discussed in Strategy report (HERE), Deep Cyclicals (Energy, Industrials, and Materials), especially Energy and Materials are having relative weak fundamentals but the oil rebound and lagging returns of Energy leaves room a catchup trade. The yield beta to the sector and expected move also help that catchup.

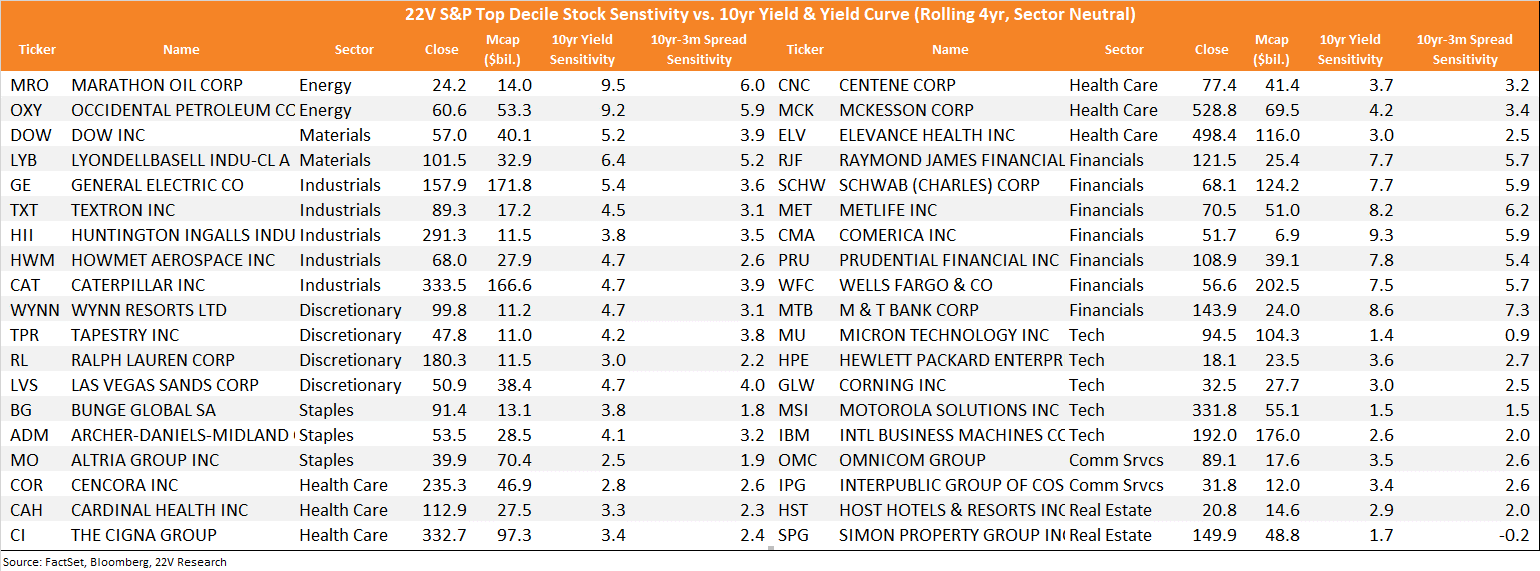
Below we list the stocks with the greatest sensitivity to 10yr yields and the yield curve. This is a group of names that should track changes in yields over the course of the year.
Portfolio Strategy: Momentum Under Pressure
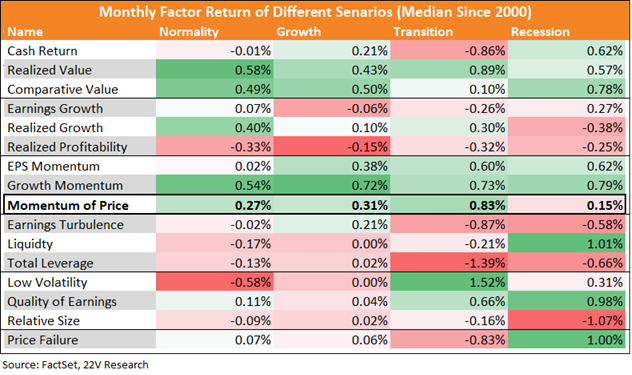
The Momentum factor started to come under some pressure late last week and early this week but accelerated to the downside yesterday. If the Price Momentum factor comes under pressure, it is bad news for Size, Growth and Quality. All underperformed yesterday. Value outperformed and given the underperformance of Value to start the year, we suggested a catch up in the Value factor and Energy Sector last Friday (HERE).
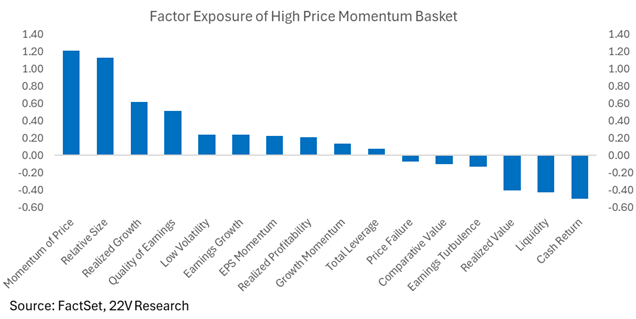
Generally, Momentum factors have worked in the type of economic regime we are in now. The current regime being a “growthier” portion of a normal economic expansion. Being short momentum likely doesn’t make sense if the economy remains within the current Normal/Growth macro regime. Value tends to do well in the current economic regime as well. Again, we expect some catch up in Value.
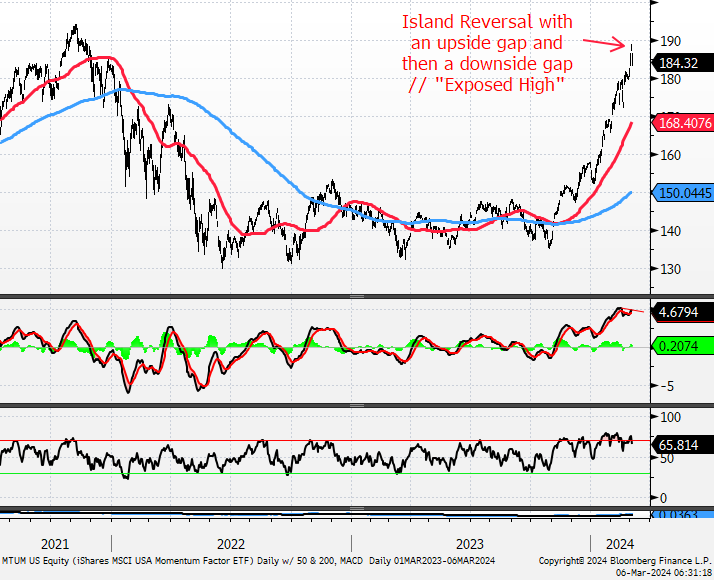
From a technical perspective 22V’s technical analyst noted, “MTUM – Make no mistake, the Technical Score for MTUM is still a Strong 4; however, I think it’s a decent idea to take a shot at it on the short-side here because (a) it’s extended vs. its 200-Day MA, (b) is into resistance from the 2021 high, (c) just recorded its greatest every daily overbought reading via the MACD in the middle panel, (d) there is a tiny negative momentum divergence with price and the MACD Iin the middle panel as momentum peaked in mid-February, and (e) MTUM gapped up on Mar 4 and gapped down on Mar 5 creating an Island Reversal // “Exposed High”.
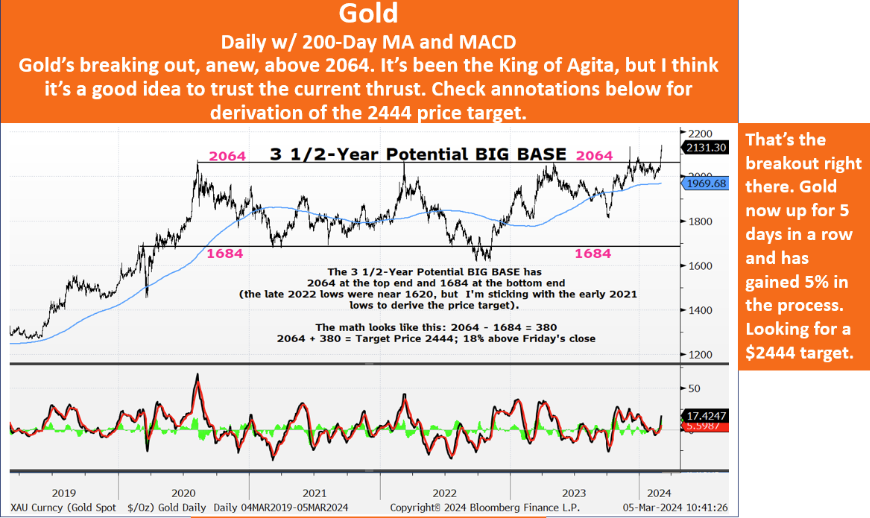
Technical Analysis: Chart Spotlight: Gold
22V’s technical analyst likes gold given its current technical set up. Please see chart annotations for a price target and further commentary.
Source: Bloomberg, 22V Research

