Weekly – Last week, risk-on, the average stock, and Cyclicals underperformed risk-off, mega caps, and Defensives last week. Risk appetites took a pause after a three-week, 7.5% market rally that left implied volatility at its lowest point since pre-COVID. Those gains can be chalked up to rising soft-landing odds following the June payroll report and CPI readings. Inflation globally (see the hot U.K. print from last week) remains too strong and U.S. labor markets are too tight for a high conviction call that inflation will ease fast enough for the fed. Even if a soft landing does ultimately play out, the path between here and there will be choppy, and uncertainty ruled market action last week. A lack of data this week means market weakness could continue into next week as well.
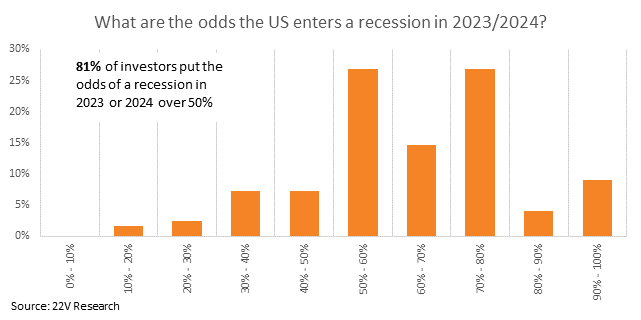
Concerns about downside risk to the economy remain well entrenched. Most investors we surveyed last week still think a recession is highly likely. 81% of the investors we polled (HERE) put recession odds in 2023 or 2024 above 50%. That’s roughly consistent with the percent that expected a 2023 recession when we asked in January (81%), during our post-SVB survey (83%), and in our May survey (72%). With a few weeks until earnings season and a light week for data, narrative-driven recession probabilities could keep pressure on risk assets for the next few days.
A few weeks ago, we calculated ~4600 as S&P fair value under a soft landing (methodology HERE). So, 4600 is the reasonable level IF macro data breaks the right way (loosening labor markets, lower inflation, no signs of a growth collapse). If the macro doesn’t break that way or appear to be leaning in that direction, fair value is lower (3800 under a recession scenario). That is a risk near-term given the low level of vol and the still elevated influence of macro forces.
Medium-term, our view for Cyclical/risk-on/average stock leadership remains in place. Investors think the largest risk to growth is the Fed, and we agree. FROM HERE, the need for ADDITIONAL Fed tightening is the biggest recession risk. The lagged impact of hikes looks like it has played out. Housing data has been much stronger than expected and as Gerard noted (HERE) it “…by far the most interest-sensitive sector of aggregate demand (housing) has already done its face plant and the majority of the real effects from the Fed are already in the economy.”
Market action this year, high frequency economic data, and futures pricing indicate the economy is ok and inflation is slowly moving lower. That is despite a rapid pace of rate hikes, a 5% fed funds rate, and expectations of another hike. All that means there is a greater chance that R* (the equilibrium real fed funds rate) is higher and the economy can “live” with 5% fed funds. At least for now. That idea helps explain why risk-on and Cyclicals have outperformed MTD despite their stumble last week.
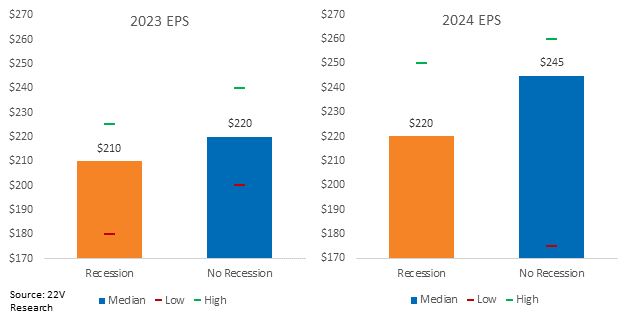
Beyond the next few weeks, 2Q reporting season will get underway. Investors who do not expect a recession put 2023 S&P EPS at $220, and for those expecting a recession the estimate drops to $210. 2024 estimates are wider with non-recession at $245 and the recession number $220. With 81% of investors think a recession will happen, the base case for earnings appears to be $210 and $220. Consensus put 2Q EPS down -8.4% (to $53) and 2023 earnings at $217. That implies downside risk for the market, but not a sharp selloff. It also creates a low bar for earnings heading into a season where sentiment and guidance are firming.
Summarizing the market backdrop, 1) rate hikes appear near their end, 2) the lagged impact of previous hikes and the current level of interest rates do not seem to be crushing the economy, 3) investors expect a recession, and 4) a fairly weak EPS growth trajectory. At the same time, 1) the S&P is trading at the high end of its range UNLESS a soft landing plays out, 2) soft vs. hard landing odds remain uncertain, and 3) market vol is very low relative to macro influence.
The bottom line of the above is that a directional market call requires information that is not available today. We remain focused on thematic plays that are not as tied to economic outcomes. As we discussed over the past few weeks, those themes include a rebound in Destocking losers, Deep cyclicals (ex-Energy) over Defensives and Early Cyclicals, the average stock over mega caps, emerging markets, and risk-on factors.
That market outlook will become clearer when the policy inflation path is clearer. Until then, expect sudden bouts of mean reversion as has been the case for most of the past year.
Report below…
Indicators: Inflation, globally (see the hot U.K. print from last week) remains too strong. However, with commodity prices stable and at low YoY levels and U.S. inflation expectations collapsing on a 1-year forward basis (see all 3 measures below), investors seem reluctant to push UST yields much higher from HERE (~3.7%). Expected Fed funds would need to be repriced significantly higher to push UST yields back to cycle highs or beyond.
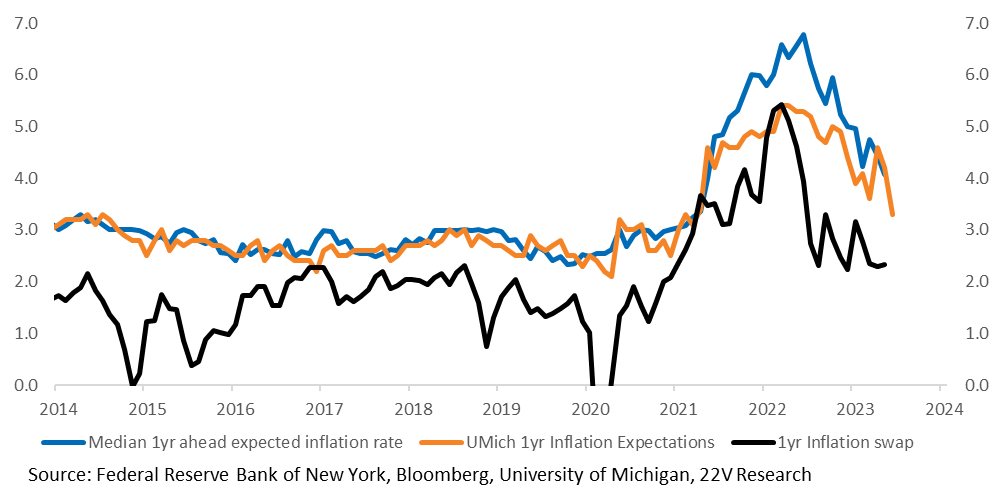
So, it is less obvious that the Fed needs to force a recession to cool inflation. From Powell about the DOTS “what they’re showing is that as inflation comes down in the forecast, if you don’t lower interest rates then real rates are going up, right. So just to maintain a real rate, the nominal rate at that point two years out should come down just to maintain real rates.” That hints at allowing higher than 2% inflation for some time, increasing the odds of a soft landing (no or mild recession) outcome.
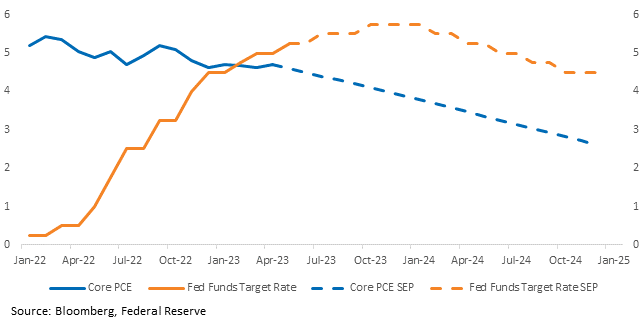
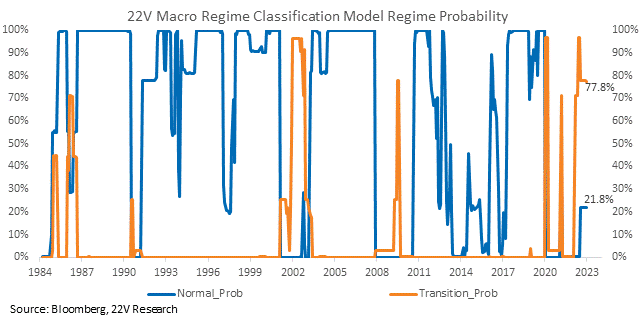
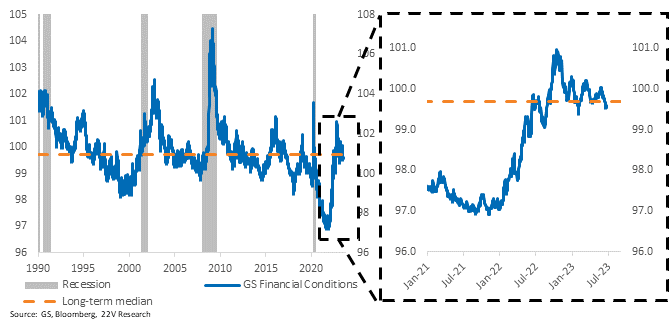
Fed fund futures suggest the Fed is near the end of its tightening cycle, but not necessarily because of an imminent deep recession. Per our GMM macro regime classifier, the economic backdrop has moved closer to ‘Normal’ (more HERE).
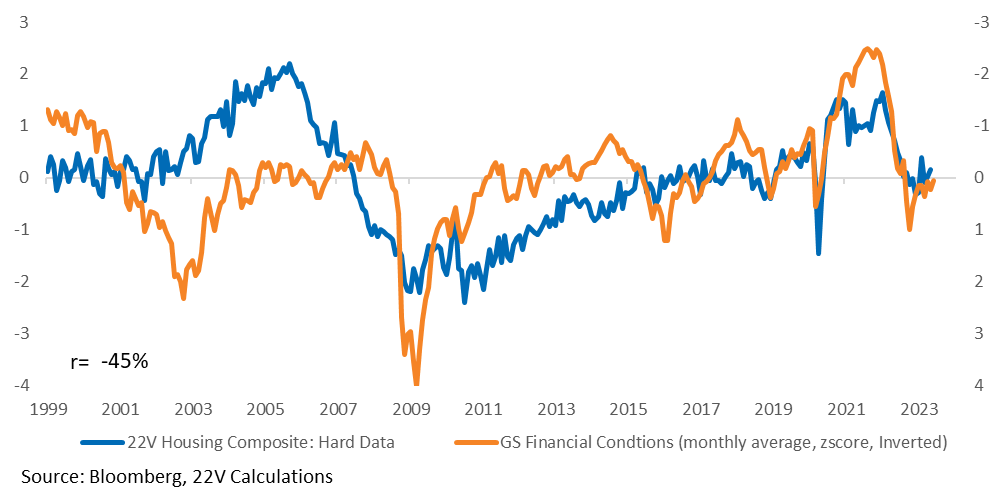
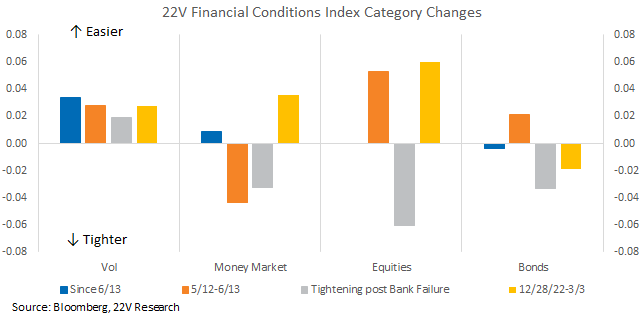
The risk to growth is from the need for ADDITIONAL Fed tightening. The lagged impact of hikes looks like it has played out. Housing data has been much stronger than expected and as Gerard noted (HERE) it “was probably wrong to think of there still being major lagged effects on real output growth from the earlier Fed tightening…by far the most interest-sensitive sector of aggregate demand (housing) has already done its face plant and the majority of the real effects from the Fed are already in the economy.” Financial conditions have stopped tightening, and hard housing data points have stabilized.
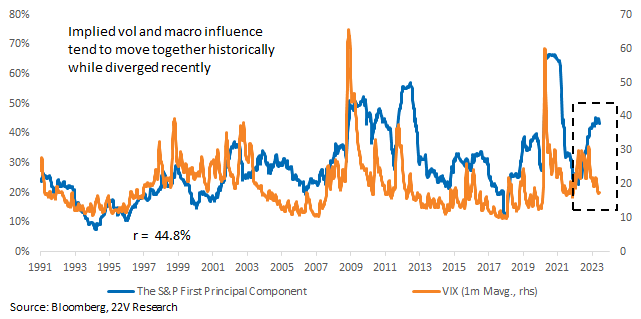
Fair Value Thoughts: Macro influence on S&P remains high (85th %tile). The divergence between macro influence and market vol has reached extreme levels. Our read of this is that the stability of macro forces over the past few months have allowed equity vol to decline, but market trends remain tied to those macro forces. Macro influence should trend lower OVER TIME, but market calls are hard to make until the outlook for a soft or hard landing become MUCH clearer.
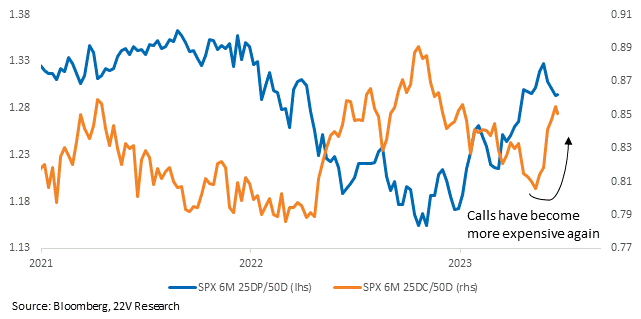
A few weeks ago, we calculated ~4600 as S&P fair value under a soft landing (methodology HERE). So, 4600 is the reasonable level IF macro data breaks the right way (loosening labor markets, lower inflation, no signs of a growth collapse). If macro doesn’t break that way, or appear to be leaning in that direction and considering 1) The S&P has broken out of its 3800-4200 range and 2) index calls have become more expensive relative to puts (HERE), now is a good time to sell calls to protect gains.
Most investors still think a recession is highly likely. 81% of the investors we polled (HERE) put recession odds in 2023 or 2024 above 50%. That’s roughly consistent with the percent that expected a 2023 recession when we asked in January (81%), during our post-SVB survey (83%), and in our May survey (72%). The main source of recession risk is the Fed.
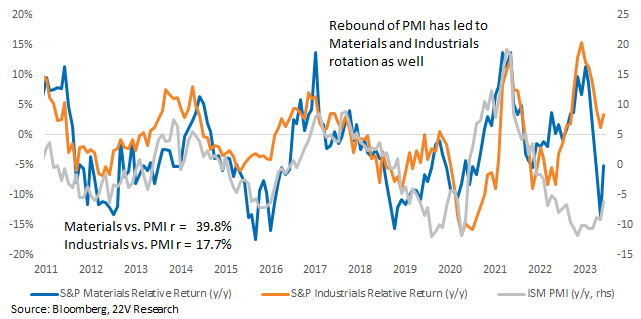
Cyclicals in general and Deep Cyclicals (Energy, Materials, Industrials) in particular, struggled last week but remain attractive. All things equal, higher soft landing odds and some firming of growth in a higher nominal rate backdrop should support 1) the average stock over the cap weighted index, 2) be a bit of a headwind for the overall market as Tech consolidates, AND 3) allow for continued Cyclical leadership, with Deep Cyclicals (ex-Energy, more on that below) catching up.
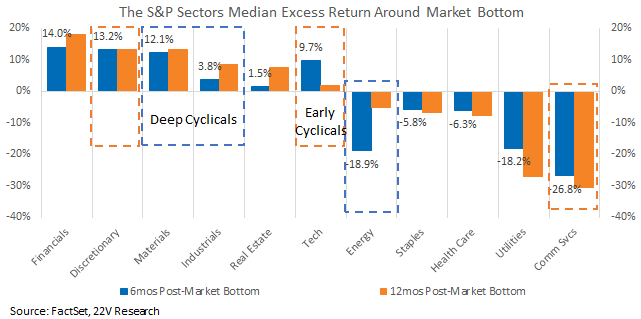
If a soft landing is coming, the market low for this cycle was likely the bottom in Late-October 2022. One year from the market low, Cyclicals generally outperform Defensives overall, with Deep Cyclicals tending to gain in the later half of the year.
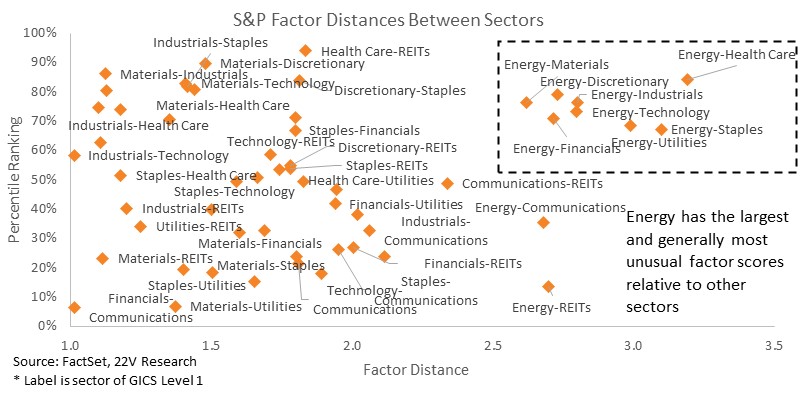
Energy is an outlier in general. Looking at the S&P factor distance between pairwise sectors and their historical percentile, Energy shows a significant divergence relative to other sectors AND its historical range. Put another way, Energy does not share factor characteristics with other sectors or itself historically. That means Energy is less likely to be moved by a rotation into the factors associated with other Deep Cyclicals.
Earnings Outlooks Firming: 2Q reporting season is still a few weeks out, Investors who do not expect a recession put 2023 S&P EPS at $220 and with a recession the estimate drops to $210. 2024 estimates are wider with non-recession at $245 and the recession number $220. Consensus put 2Q EPS down -8.4% (to $53) and 2023 earnings at $217. Since 81% of investors think a recession will happen, the base case for earnings appears to be $210 and $220.
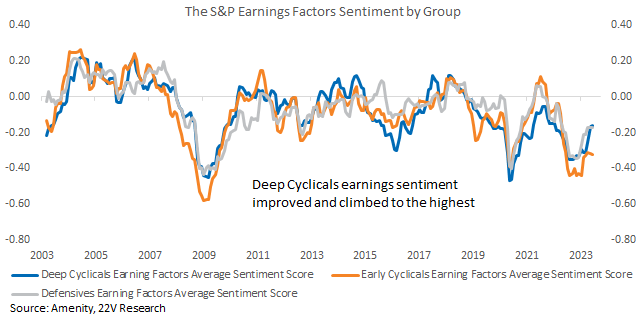
Management sentiment around earnings topics has rebounded over the past few quarters. That is true for nearly all sectors and for ALL of our standard sector groupings.
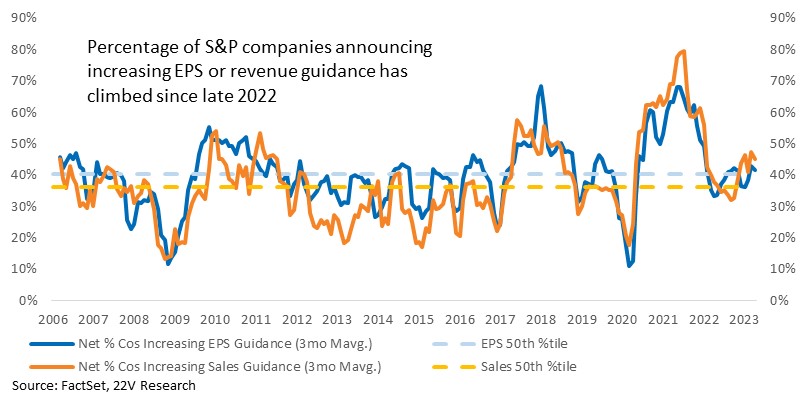
Earnings guidance gains are in-line with improving earnings sentiment expressed by the management. As with sentiment, correlations, beat rates, guidance improving is inconsistent with a recession. Growth stabilizing, management sentiment improving, and guidance firming all suggest 2Q reporting is more likely to surprise to the upside than downside.
THEMES OVER MARKETS: Summarizing the market backdrop, 1) rate hikes appear near their end, 2) the lagged impact of previous hikes and the current level of interest rates do not seem to be crushing the economy, 3) investor are discounting a fairly weak EPS growth trajectory, 4) BUT soft vs. hard landing odds remain uncertain, and 5) market vol is very low relative to macro influence. The bottom line of the above is that directional market calls are less appealing than thematics that are less dependent on very broad macro trends. That will change when the policy inflation path is clearer, until then, below are some of our favorite current thematic ideas.
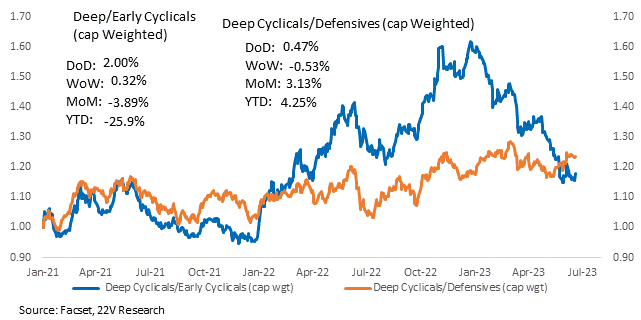
Deep Cyclicals Leadership: Deep Cyclicals (Energy, Materials, Industrials) have outperformed Defensives over the past month, and have been catching up to Early Cyclicals (Tech, Discretionary, Communications). Expect that trend to continue medium-term, which all things equal, should be a bit of a headwind for the overall market as Tech, or the big 7, consolidate.
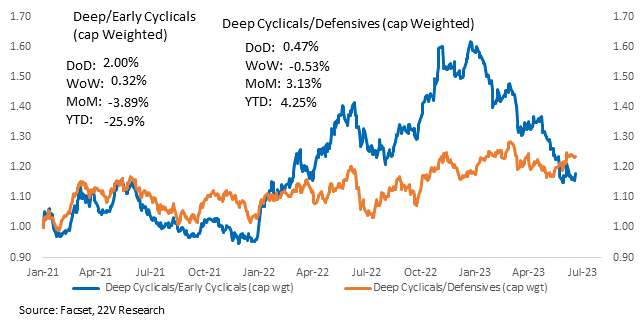
Deep Cyclical returns have improved, a shift encouraged by increased soft landing odds and the improving economic momentum. Growth is still slow, and that will remain true for an extended period as global central bankers continue to fight inflation, but the speed of the decline has slowed.
From Quant (HERE), below are ALL the S&P Cyclical names that stand to benefit from Deep Cyclicals relative outperformance. In other words, stock returns of the Cyclical names below share Deep Cyclicals characteristics.
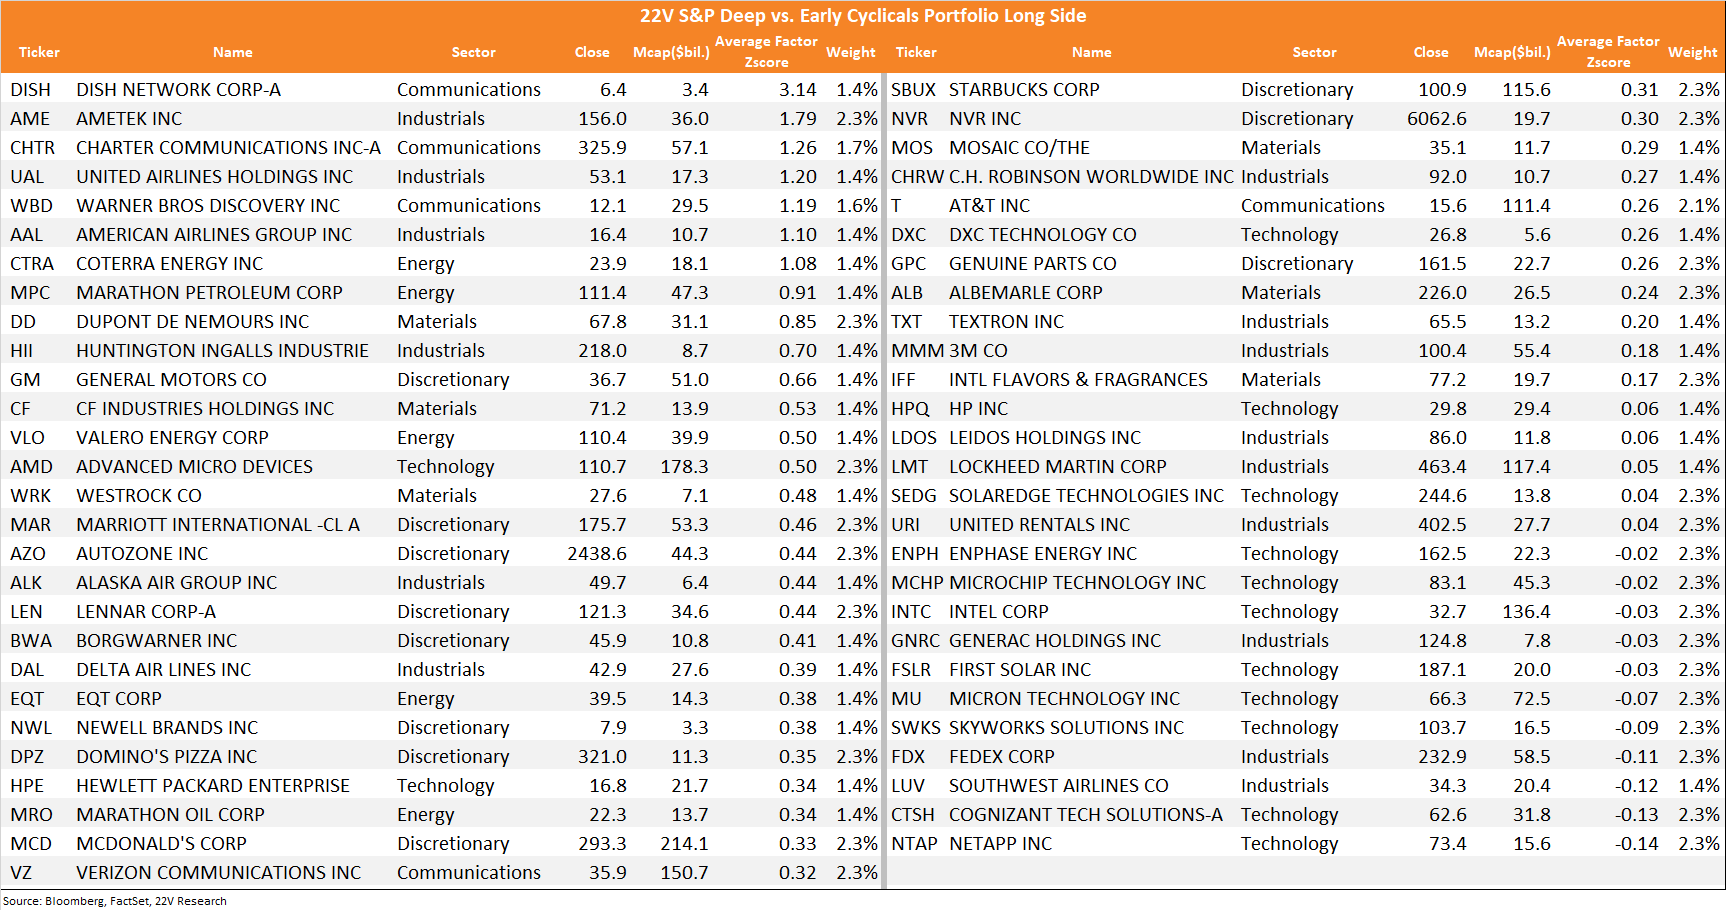
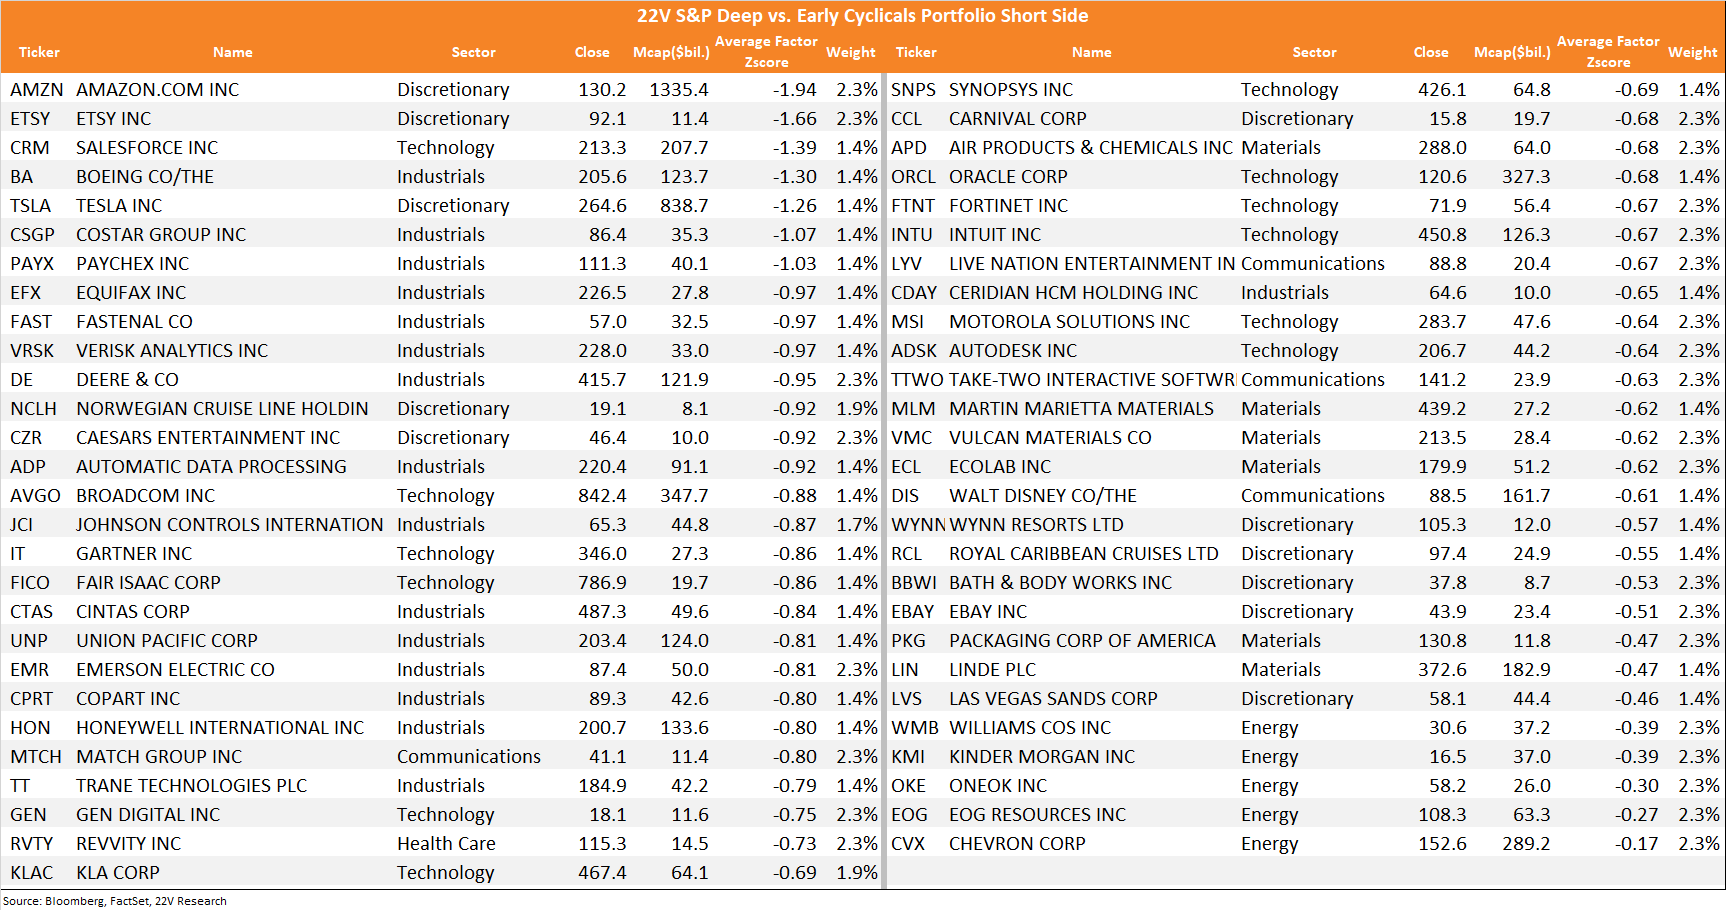
The S&P Cyclical names with Early Cyclical characteristics are listed below as well. Outperformance of Early Cyclicals should bring more tailwind to these groups.
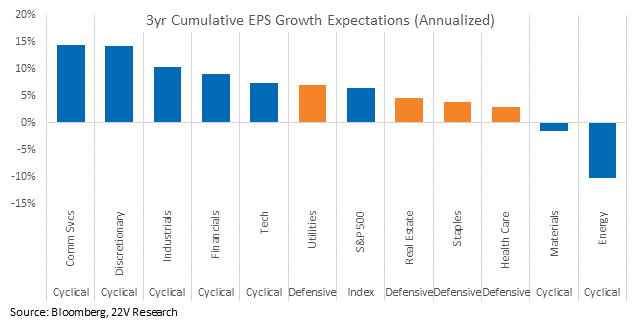
Defensive Headwinds: Growth firming despite the futures pricing in a higher for longer funds rate suggests upward pressure on estimates of the neutral rate (r*). A higher estimate of r* (where 4-5% fed funds rate is not crushing for economic growth but is required just to keep core PCE below 3%) is how higher for longer doesn’t lead to a risk-off reversal. It is a headwind for Defensive though, some of which are more rate-sensitive, and nearly all of which have poor earnings growth expectations.
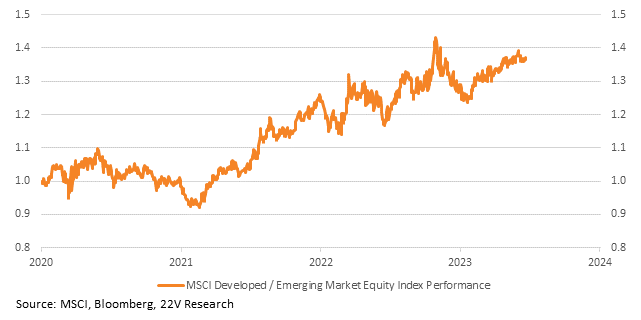
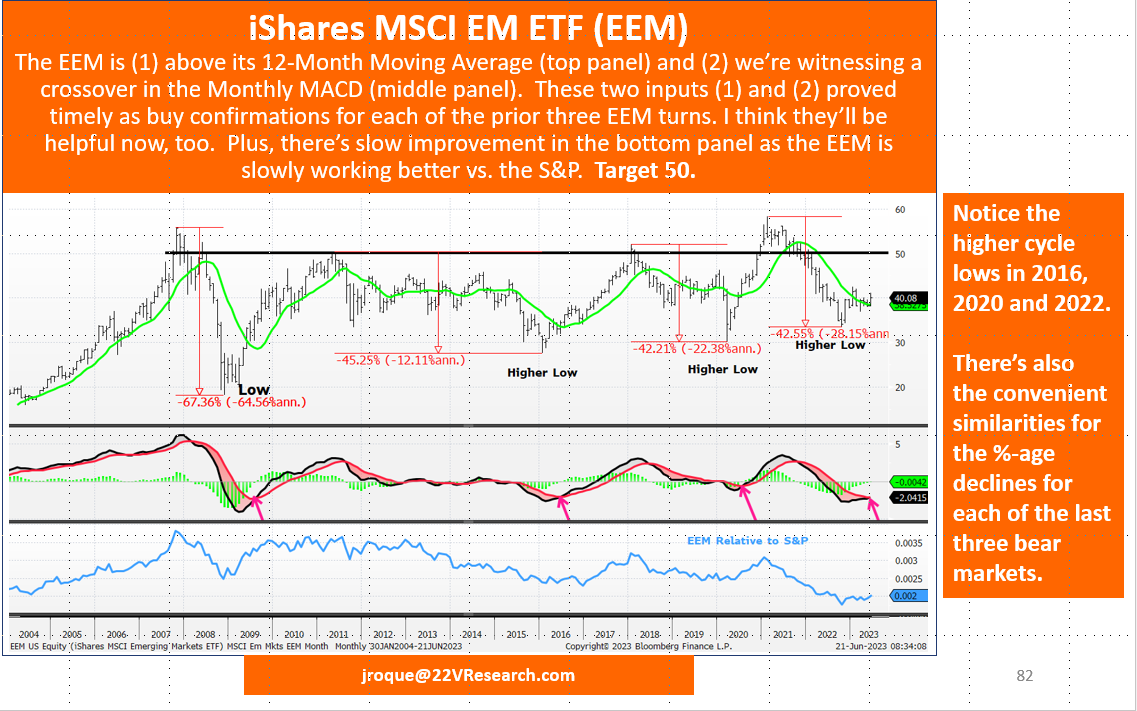
Long EM: Emerging markets have underperformed developed markets consistently since the start of 2021. One of the reasons: a hawkish Fed. Per a Fed research paper (HERE), U.S. monetary tightening driven by a more-hawkish policy stance cause a substantial slowdown in activity in all EMEs.
Some significant headwinds remain, like volatile food prices and geopolitical risk. But the same tailwinds to Deep Cyclicals, the average stock, and destocking losers we have been discussing the past couple weeks (it’s less obvious the Fed needs a recession to cool inflation, mean reversion, higher r*, stable FCI) are also good for EM.
John Roque, 22V’s technical analyst, hosted a webinar yesterday (replay link HERE). He likes EEM here, target 50. Please see chart annotations for further details.
Risk-On Rotation: Over the past few days several central banks have either resumed/stepped up the pace of tightening or warned that more rate hikes may be needed due to stickier inflation. Combined with disappointing flash PMIs and China’s lack of follow through on stimulus, the outlook for risk-on factors has deteriorated short term. Our risk-on factor call for the month of June and beyond is based on lower near-term recession odds and more patient central banks. Central banks appear less patient now (this could change quickly as the data changes), which has worked against the risk-on factor call for now.
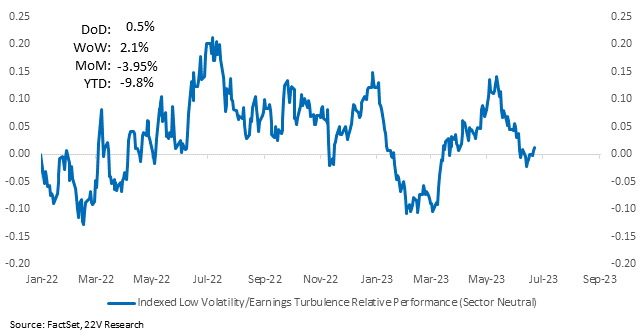
However, given the stability of the macro backdrop, we expect the risk-on rally to continue over the next month or so. Financial conditions remain range bound and implied vol has been trending lower.
Final Point – Macro is Hard: Liquidity is not a magic macro indicator. It worked when global central banks were aggressively easing to save the economy and then aggressively tightening to fight back inflation. Now the macro backdrop is normalizing, so the relationship is breaking down. Liquidity readings alone are not going to indicate the level or direction of equities.
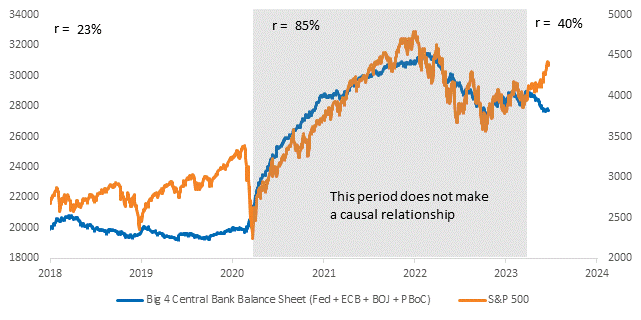
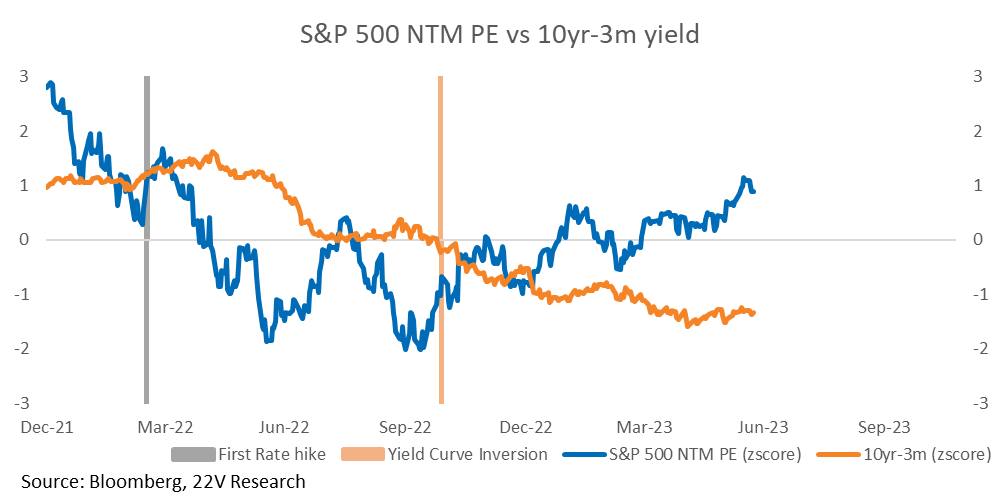
You also can’t just look at the yield curve. The market price and multiple bottomed within a couple of weeks of the yield curve’s first inversion in late-’22. Inversion was supposed to be the harbinger of an imminent recession. Go figure. Macro is hard. Don’t look at one variable.