There have been some early signs of a Deep Cyclical recovery in June with the equally weighted S&P Deep Cyclicals outperforming Early Cyclicals and Defensives by 2.4% and 4% MTD. Economic uncertainty remains high, and recession odds are dependent on the path of inflation and the Fed’s reaction to those data. Slowing growth in China is also a headwind. For now, current macro data suggests lower recession odds and clients have pushed out their recession odds as well (details HERE).
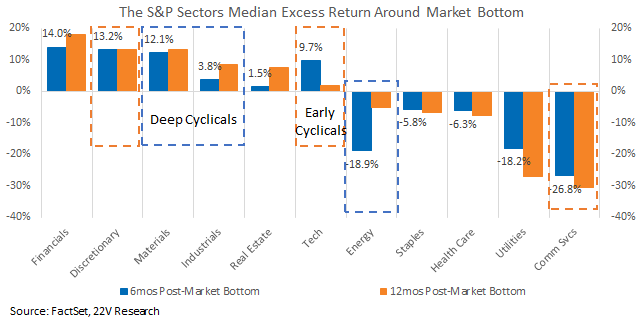
Lower near-term recession odds make the possibility of retesting the market low or a prolonged period of Defensives outperformance less likely. If the bottom is behind us, October ’22 market will mark the cycle low. Historically, Cyclicals outperformed Defensives in the year following market bottoms, and Deep Cyclicals outperformed Early Cyclicals in the latter half of that period. We would not try to time a rotation based on the calendar, but it is useful to remember that curve inversion, which has preceded every recession (though by widely varying lengths of time), has NOT signaled a prolonged period of Cyclical weakness.
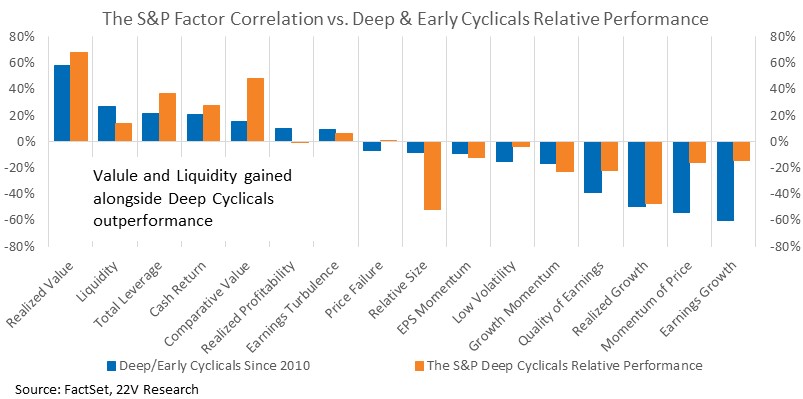
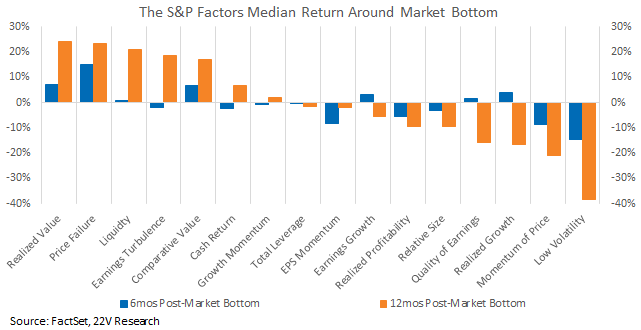
The factors most positively correlated with Deep vs. Early Cyclicals outperformance are Value and Liquidity. They are also the factors that gain the most post market bottoms historically. Suppose Value and risk-on factors gained in the late half of the year post market bottom. Macro uncertainty remains high, and the Fed can derail the market rebound. Assuming inflation continues to trend lower and there is no spike in the urate/claims, we expect the risk-on trend will remain in place into and during reporting season.

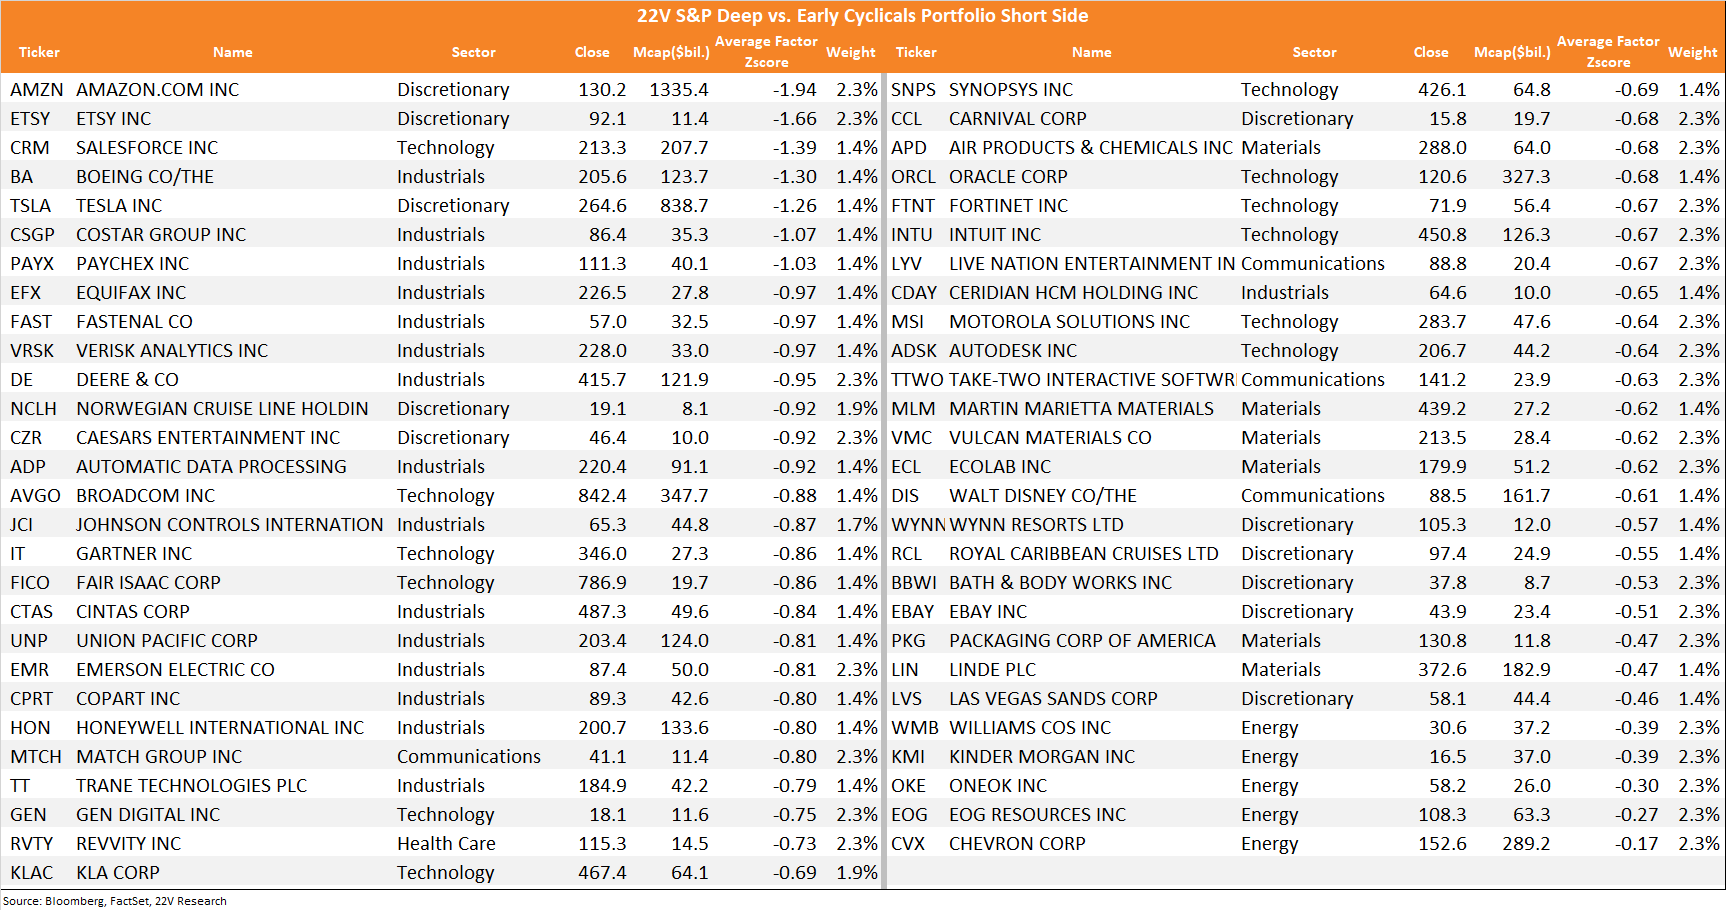
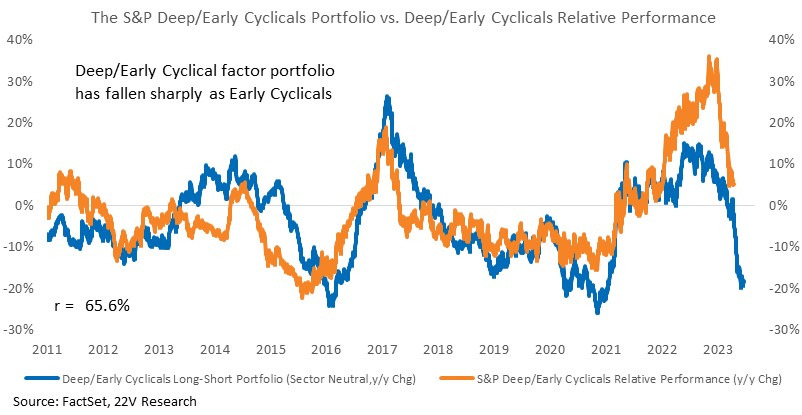
To better break down S&P Cyclicals, we looked at the factors that tend to perform best when Deep outperforms Early Cyclicals. Below is a portfolio built by screening all Cyclicals for the factors that perform best during periods of Deep Cyclical leadership. Performance of the long-short basket has been roughly in line with Deep vs. Early Cyclicals relative performance, and the y/y returns to the portfolio are predictably poor. That leaves more room for the basket to rebound if the firm growth and slowing inflation backdrop remain in place.
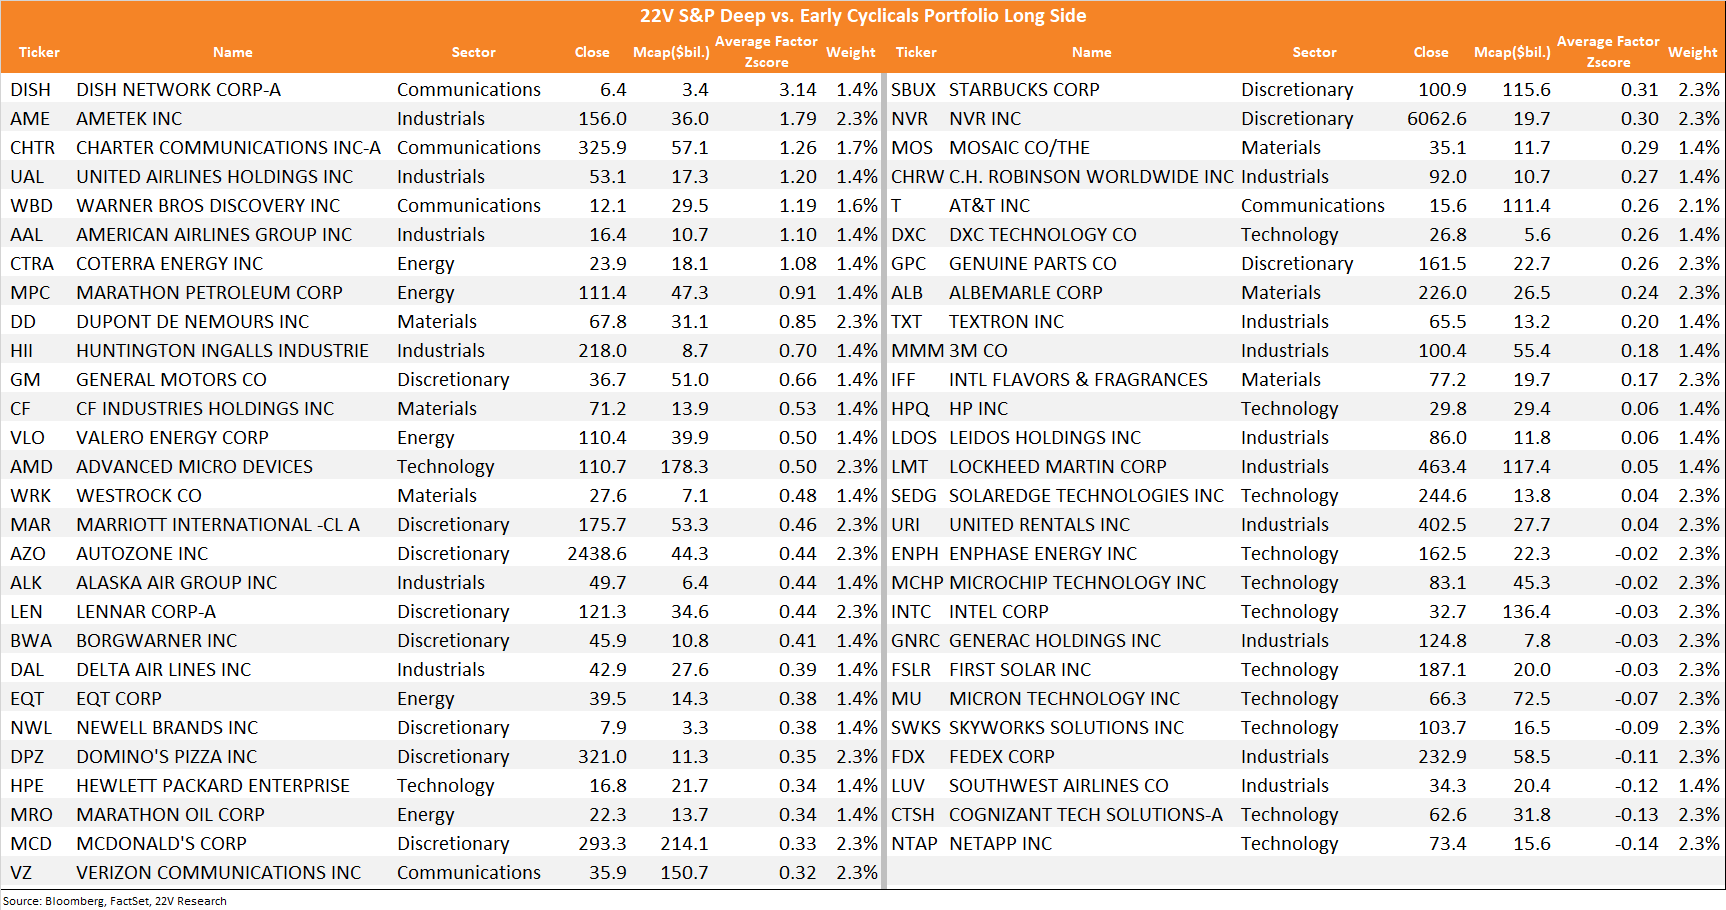
At the end of the report, we list the S&P Cyclical names most exposed to Deep Cyclicals leadership factors. In other words, we list all the Cyclicals that have factor profiles similar to the factors that typically lead during periods of Deep Cyclical leadership. The basket most of negatively exposed Cyclicals is listed as well.
Internals Following Market Bottoms: There have been some early signs of a Deep Cyclical recovery in June with the equally weighted S&P Deep Cyclicals outperforming Early Cyclicals and Defensives by 2.4% and 4% MTD. Value and Liquidity are the factors most correlated with Deep Cyclicals relative performance historically, and both have gained in June as well. Economic uncertainty remains high, and recession odds are dependent on the path of inflation and the Fed’s reaction to those data. Slowing growth in China is also a headwind. For now, current macro data suggests lower recession odds and clients have pushed out their recession odds as well (details HERE).
Lower near-term recession odds make the possibility of retesting the market low or a prolonged period of Defensives outperformance less likely. Single indicators of recession risk have been particularly poor predictors of market trends in the current period. The inversion of the Treasury curve (10yr-3mo) occurred at nearly the same time as the bottom in the S&P (price and PE, HERE). One year from market low, Cyclicals generally outperform Defensives overall, and Deep Cyclicals tend to gain in the later half of the year. We would not try to time a rotation based on the calendar, but it is useful to remember that curve inversion, which has preceded every recession (though by widely varying lengths of time), has NOT signaled a prolonged period of Cyclical weakness.
Historical factor returns one year after market bottom seems are roughly in line with factor performance so far in June as well. Risk-on and Value factors gained especially in the later half of the year following bottoms (detail HERE). Macro uncertainty remains high and the Fed can derail the market rebound. Assuming inflation continues to trend lower and there is no spike in the urate/claims, we expect the risk-on trend will remain in place into and during reporting season.
Isolating Attractive Cyclicals: To better break down S&P Cyclicals, we looked at the factors that tend to perform best when Deep outperforms Early Cyclicals. Below is a portfolio built by screening all Cyclicals for the factors that perform best during periods of Deep Cyclical leadership. Performance of the long-short basket has been roughly in line with Deep vs. Early Cyclicals relative performance, and the y/y returns to the portfolio are predictably poor. That leaves more room for the basket to rebound if the firm growth and slowing inflation backdrop remain in place.
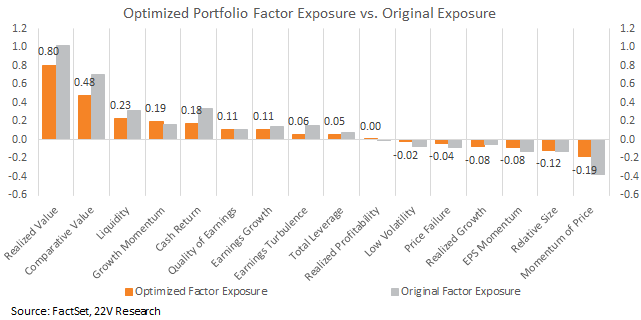
The portfolio above was optimized to minimize overall factor exposures but leave the Value/risk-on tilt. In line with benefited factors during Deep Cyclicals’ outperformance, the basket is more exposed to Value and Liquidity factors, while less exposed to Momentum and Growth.
Below are the S&P Cyclical names most benefited from Deep Cyclicals relative outperformance within each sector. In other words, stock returns of the Cyclical names below are more sharing Deep Cyclicals characteristics.
The S&P Cyclical names most sharing Early Cyclical characteristics in each sector are listed below as well. Outperformance of Early Cyclicals should bring more tailwind to them.