Weekly – Same start to the weekly… again. The high-frequency data did not support near-term recession risk. This week’s difference was data suggesting the Fed might need to be more hawkish. We noted the payroll data was not overly hawkish as the urate jumped to 3.7% and the average workweek declined. But the mix of wages came in on the hot side. The Atlanta Fed, wage growth tracker, confirmed the strength in wages last Friday. The unsmoothed version, which Gerard has been leaning on recently, rose from 5.1% last month to 6.5% this month, exactly reversing its decline from a month ago.
The link from the Wage Tracker to the ECI is imperfect, but these data reinforce that the ECI, the “gold standard” of wages, is not set to fall steeply. The Fed is focused on wages as they assume wages are most correlated with core services, ex-rent, inflation.
On the one hand, recession odds continue to decline, given how stubbornly strong wages have been. Strong wages and firm employment reinforce our long “destocking losers” and risk-on factors in general theme (HERE). Consumer spending will stay around its current 2%ish rate. Net worth effects are still a major support for demand as well. Last Thursday’s updated net worth data shows an increase in net worth “SHOCK” from Jan 2020 to Jan 2022 of $34 Trillion. January 2022 was when the Fed started to tighten, and equities started to decline. The equities portion of net worth has declined while home equity continues to grow. The total net worth shock from Jan 2020 to 1Q23 was $32 Trillion. Lower, but still massive, and is why savings rates are lower and spending levels higher.
On the other hand, there is an increased risk of the Fed sounding more aggressive this week, indicating more urgency to slow economic growth. That would tighten financial conditions and support a Defensive factor rotation. How Powell sounds at the FOMC press conference, what the Summary of Economic Projections (SEP) show on Wednesday, and CPI will be important.
CPI Tuesday & Financial Conditions: Gerard estimates core services ex-rents are expected to be ABOUT 25 bps. That is his conclusion when looking at current consensus estimates. A June hike would be back on the table if we see a 40bp. Assuming a consensus-like CPI number, unless the Fed SIGNALS more urgency toward slowing economic growth, don’t expect a significant tightening of financial conditions. A hike at the July 26th meeting and no cuts for the rest of 2023 are priced into futures markets.
Here is Gerard’s inflation and economic bottom line: “The first stage of the disinflation was easy and reflected Covid related “shocks,” including excessive demand stimulus, dissipating. With the shock inflation in the rearview mirror, the embedded inflation resulting from the current and recent labor market position remains. The higher the wage figures are, the greater our sense of embedded inflation, particularly with the “catch-up” effect on nominal wages, presumably in retreat. If wage growth is not slowing steeply in response to the reduced catch-up effect, then something else is presumably going on, which – we surmise – is that the labor market is tight. And addressing that will take time and require some sacrifice of employment, according to the “standard” model, which is unreliable but perhaps the least bad way of thinking about things looking forward.” This last part is most important. It is not a given that the Fed has to be super aggressive. They might just keep rates around these levels for a long time. And the economy could be just fine for an extended period (slowing growth, but not too quickly) with the current level of rates.
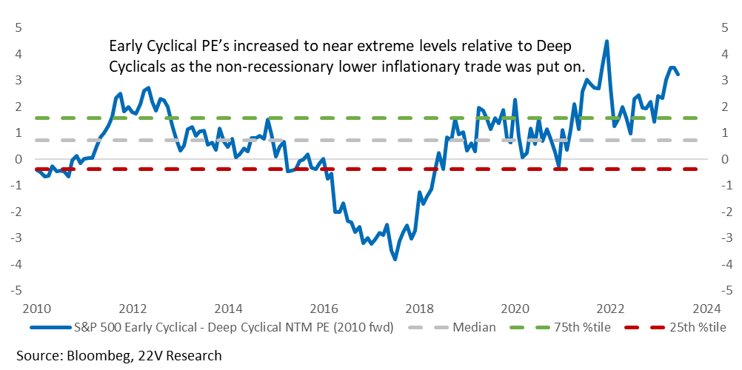
FYI Mean Reversion – Long Destocking Losers & Risk-On Factors: The economy is still in Transition (HERE), and transition periods are prone to mean reversion. Mean reversion favors Deeper Cyclicals, Retail, transports, and small caps relative to mega caps. Retail and transports have been hit particularly hard by “destocking”. The labor markets remain firm, though, which should keep consumer spending healthy (roughly 2% is the current trend), and housing data has already bottomed. Given the inventory unwinds in 1Q23 (HERE), if economic growth stays firmer for longer, production should pick up, and the “destocking losers”, which have had terrible performance, would have a significant bounce over the next month. The median NTM PE spread between early and deep cyclicals (2010 forward) is in its 98th %tile.
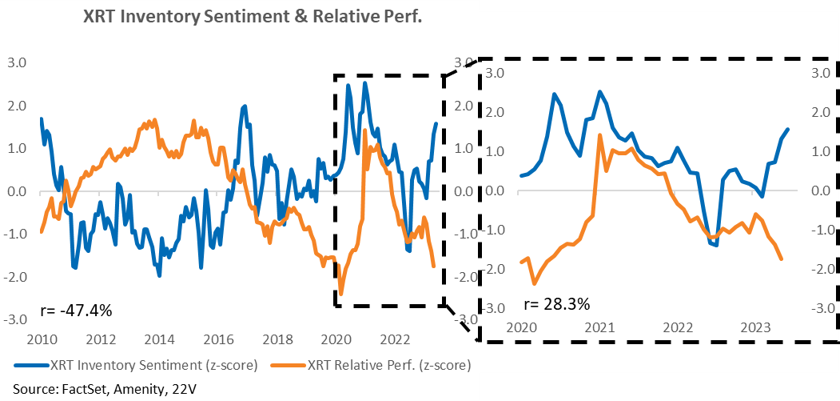
Inventory sentiment, an objective score of management sentiment around inventory levels/outlooks, measured using the Amenity natural language processor, has increased for the members of XRT. In short, what companies say about inventories, or the future of inventories, is much better.
Charts below…
Indicators, Other Charts & Starting With a Fair Value Update: Stocks are trading at the high end of consensus fair value. Under certainty of a soft landing, there is upside to ~4600 (details below). But certainty is absurd given the macro headwinds. Data will move soft landing odds around. As those odds shift, so too will fair value. Unless data/the Fed supports the soft landing scenario next week, headline market gains are limited from here.
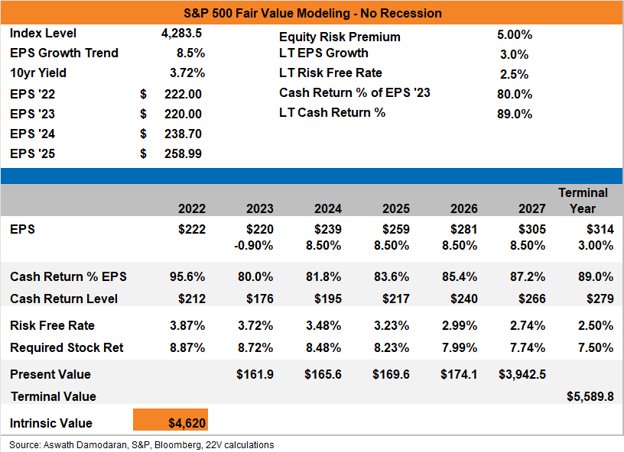
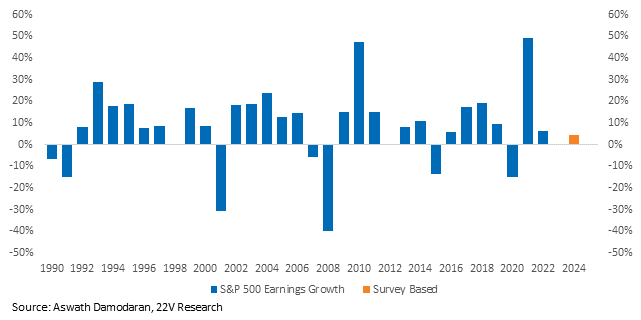
Survey-based EPS growth from 2023 to 2024 ($220 to $230) represents an unusually bad growth rate outside of a recession, especially post-GFC forward. The consensus for 2024 ($242) is probably still WAY too high, but there is upside relative to investor expectations.
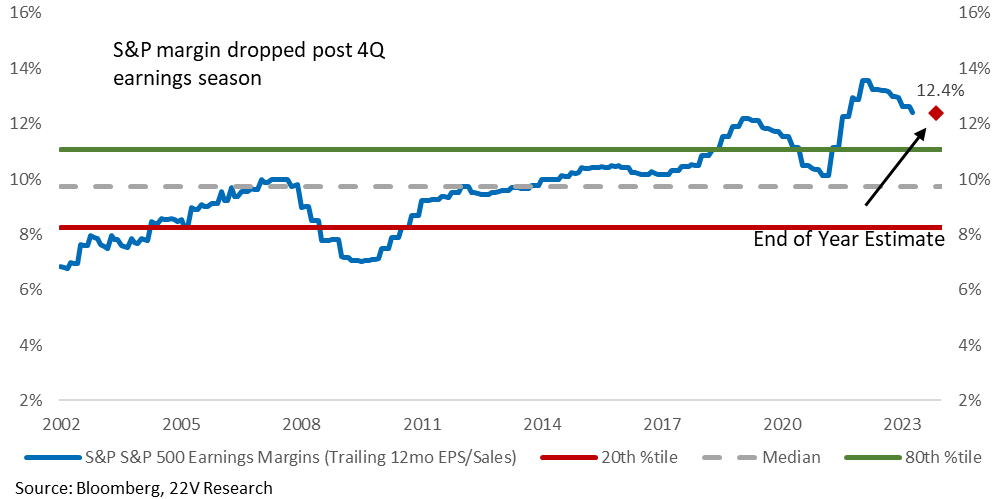
We hosted a profits webinar with Dan Greenwald last Wednesday (replay HERE). Profit and profit shares are a function of margins. Margins are under pressure because trend economic growth is slowing, but a deep decline in margins is unlikely outside of a recession. Additionally, S&P profitability has been in an uptrend for most of the past 30 years and has NOT been mean reverting. We see no reason for that to change in the medium term (longer-term is a different discussion). Under a soft landing, the survey-based eps path may be too conservative. Longer-term trend eps growth (8.5%) would still be below the post-GFC median and average.
An ERP of 5.25% is slightly lower than the current level (~5.4%). The ERP has dipped below 5% several times in the post-GFC era. 5% is towards the low end of the range but would be reasonable under a soft landing. ESPECIALLY if you believe the Implied ERP will decline from its unusually high post-GFC levels in a more normalized inflation regime (deflation was the fear in the post-GFC period).
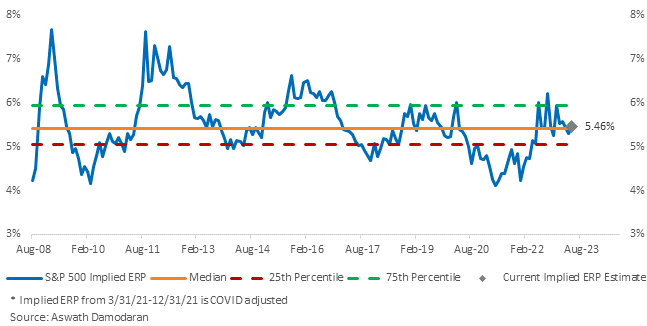
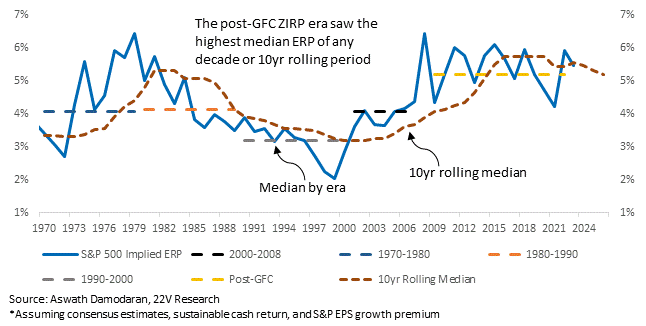
The post-GFC, zero-lower bound era saw the highest median ERP of any decade. Suppose rates stay higher for longer this cycle (because nominal GDP and inflation are sustainable higher relative to the post-GFC backdrop). In that case, the ERP may shift lower, especially with S&P profitability set to stay high medium-term.
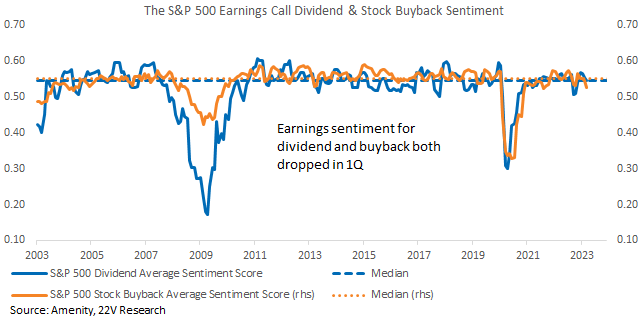
We assumed a lower-than-normal cash return ratio because growth is below trend, and dividend and buyback sentiment have rolled over. Those conditions are still in place, so we would not raise this estimate.
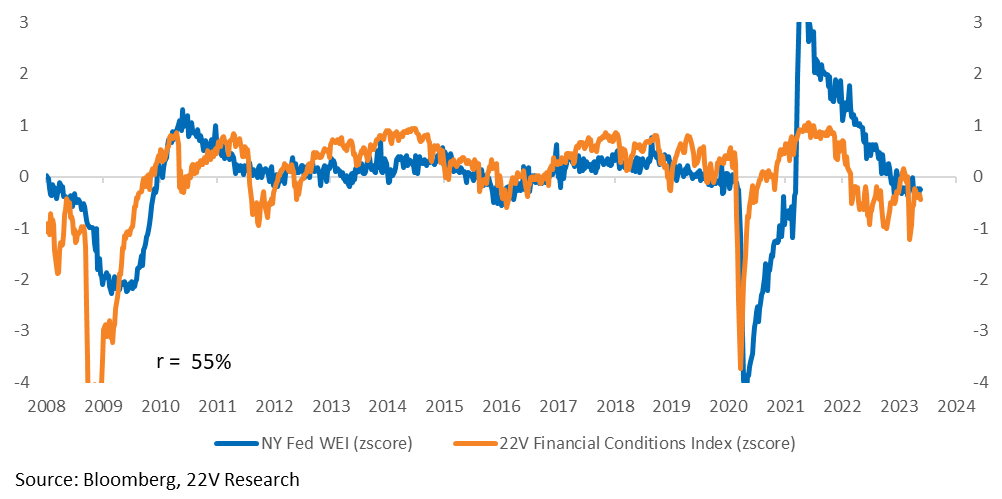
Fed Risk: If the Fed SIGNALS a more aggressive pushback against economic strength, financial conditions will tighten at at time when “underlying demand” (The New York Fed Weekly Economic index represents underlying demand in the chart below) is running at about 1%. 1% is not far from zero, so recession odds would increase if the Fed gets more aggressive. That is not an issue for now, and stable to easier financial conditions would favor deeper Cyclicals and risk-on factors in general.
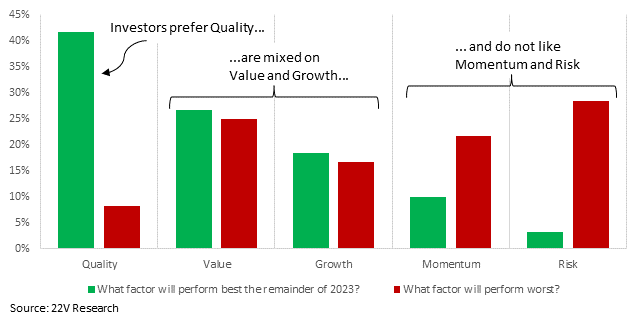
Investor Sector & Factor Sentiment: According to our latest investor survey (HERE), investor are not positioning for a short-term risk-on factor and sector call. There remains a strong preference for Quality through year-end. Risk and Momentum are the least liked factors. Risk-on factors should move higher over the next month or so as recession risks ease and the strong Momentum/mega cap move of the past month is reversed.
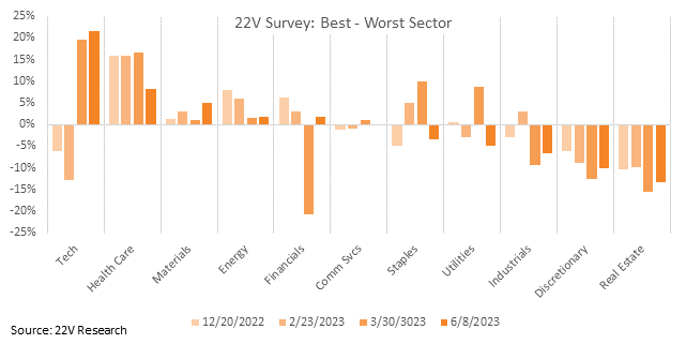
Since late last year, Tech has gone from one of the least liked to the most favored GICS sector. That is consistent with the still heavy investors preference for Quality. Defensives were and have become more out of favor throughout 1H23.
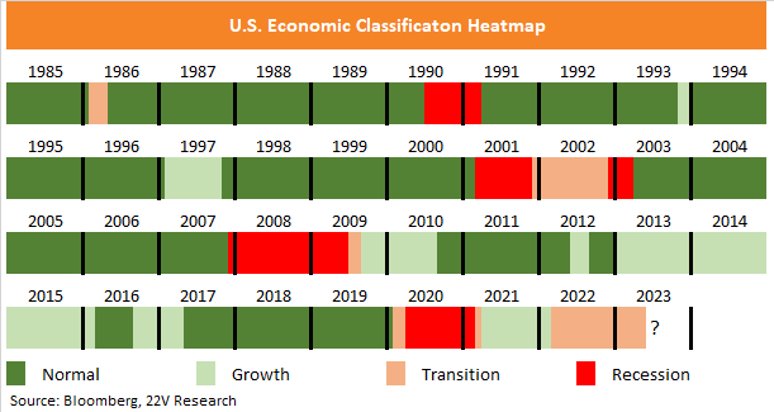
Transition Economy: The economy remains in Transition for another month as macro data is still mixed with no clear sign that a recession is imminent OR avoidable. Transitions are the rarest macro regime historically, accounting for just 7.4% of months. The current Transition backdrop started in 2022 and accounts for half of all Transition classifications back to 1985. The bottom line is the economic data has been unusually distributed for over a year, encouraging higher correlations and increased mean reversion.
This week we talked about how the “destocking losers” XRT and IYT stand to benefit from lower near-term recession risk. The destocking headwind should fade with an ok economy and strong labor markets. Inventory sentiment, an objective score of management sentiment around inventory levels/outlooks, measured using the Amenity natural language processor, has increased for the members of XRT. In short, what companies say about inventories, or the future of inventories, is much better.
With economic growth much stronger than anticipated (our investor surveys pointed to 80-90% odds of recession for most of 2023), wages still running above 4%, bank strains abating, and small and medium sized banks increasing C&I loans last month, being short more economically sensitive names makes less sense today. Early Cyclical PEs (Tech, Discretionary, Comms) are near extreme levels relative to Deep Cyclicals (Energy, Materials, Industrials). The median NTM PE spread between early and deep cyclicals (2010 forward) is in its 98th %tile.
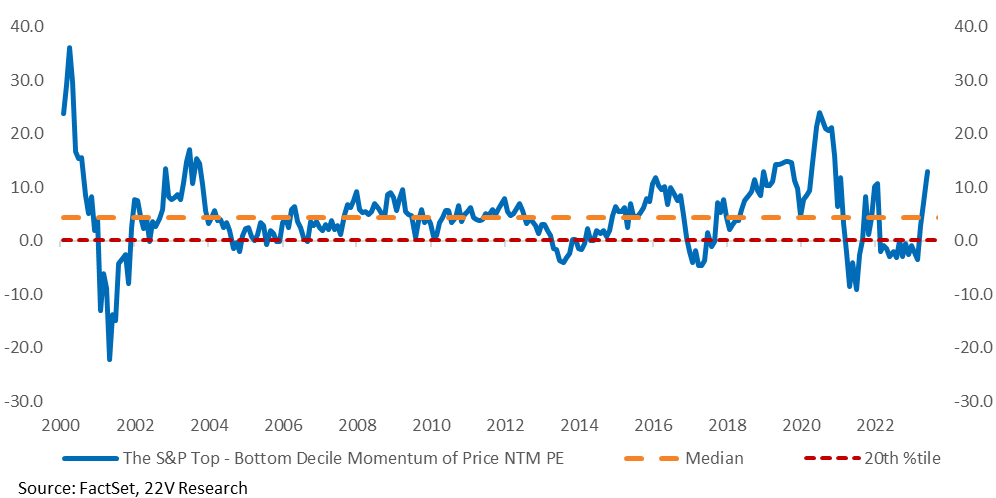
The spread between the median PE in the top decile of Momentum of Price names vs the bottom decile is in its 98th percentile. It has only been this high in the TMT bubble and during COVID. The PE spread could stay wide for months/quarters…
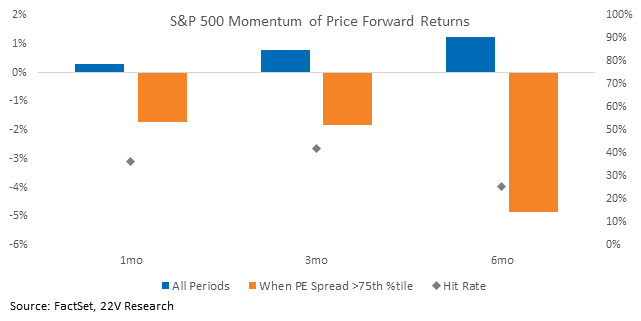
… but the forward return of Momentum or Price is significantly worse than normal when the spread is above its 80th percentile.
LONG DESTOCKING REVERSAL BASKETS: We have detailed a destocking reversal thesis the last few days (HERE, HERE, HERE) and have a basket built to play the theme. We selected the S&P 1500 sub-industries that are the first and second order effects from a destocking reversal – companies that sell economically sensitive goods (ex interest rate sensitive housing goods), and companies that ship those goods. Pure play here…
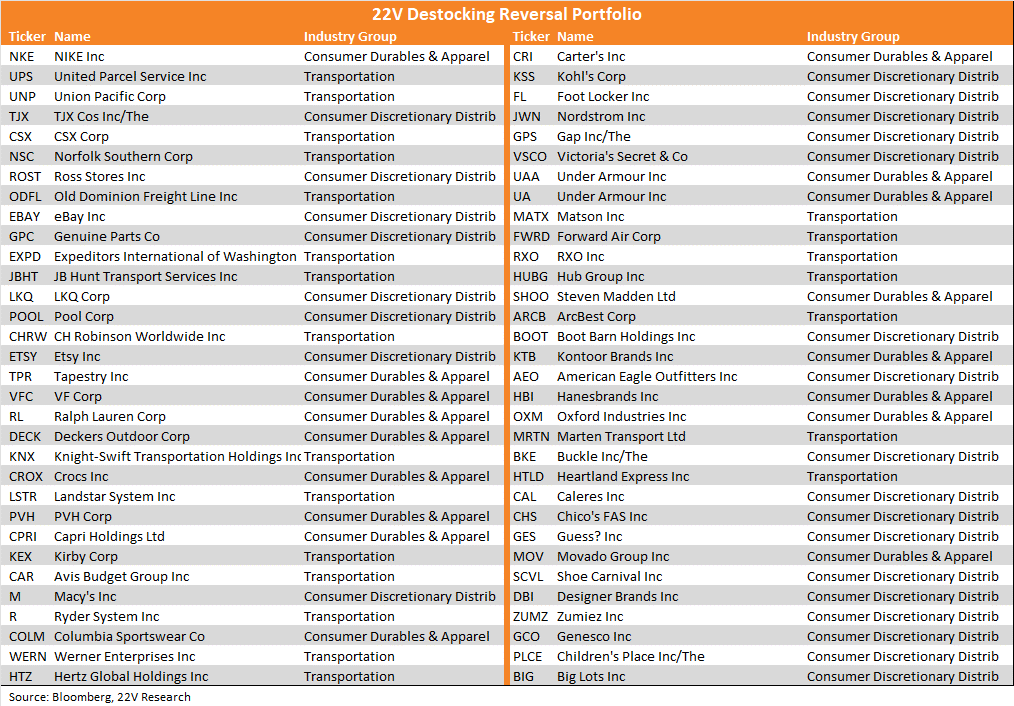
To diminish extreme sector weightings and single-stock risk, we rounded out the basket with other Deep Cyclicals with lower Momentum, an dhigh earnings sentiment. The three criteria (sector, low Mo, high earnings sentiment) are well positioned to reverse off the same trends that benefit a destocking reversal (more HERE). Fuller portfolio here…
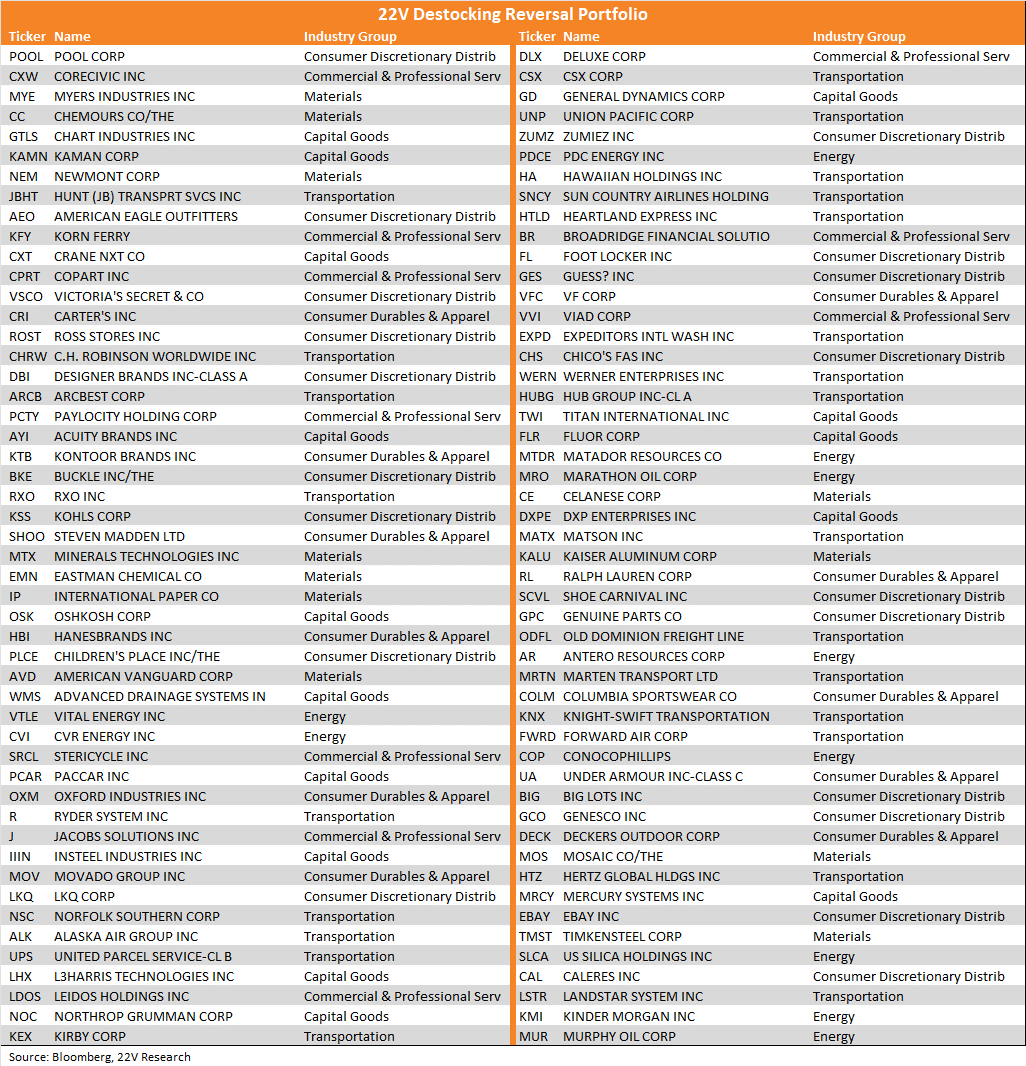
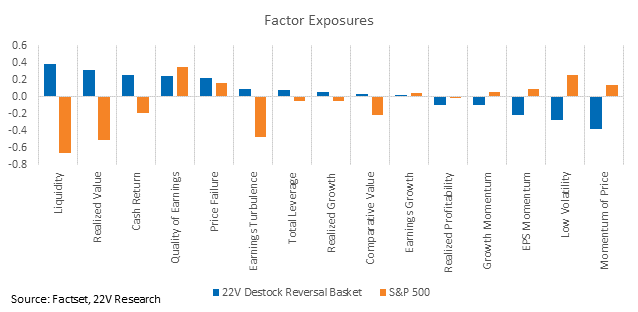
We would vol adjust the baskets, and sizing can be further adjusted to reduce factor exposures. By design, though, this group is long retail and Deep Cyclicals and short high Momentum (short Tech). The factor profile of the full portfolio differs significantly from the S&P, which makes sense given mega caps have been driving the index higher, and we are calling for a reversal of Early Cyclical leadership.