Weekly – Same start to the weekly, different week. High-frequency data did not support near-term recession risk. A strong headline payroll reading, firm claims number, and an “ok” reading on the NY Fed Weekly economic index helped the soft landing narrative. The ISM was still weak, but the level of the IP data (HERE) suggests ISM readings are likely overstating the weakness. Plus, inventory adjustments are also impacting the ISM. If labor markets/consumer spending remain ok, the ISM should improve going forward (more below). The payroll data was not overly hawkish as the unemployment rate jumped to 3.7% and the average workweek declined.
Bottom line, the odds of a soft landing, defined as the Fed easing without a growth accident occurring, rose because inflation indicators were not very problematic, while economic growth indicators were solid.
The Fed & Financial Conditions: Incoming Fed Vice Chair Jefferson strongly signaled a pause last week, and the payroll data didn’t offset that. CPI is unlikely to change the June hike odds unless core services inflation, ex rents, is much higher than expected. Gerard estimates core services ex-rents at the consensus of ABOUT 25 bps. The June hike would be back on the table if we see a 40bp vs. about 25bp expected core ex-rents reading. The base case is now a hike on July 26th, but we have plenty of time between now and then. Unless the Fed SIGNALS more urgency toward slowing economic growth (maybe they signal that June 16th), don’t expect the hike priced in for July 26th to impact financial conditions much.
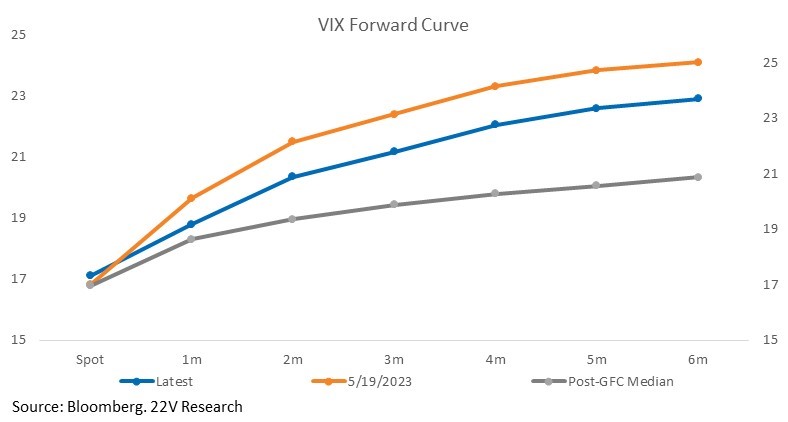
On the Market: Equities broke out above the high end of our 3800-4200 S&P fair value range. As we detailed in our report last Friday (HERE), there is some, but not significant, upside to our fair value estimates if we have a soft landing. The market is not obviously overvalued or undervalued on a cash return basis. As a result, short-term changes in the VIX and broader financial conditions will be the marginal mover of PEs for now. For now, the VIX is steep with spot below its post-GFC median but elevated 6mos out.
We have expected a roughly range-bound VIX and PE until a more pronounced break toward a soft landing OR recession. As soft landing odds have increased (more so than we thought), the VIX has ground lower. We don’t have an apparent reason TODAY, to push back against the lower VIX. Trying to short the market here is hard. Unless you have high conviction view that a recession will become evident soon or there is a much more hawkish tilt from the Fed.
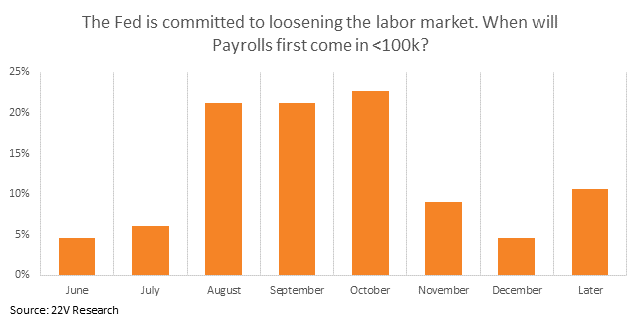
Early = Wrong: We got more defensive in the middle of last week, and quicky gave up on that idea post-payroll. That was bad timing. Our longer-term labor market worry remains, but we have less confidence after the payroll report that the labor market will loosen quickly over the next two months. That makes it difficult to be defensively positioned now. In our latest survey (HERE), almost no client anticipated labor markets weakening before August. 65% think August to October. We have no good reason to disagree with the consensus on the timing. When the labor market loosening starts to happen, recession fears should increase. It is not guaranteed though. Investors might believe in a soft landing.
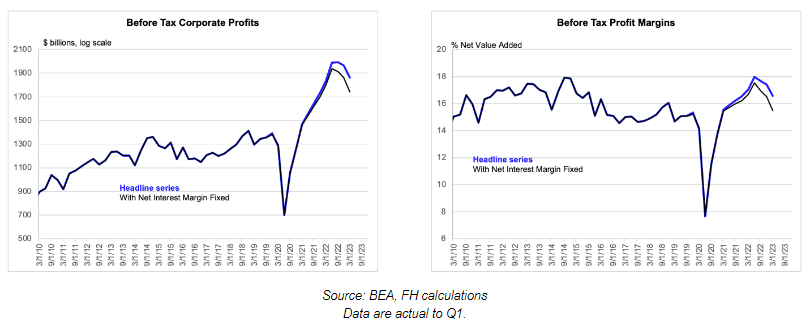
Anyway, the call on labor market weakening in the back half of 2023 is as follows. Wages are running well above underlying demand in the economy, and economy-wide profits are declining (–5.1% in 1Q after taxes more HERE). It seems highly likely, to us at least, that wages will slow going forward in that backdrop (what company likes consistently lower margins?). If that wage decline comes WITHOUT an aggressive increase in the unemployment rate, it would increase soft landing odds.
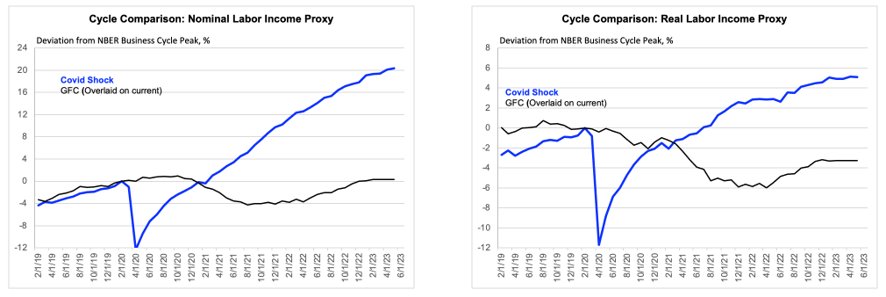
Also, the payroll report was not ALL good news. As Gerard pointed out, “the average workweek fell again this month and the decline there looks increasingly like a trend. That may suggest that labor hoarding is about to let go followed by a big drop of net hiring. That speculation aside, the lower workweek is contributing to weakness in the real labor income proxy, which is defined as the product of employment, the average workweek and average hourly earnings. The 3- and 6-month growth rates there are 0.6% (ar) and 1.2% respectively.” The quits rate also moved back to pre-pandemic levels.
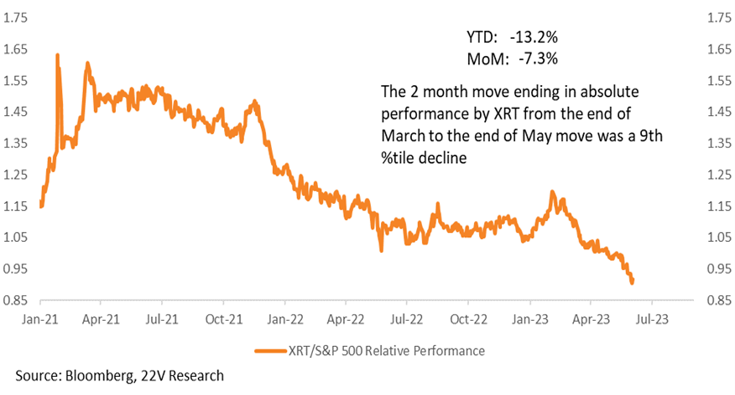
FYI Mean Reversion – Long Destocking Losers: The economy is still in transition (HERE), and transition periods are prone to mean reversion. Mean reversion favors Deeper Cyclicals, Retail, transports, and small caps relative to mega caps. Retail and transports have been hit particularly hard from “destocking”. The labor markets remain firm, though, which should keep consumer spending healthy (roughly 2% is the current trend), and housing data has already bottomed. Given the inventory unwinds in 1Q23 (HERE), if economic growth stays firmer for longer, production should pick up, and the “destocking losers”, which have had terrible performance, would have a significant bounce. At least over the next month.
On Friday, we had several client questions on the ISM/retail earnings weakness reflecting inventory adjustments rather than a consumer implosion. For much of the last 3/4 months, people thought it was a signficant consumer slowdown driving the names. That narrative changes if the labor market doesn’t loosen quickly and the slowing was more inventory adjustment that might end soon.
Charts below…
Indicators & Other Charts: In our latest survey (HERE), almost no client anticipated labor markets weakening before August. 65% think August to October. We would not push back against this timing. Our longer-term labor market worry remains, but we have less confidence after the payroll report that the labor market will loosen quickly over the next two months.
Back Half 2023 Labor Market Headwinds: As Gerard has argued, corporate profitability is falling (HERE) at a time when underlying demand is running about 1%. In that backdrop, it’s tough to maintain current wage growth (which would imply significantly more margin deterioration).
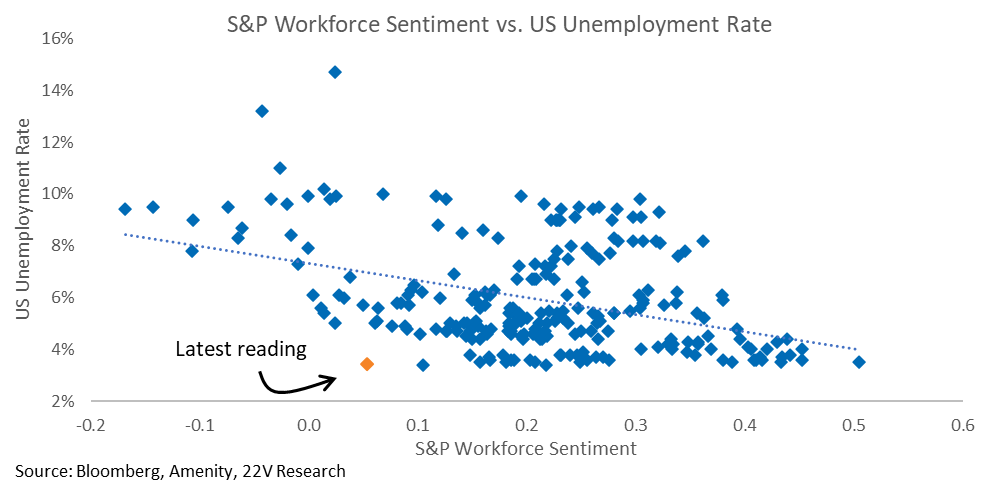
Workforce sentiment, which measures how management teams talk about headcount, hiring, layoffs, and wages indicate the urate should increase.
The lower workweek contributes to weakness in the real labor income proxy, defined as the product of employment, the average workweek and average hourly earnings. The 3- and 6-month growth rates there are 0.6% (ar) and 1.2%, respectively.
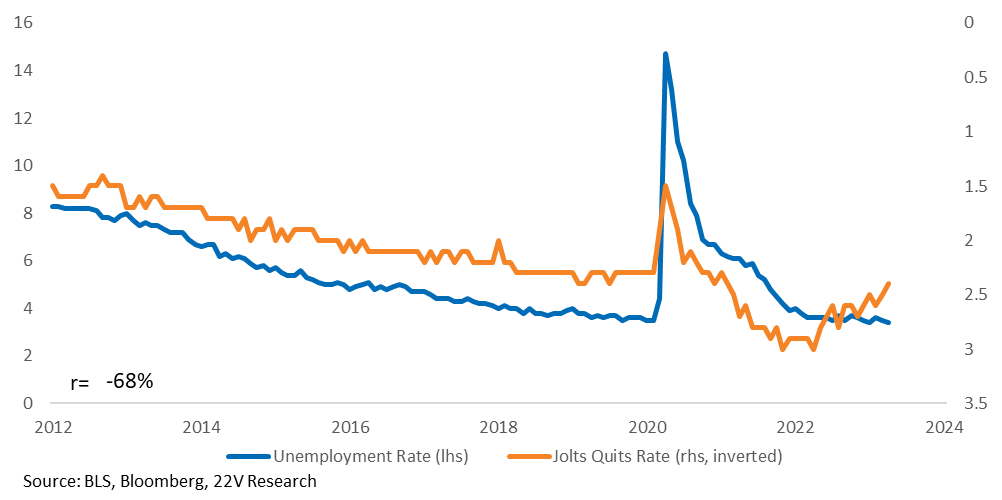
In the JOLTS data last week, job openings increased BUT the quits rate fell. As Gerard puts it, “the quits rate may be a more objective metric, being based on actual employment decisions, rather than mere postings. To quit a job is a big deal. To post — or to forget to remove — a posting is not.” The quits rate indicates a looser labor market, the question becomes can economic activity hold up as this happens? Increases in unemployment tend to be disorderly, re-introducing equity volatility.
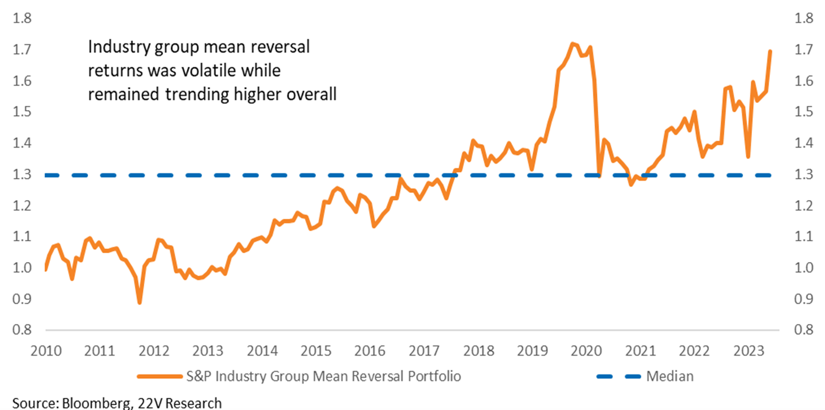
Mean Reversion: Data have been persistently stronger than investors have expected (our surveys), so some mean reversion should be expected in economically sensitive names that have lagged.
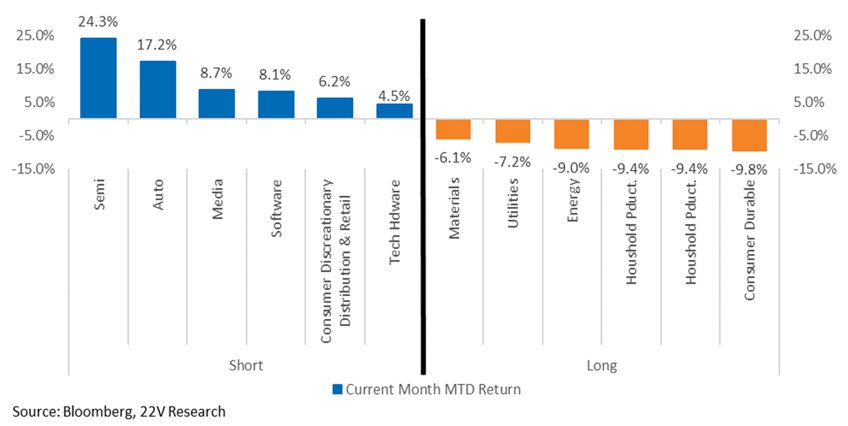
If mean reversion trends persist, that will favor deeper cyclicals and consumer durables at the expense of Tech, Semis, and Auto.
Lower bank risk and a stronger economy should favor some mean reversion in small caps relative to Nasdaq performance. 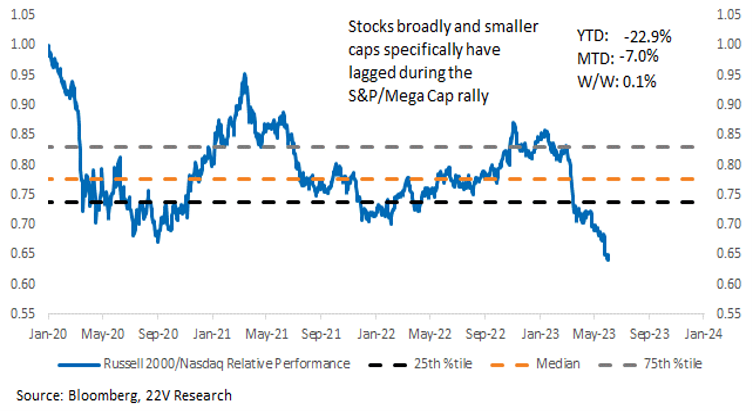
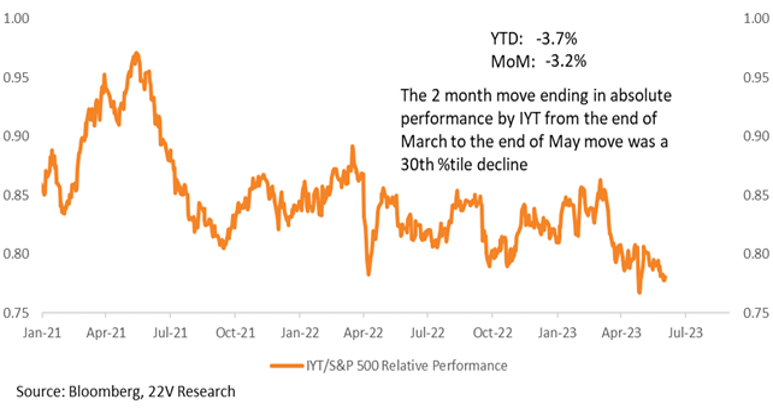
Retail and transports have been hit particularly hard by “destocking”. The labor market is fine now, which should keep consumer spending at healthy levels (roughly 2% spending is the current trend), and the housing data has already bottomed. Given the inventory unwinds in 1Q23 (HERE), if econ growth stays firmer for longer, production should pick up, and the “destocking losers”, which have had terrible performance, would have a significant bounce. At least over the next month. That would favor XRT (retail)…
And IYT (transport ETF).
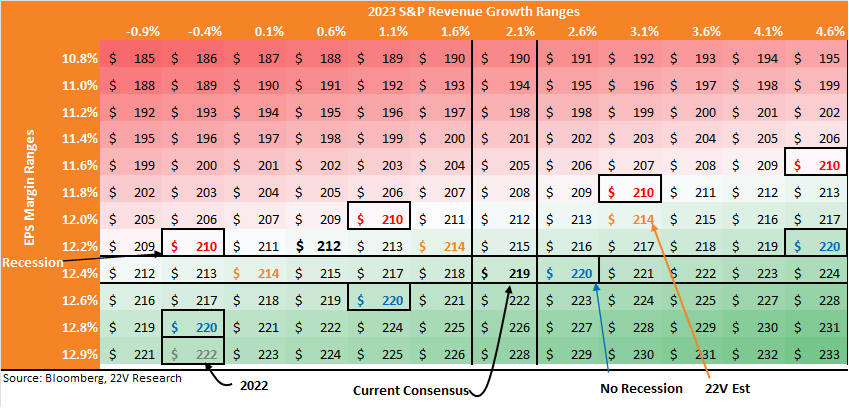
Economy vs S&P Margins: S&P sales and margins do not map 1:1 to overall economic sales and profitability. Even if we knew with certainty the level of economy-wide sales and margins, there would be some uncertainty around S&P EPS. Below, we chart out actual numbers for 2022 ($222 on 12.9% margins), consensus estimates for 2023, 22V’s estimate, and the results of our client surveys. There are a lot of numbers, so to simplify:
- Consensus 2023 – $219 on 12.4% margins (-1.7% EPS growth, margins down 50bp y/y)
- 22V 2023 – $214 on 12.0% margins (-3.8% EPS growth and margins down 90bp y/y)
- Client Surveys No Recession – $220
- Client Surveys Recession – $210
Our surveys did not include a margin question, so we highlighted the different sales growth and margin numbers that result in $220 and $210, respectively.
There are a couple of main points. First, a sub-$200 2023 EPS requires margins to contract about 130bp y/y, sales growth to be MUCH weaker than forecast, or sales to be in line and margins to decline more than 150bp. Second, the range around consensus, no recession, recession, and our own numbers is pretty narrow and can be reached through MANY plausible paths. The bottom line is that from here, the market returns are unlikely to result from a significant shift in fundamentals. PEs are back in the driver’s seat, meaning financial conditions and sentiment are the swing factors.
Market & Volatility: As we detailed in our report last Friday (HERE), there is some, but not significant upside to our fair value estimates if we have a soft landing. The market is not obviously overvalued or undervalued on a cash return basis is the bottom line. Short term, changes in the VIX and broader financial conditions will have a larger impact on PEs as a result. We expect a roughly range bound VIX and PEs until a more obvious break toward a soft landing or recession. Soft landing odds have gone up, which is why the VIX is lower.