Summary: Up until last Friday, the reduction in tail risk and some hope that the Fed would let financial conditions ease while growth remained firm helped drive equities higher. Lower tail risk was related to supply constrains proving less binding on inflation. A New York Fed analysis of the relative importance of supply versus demand-side factors on inflation found 60 percent of U.S. inflation over the 2019-21 period was due to the jump in demand for goods while 40 percent was a result of supply-side issues that magnified the impact of higher demand. The main point is that as demand cools so too will inflation.
And that is where it gets tricky. Demand is still too hot near term. As we have harped on repeatedly (HERE), the New York Fed Weekly Economic Index still shows above trend growth at a time of still tight labor markets. Demand that is still too strong is why Powell said on Friday that “reducing inflation is likely to require a sustained period of below-trend growth. Moreover, there will very likely be some softening of labor market conditions.” Maybe the payroll report shows weakening in the labor market next Friday, but if payroll comes in around consensus (330k headline, 3.5% urate and 5.2% wage growth), that will show a firm economy/labor market and reinforce that financial conditions are biased to tighten. We think September will show a bias to tighten, which should favor Low Volatility names at the expense of high Earnings Turbulence as the Quant team discussed last week (HERE).
Longer Term on The Fed/Risk Asset Backdrop: The Fed is transitioning to a world where the level of the funds rate not the size of the interest rate hikes is the most important factor. This transition is tricky, but Powell/Fed speakers have succeeded in pulling it off for now. Rate cuts in 2023 have been basically priced out. Now it’s a question of what level they stop at. The range seems to be 3.25% to 4%. If it becomes clear that 3.25%/3.5% is the stopping point, that will be bullish. It might sit there for 2 years though.
Back to The Short Term Financial Conditions Tightening & Factor Rotations: Equity market conditions tend to move with credit market conditions (and Treasuries, which is why the VIX and the MOVE are highly correlated). And we have seen that over the pasts six week. Credit conditions have been easing with spreads narrowing across the board. Easier credit conditions that spur investment/hiring are opposite the Fed’s goals. The next phase of tightening should be driven by credit conditions. Broadly speaking, risk-off and Growth factors benefit most from wider spreads, consistent with general trends during periods of tightening conditions. Relative to the early and volatility driven phase of tightening, Quality tends to perform better during the credit driven portion of tightening. Momentum factors have tended to work well too, just much less so than during early phases of tightening.
So the market is bounded right now. However, we would not be negative on the market below 3,800. Being negative at 3,800 would require higher conviction that a deep recession is likely. We continue to believe the odds of a deep recession are low. The private sector surplus and less sticky supply constrained inflation than feared is the big driver of that call. FYI: Multiples have expanded during the rally but are about 2 points lower over the past week and are still WELL off their highs, even as financial conditions eased. The setup with implied volatility is similar. Equities will move lower during the next round of financial conditions tightening, but the magnitude of that decline will be smaller.
Full Weekly Report Below…
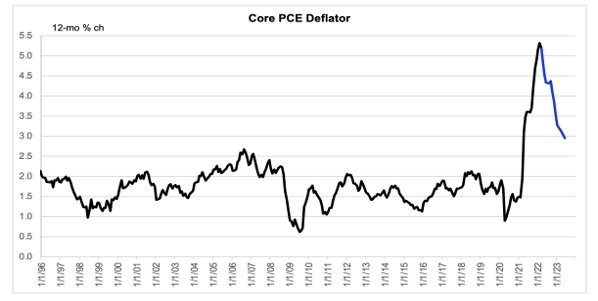
Indicators & Themes: Investors seem to understand that the “easy disinflation” is about to set in. Gerard’s middle-up PCE simulation has Inflation falling to roughly 3% on a core basis by 1Q23. The Fed insisting on taking inflation to 2% near-term, means a recession is very likely, but that debate can be next year. For now, inflation is going to move lower and it will be too high of a level, but it is moving lower. That means tail risk is reduced…
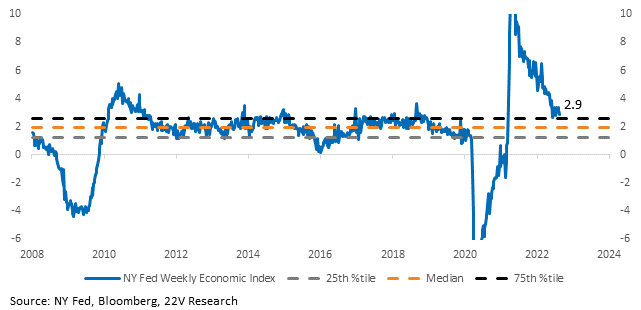
The reduction in tail risk has do to with the realization that supply constrains are much less binding on inflation. A New York Fed’s analysis of the relative importance of supply-side versus demand-side factors on inflation finds that 60 percent of U.S. inflation over the 2019-21 period was due to the jump in demand for goods while 40 percent owed to supply-side issues that magnified the impact of this higher demand. The main point, as demand cools, so will inflation. And this is where it gets tricky. Demand is still too hot near term! As we have harped on repeatedly (HERE), the New York Fed Weekly Economic Index still shows above trend growth at a time when labor markets are still very tight.
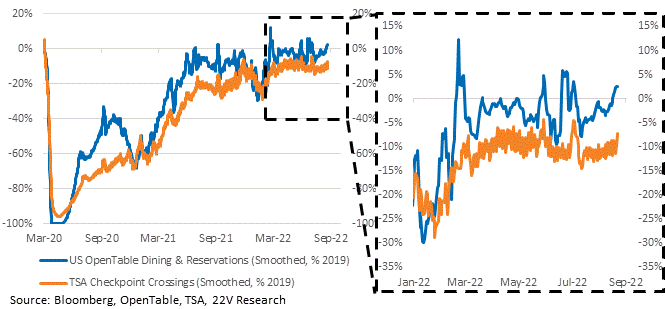
High frequency data in the US was poor last week with S&P service PMI and housing data very weak. Two important offsets to that data though. High frequency restaurant and TSA crossing data have not slowed, and core retail sales came in higher-than-expected.
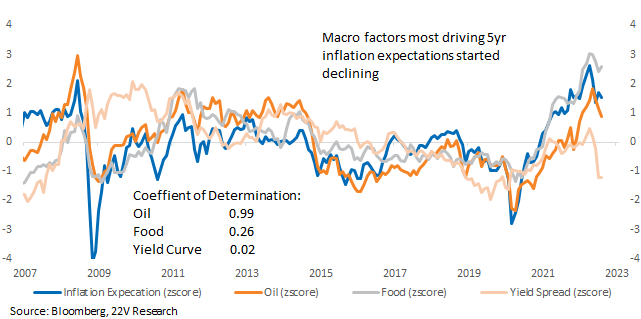
Based on our Dynamic Factor model, inflation expectations have been unusually tied to changes in oil prices. While economic activity has slowed, demand remains too strong, and the macro factors driving inflation expectations have rebounded slightly. More tightening from the Fed or tighter financial conditions are needed to offset China’s stimulus measures.
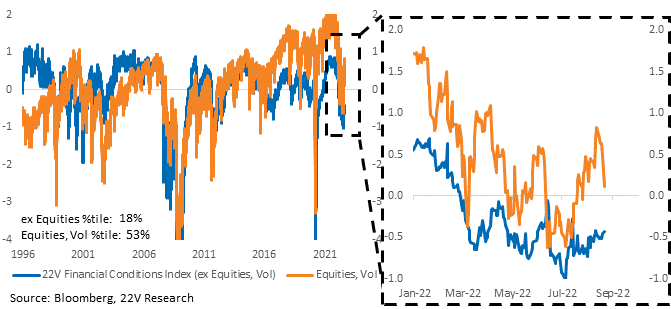
Internals & What to Watch: The direction of travel over the next few months, barring surprisingly weak data, will be a Fed that wants demand growth to slow. Financial conditions are biased tighter under that scenario. The initial phase of tightening has been mostly the result of equity volatility.
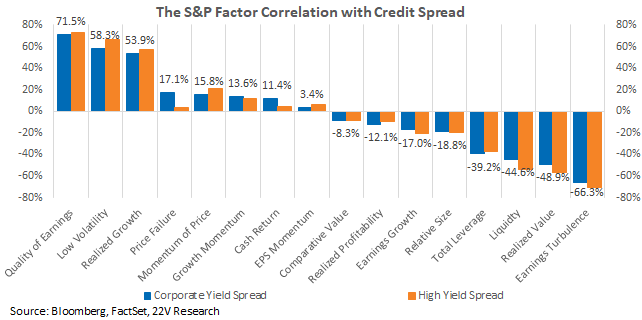
The next phase of tightening should be driven by credit conditions. Broadly speaking, risk-off and Growth factors benefit most from wider spreads, consistent with general trends during periods of tightening conditions. Relative to the early and volatility driven phase of tightening, Quality tends to perform better during the credit driven portion of tightening. Momentum factors have tended to work well too, just much less so than during early phases of tightening.
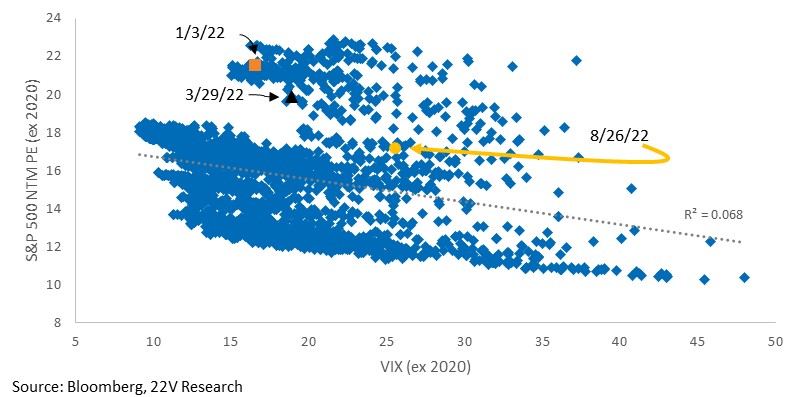
Multiples have expanded during the rally but are about two points lower over the past week and are still WELL off their highs, even as financial conditions eased. The setup with implied volatility is similar. Equities will move lower during the next round of financial conditions tightening, but the magnitude of that decline will be smaller.
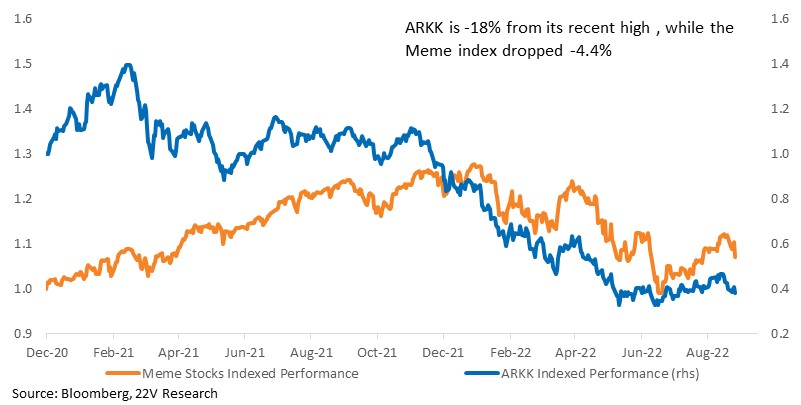
High volatility and low quality Tech names also face headwinds as financial conditions tightened again and investors embraced risk-off factors. ARKK dropped again since its recent high last week and has lost -18%. Meme stocks have following similar trend falling -4.4%.
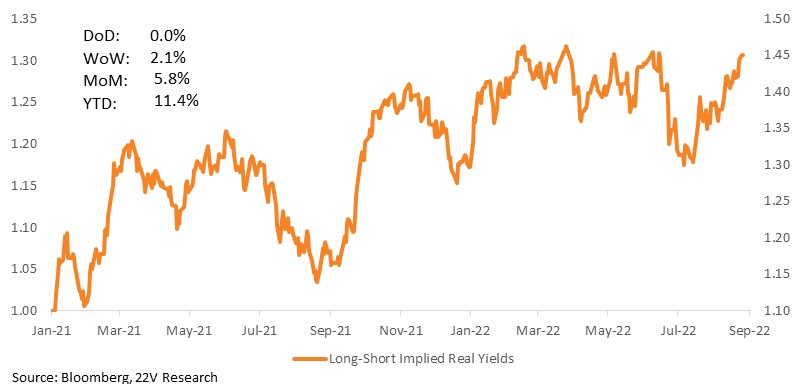
Jackson Hole is behind us, but payroll is next week, CPI the week after, accelerated QT in Sept, and the Sept FOMC meeting. Companies that benefit from higher implied real yields have outperformed, while companies levered to higher fed funds have not. That indicates 1) investors don’t believe peak Fed Funds to be much higher than is currently priced (an opportunity to shock the market is if Powell signals a higher terminal rate at some point), and 2) economic growth prospects have improved (or tail risk has declined), which explains higher yields. Companies that benefit from higher implied real yields have outperformed.
Consistent with the improvement in economic growth prospects, Cyclical’s have outperformed Defensives.
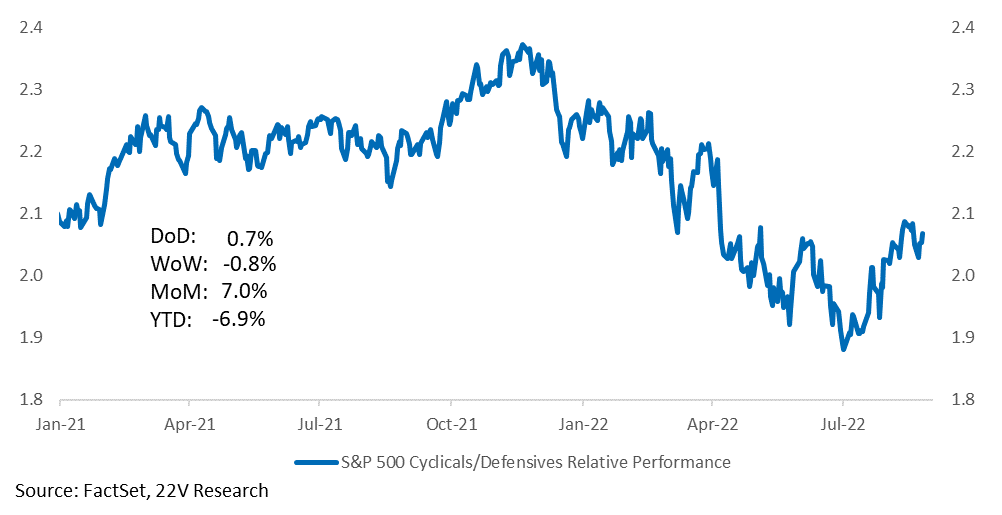
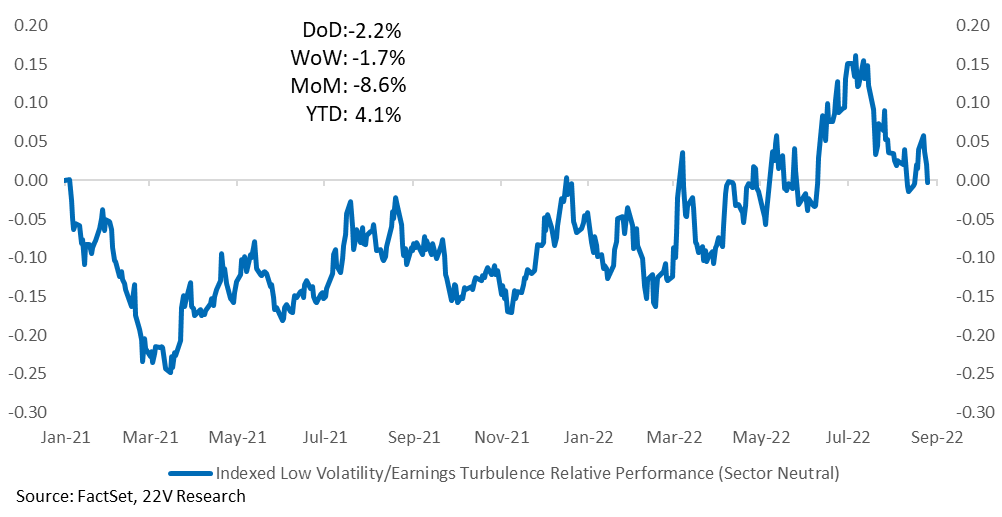
tightening conditions should favor Low Volatility names at the expense of high Earnings Turbulence as the Quant team discussed last week (HERE). What is important for investors to internalize is that risk-on factors and Cyclicals are outperforming WITH stocks that benefit from higher real rates. That is the opposite of what happened for the first 6 months of the year. Companies that benefit from higher real yields outperformed as Cyclicals got crushed and Low Vol surged.
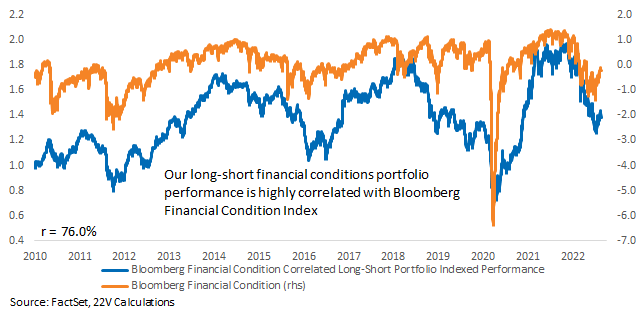
A 22V Quant report last week (HERE) looked at stock correlations with the Bloomberg Financial Condition Index and constructed a long-short portfolio that benefits from the expected tightening of financial conditions. The constituents of the portfolio can be found at the end of the report. Historically, the performance of the long-short portfolio is highly correlated with the financial condition changes. We also highlight the industry groups with the most positive and negative correlations to higher stock and bond volatility. Defensives have the most positive correlations (Pharma, Utes, Staples) and Software, Consumer Durables, Media Banks, and Diversified fins the most negative.
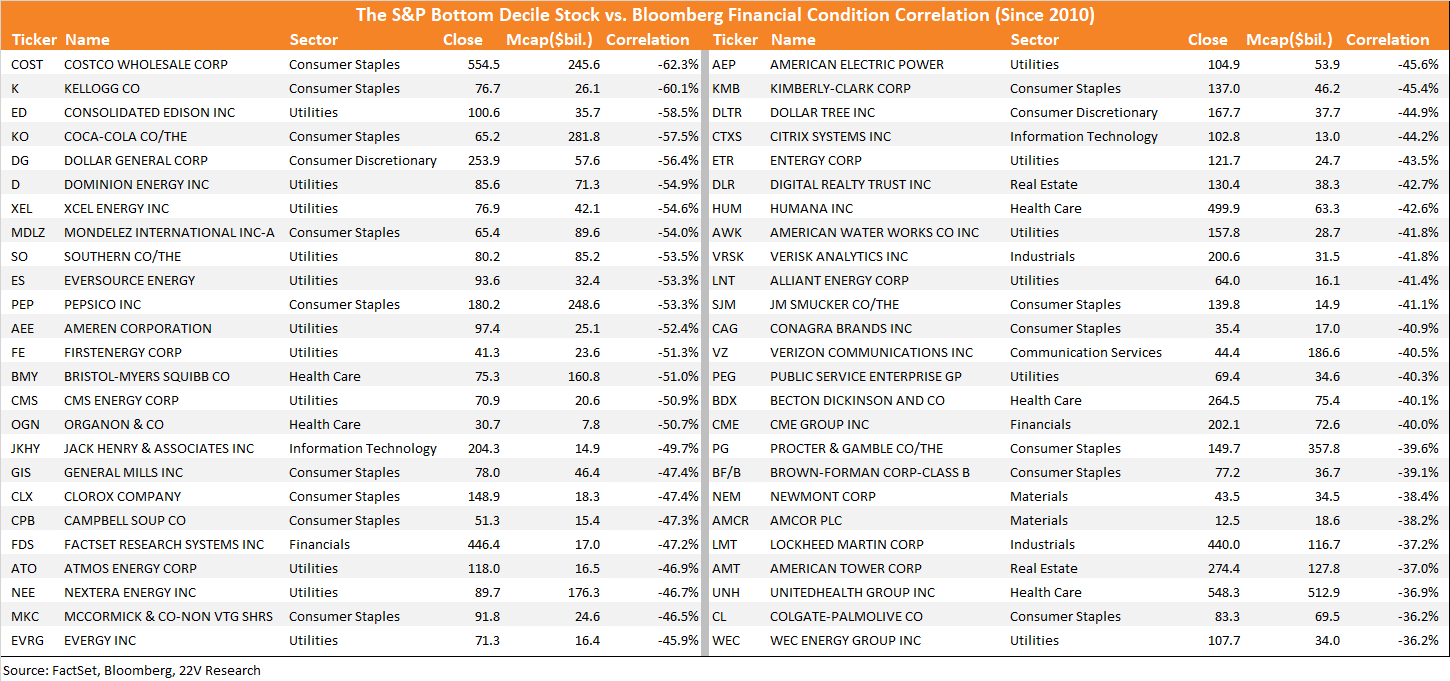
Below we list the S&P names that has the lowest correlation with Bloomberg Financial Condition Index. This is the long side of the tightening financial conditions portfolio and will benefit if the financial conditions tighten. We can also run stock correlations to customized basket. Please let us know if you want us to run your portfolio.
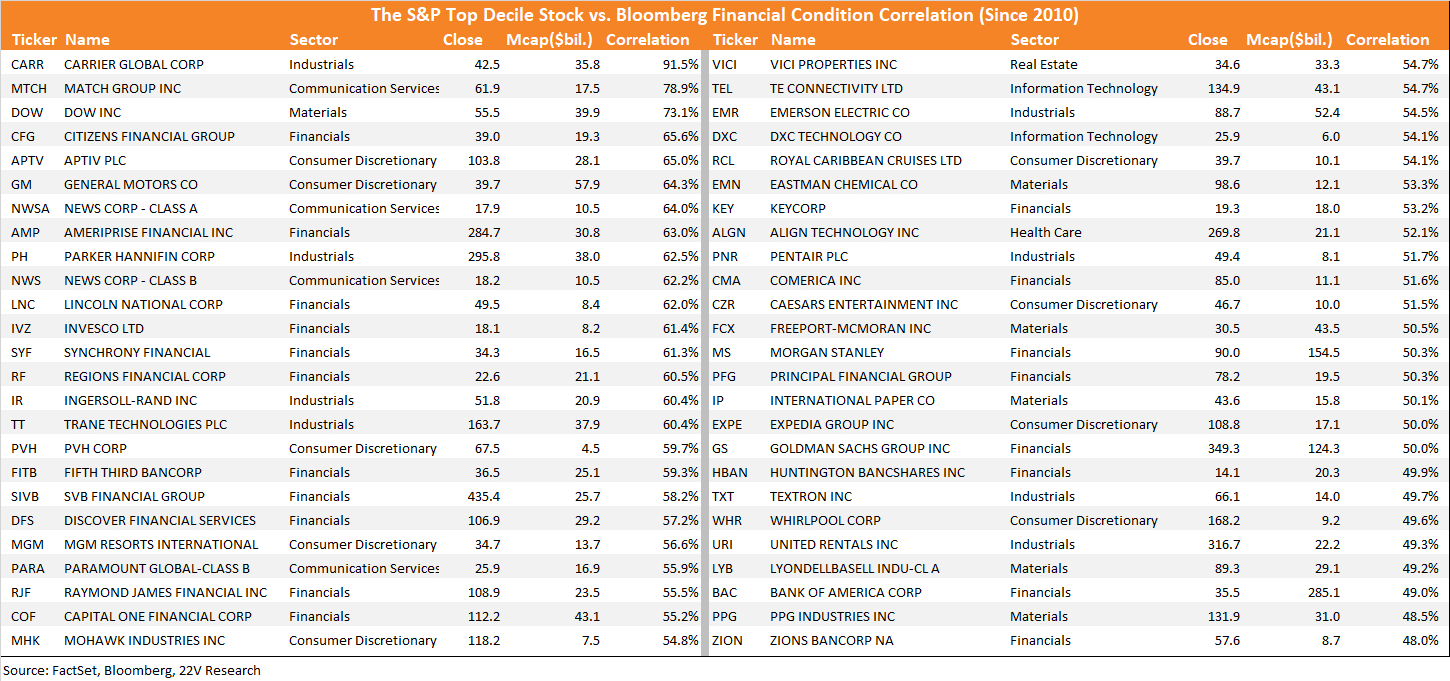
Below are the S&P names most positively correlated with Bloomberg Financial Condition Index and are the short side of the portfolio as financial conditions tightened.
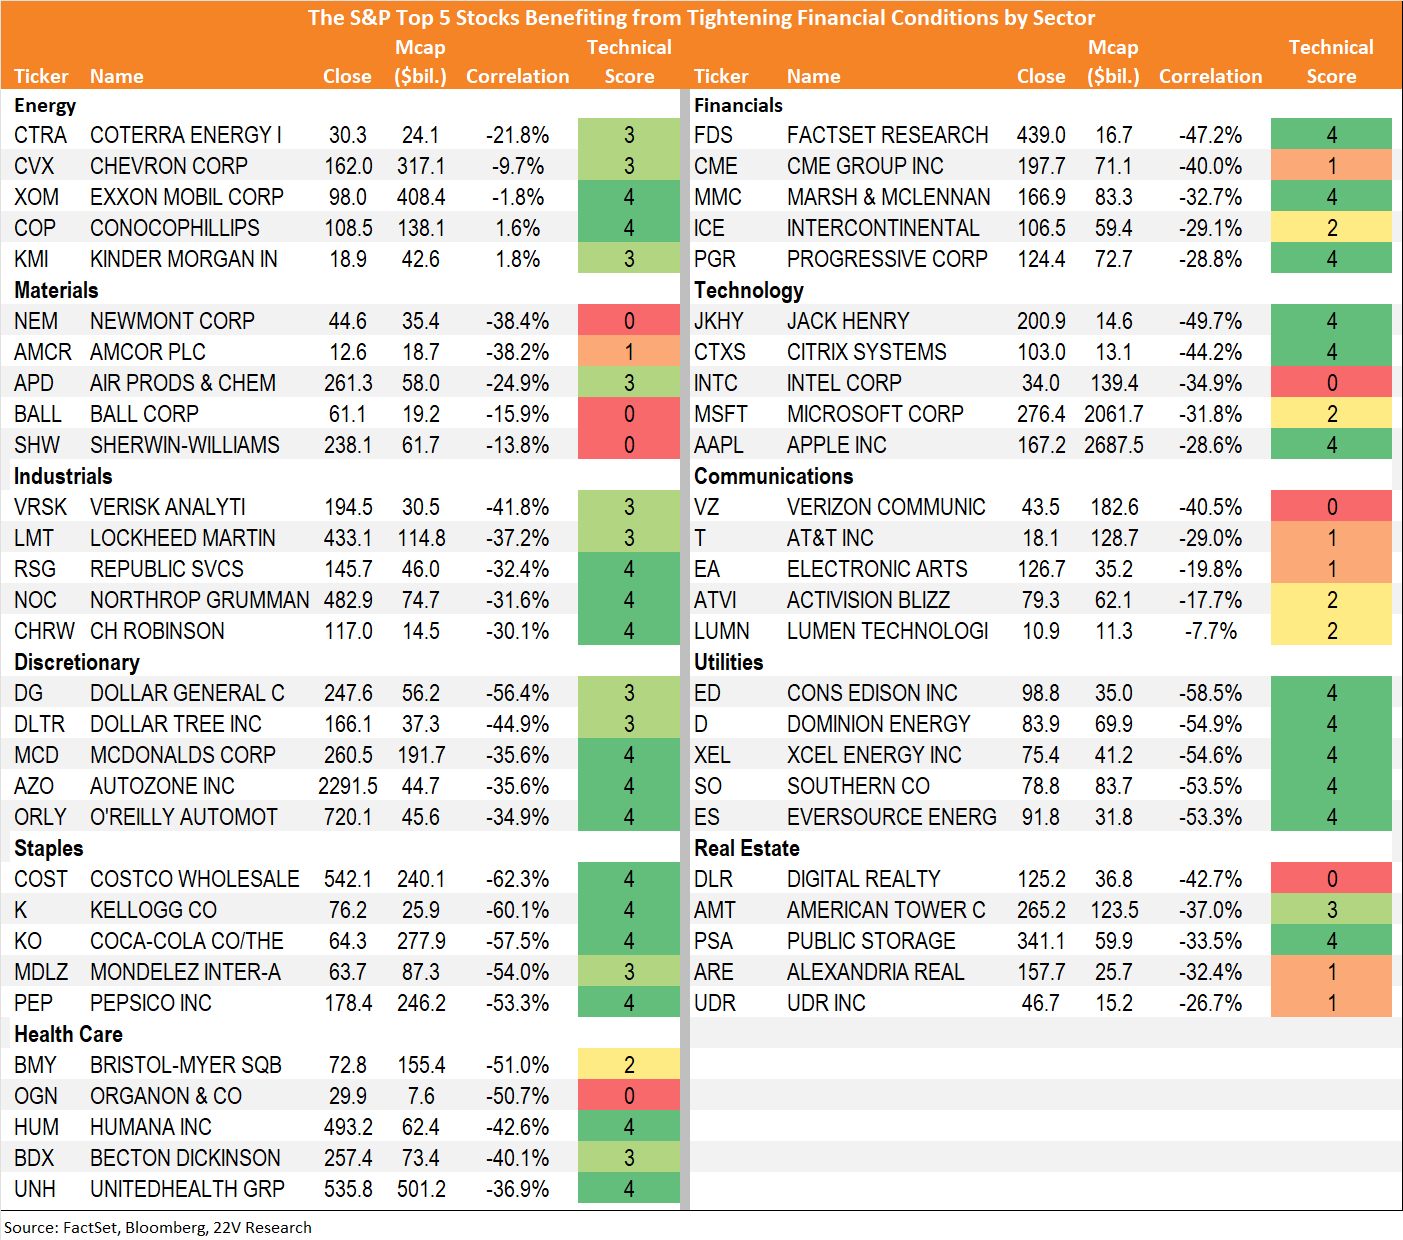
Here are the top 5 stocks by sector benefitting from tightening financial conditions with John Roque’s technical scoring…
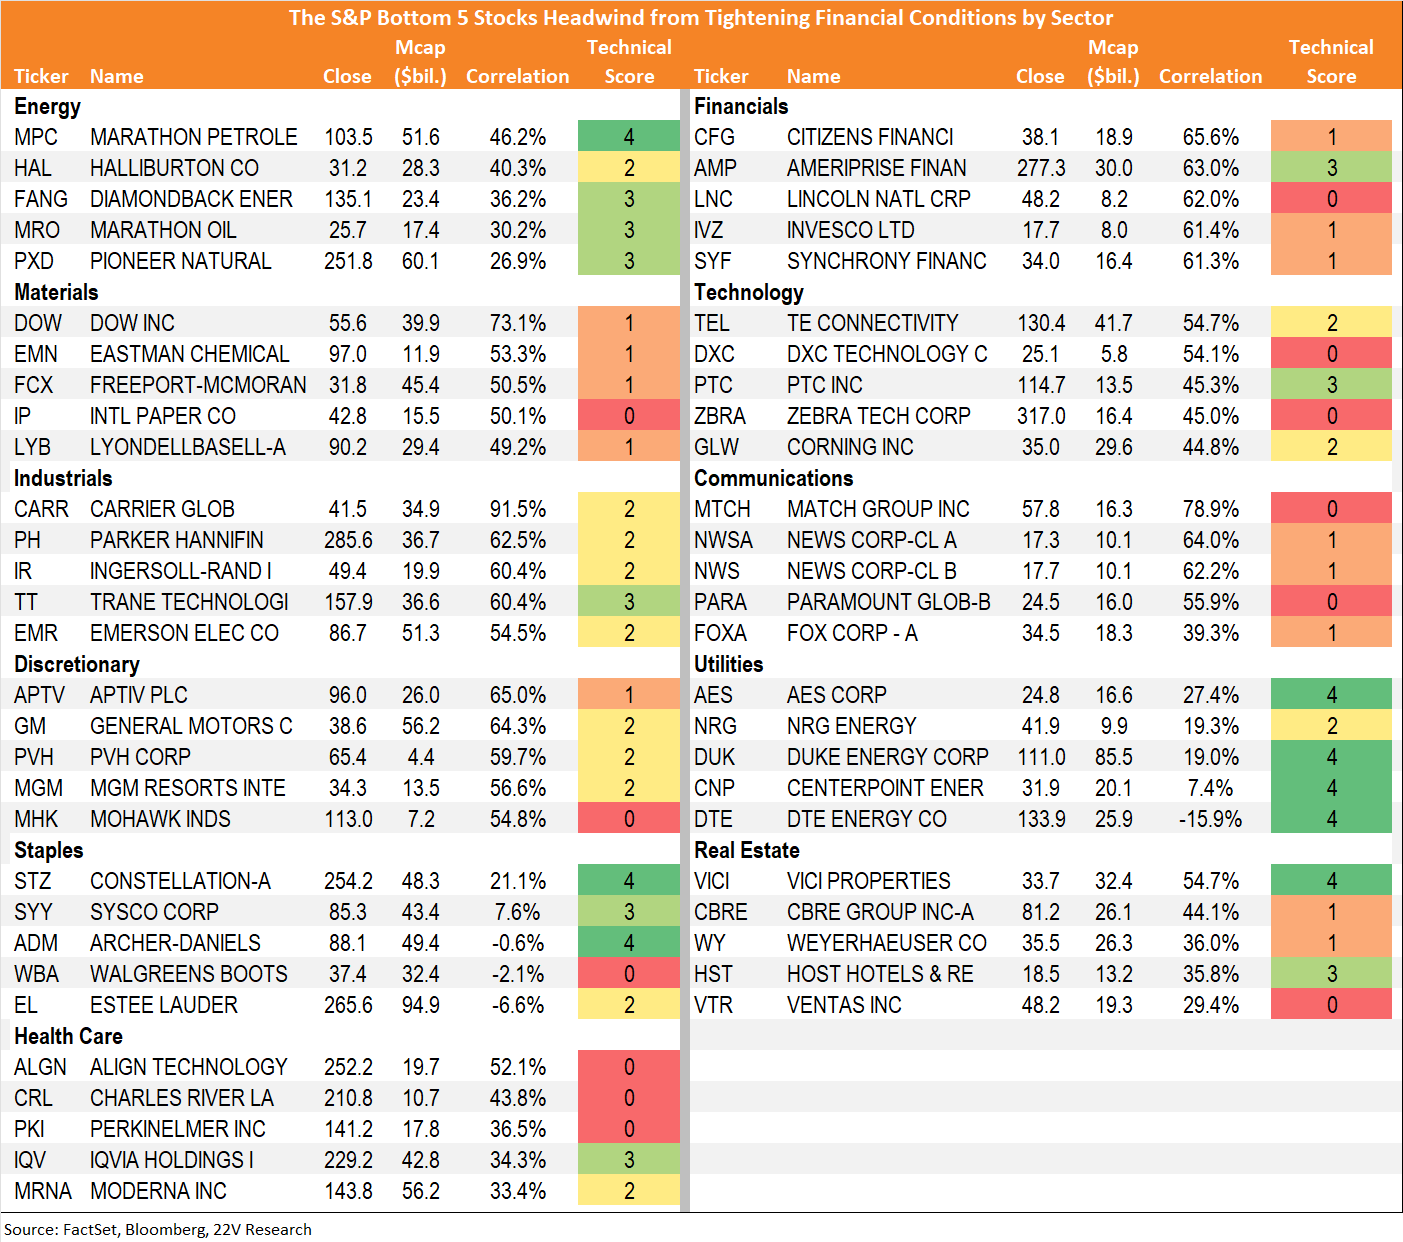
…and the top 5 stocks by sector at risk from tightening financial conditions with John Roque’s scoring.