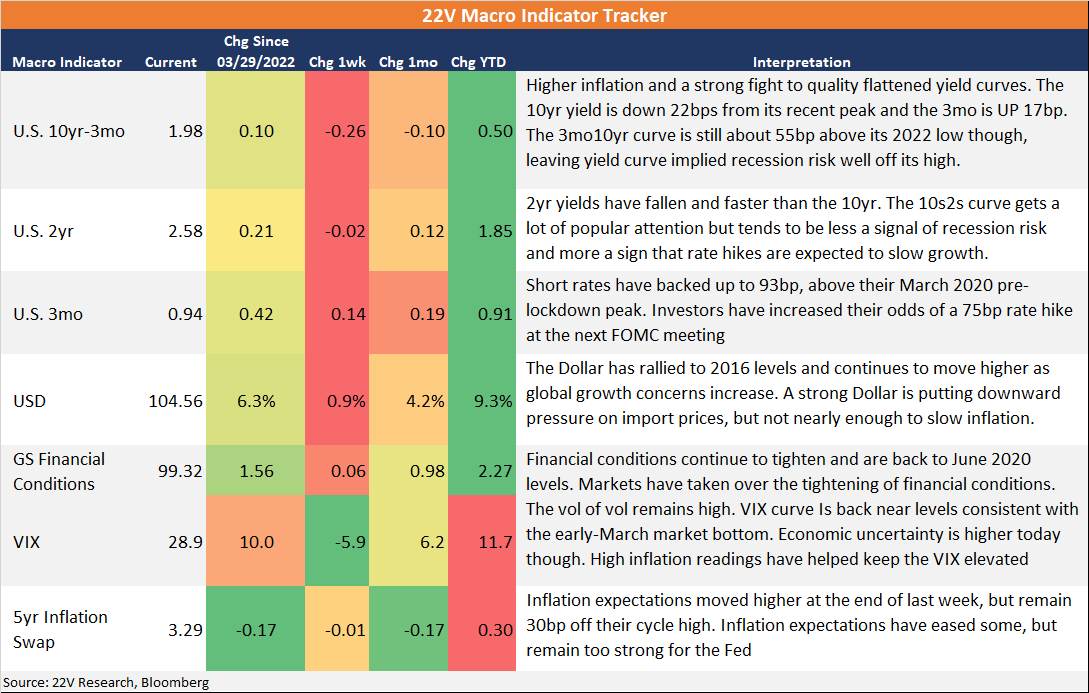
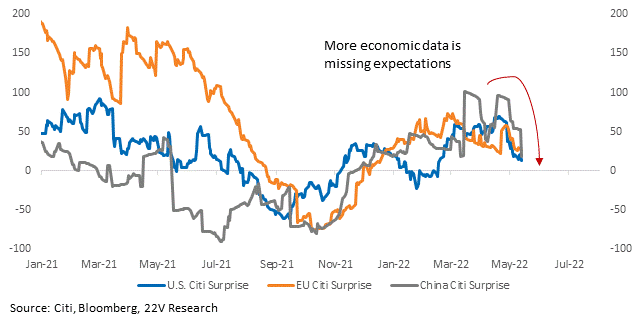
SUMMARY: More economic data in China missed and estimates of global growth are being cut. Data misses are not bad in the eyes of inflation-fighting central banks, but are a growing headwind for commodities, which have fallen sharply ex-oil.
Our base case isn’t a recession (see more on that HERE). But, as we wrote in a Quant report Friday, market internals since the recent market peak (3/29) have been more consistent with a recessionary outcome than a non-recessionary one. De-Risking and Value factors have surged while Growth and Re-Risking have faltered. The S&P as already dropped its typical pre-recession drawdown. Bottom line, the market has priced in a lot of negativity. Given most of the investors we talk to are willing to invest less than another -5% down in the S&P, the stage is set for another rebound in this violently flat market backdrop. Pressing shorts is more difficult here. That isn’t a long call though as the path higher for equities remains dependent on knowing how much growth needs to slow before inflation moves materially lower.
Whether or not financial conditions need to tighten more depends on the data released over the coming months. The difficulty is we don’t have a way of knowing what level of financial conditions will led to the Fed’s core inflation target. The Fed doesn’t know either. For now, everyone is focused on inflows,
What we can be confident in is that the 90s/00s Fed put isn’t in place anymore because (in the eyes of the Fed) inflation is worse for the economy than secondary wealth effects from falling stock prices. Based on rudimentary calculations from equity market returns and home price appreciation, households lost ~$5 trillion YTD but are still up $27T since 2019. If effect from equity losses isn’t enough to dissuade consumers, it won’t be enough to stop the Fed, something the Fed has been explicit about. And, losses from stock prices are concentrated in the top income percentiles, which are still up significantly in the past few years.

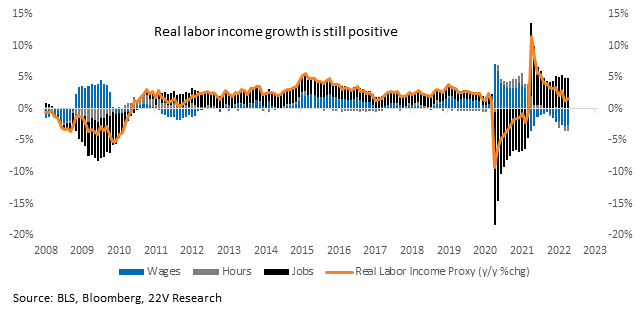
Still strong wealth gains, and more shorter-term, a still positive labor income proxy still point to healthy consumer spending and service growth. We may still get some hot data points over the next few weeks. That means markets and factors will remain volatile. The skew is better, but we are not outright long and still in a violently flat backdrop.
More below.
MARKET VIEWS: After China’s social financing and new loan growth data missed last week, China’s consumption, industrial production, and investment data all slowed more than expected, and are now near first COVID wave levels. Growth projections are down across the globe – Goldman cut its US growth forecast and warned of a recession, the EU cut its own growth forecast, and MS warned China’s economy will shrink this quarter. Last month, the World Bank and the IMF both cut their global economic growth forecasts. Data misses are not bad in the eyes of inflation-fighting central banks, but are a headwind for commodities, which continue to roll over ex-oil.
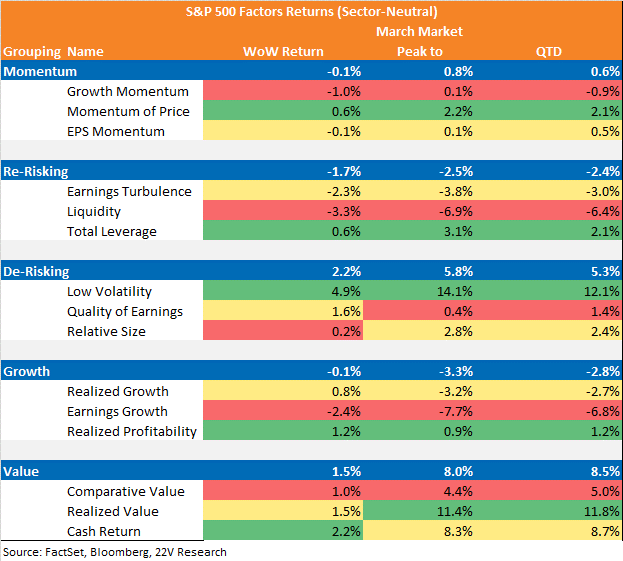
Our base case isn’t a recession (see more on that HERE). But, as we wrote in a Quant report Friday, market internals since the recent market peak (3/29) have been more consistent with a recessionary outcome than a non-recessionary one. De-Risking and Value factors have surged while Growth and Re-Risking have faltered. The S&P as already dropped its typical pre-recession drawdown.
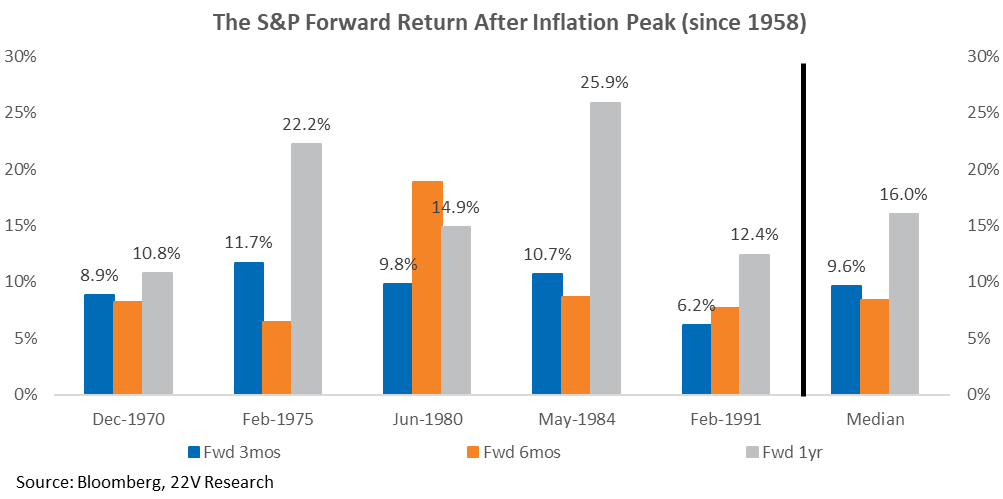
If inflation is reduced without causing a recession, S&P returns should be positive, particularly if the financial conditions tightening needed to slow growth is now behind us. Bottom line, the market has priced in a lot of negativity. Given most of the investors we talk to are willing to invest less than another -5% down in the S&P, the stage is set for another rebound in this violently flat market backdrop. Pressing shorts is more difficult here.
Whether or not financial conditions need to tighten more depends on the data that will be released over the coming months. The difficulty is we don’t have a way of knowing what level of financial conditions equates to target core inflation. The Fed put isn’t in place anymore because (in the eyes of the Fed) inflation is worse for the economy than secondary wealth effects from falling stock prices. The below is a rudimentary illustration of how home price increases and recent equity market drawdowns have likely affected the growth in household net worth. Households lost ~$5 trillion YTD but are still up $27T since 2019 (not meant to be false precision). The effect from equity losses isn’t enough to dissuade the Fed, something the Fed has been explicit about. And, losses from stock prices are concentrated in the top income percentiles, which are still up significantly in the past few years.
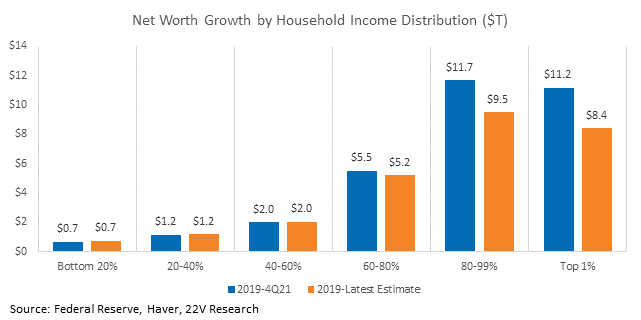
Still strong wealth gains, and more shorter-term, a still positive labor income proxy still point to healthy consumer spending and service growth. We may still get some hot data points over the next few weeks. That means markets and factors will remain volatile. The skew is better, but we are not outright long and still in a violently flat backdrop.
Macro Conditions Deteriorating Some: A flight to safety trade combined with high inflation readings have flattened yield curves and pushed Treasury market implied recession risk modestly higher. At the same time, financial markets have take over the tightening of financial conditions, moving the GS financial conditions index to a new cycle high. And that indicator UNDERSTATES the actual level of financial conditions. Implied volatility suggests 2% daily S&P moves for the next ~4mos. If that volatility proves a good entry point depends on the answer to the big question; has enough tightening taken place to slow growth and bring down inflation? Unfortunately, the answer requires more data and time.