
Our entire repository of COVID charts is HERE.
We hosted a webinar today with Victor Shih, an expert on China’s banking policies, fiscal policies, and politics. Replay HERE. Victor explained the challenges to supply chains that China’s “dynamic zero-COVID” policy poses. Chinese cities must bear the fiscal price of lockdowns, so the worst instances are when COVID hits a manufacturing center that is fiscally weak, like Xi’an. There wasn’t a blanket shutdown of production but there were widespread problems for 2-3 weeks. Right now, Omicron is spreading in Hunan province, another fiscally weak manufacturing hub. We are going to have a 3-4 week period in which a lot of production and exports will be affected. Guangdong, which is also experiencing a COVID wave, won’t be as affected because it is fiscally stronger. We would add that supply chain sentiment, calculated using the Amenity natural language processing tool, deteriorated again this week. Freight rates have ticked higher as well.

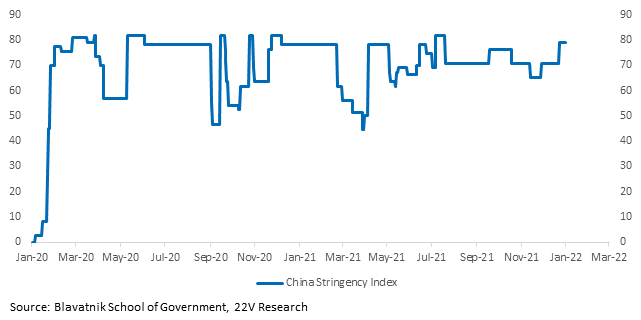
Per Victor, the Chinese government is still determined to stop the spread. But it is still spreading from city to city and province to province. And neighborhood, district, or city level lockdowns are imposed as soon as cases are detected. The lockdowns are economically meaningful. And reinfection risk is real. Rolling lockdowns will hit GDP in 1H22, maybe 2H22. Restrictions, a measured through Oxford’s stringency indices, are back to the highs.
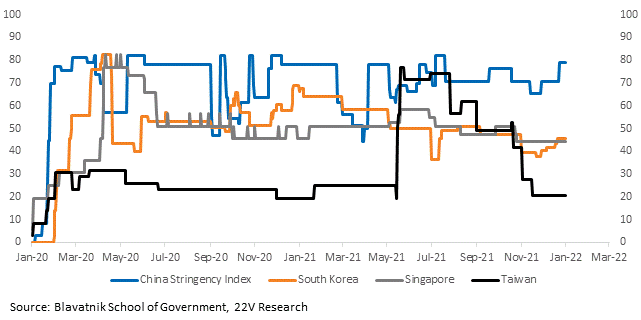
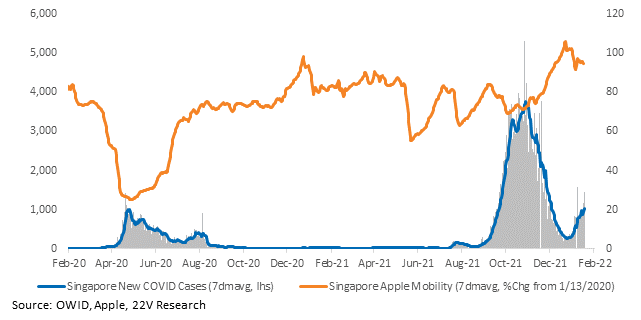
Other important supply chain countries are in the early stages of potential Omicron waves. Restrictions are, for now, minimal. Mobility has declined a little in each country. The primary risk Omicron poses is widespread disruptions to supply chains that delay goods deflation at an inopportune time.
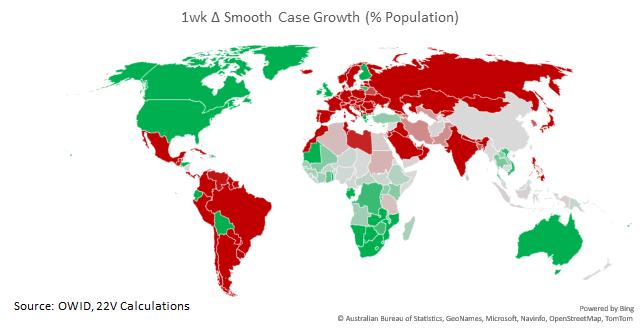
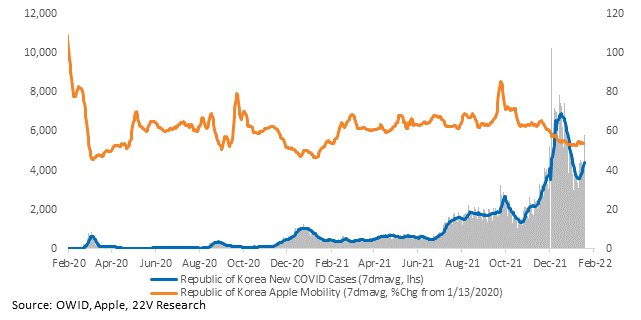
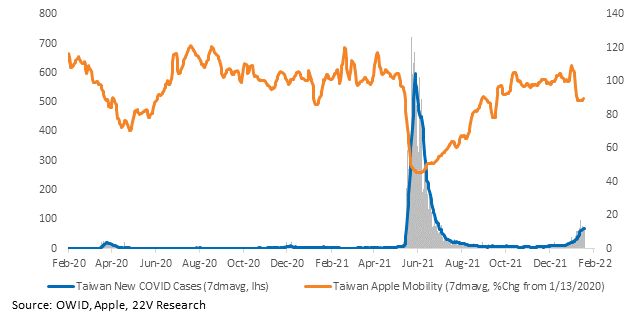
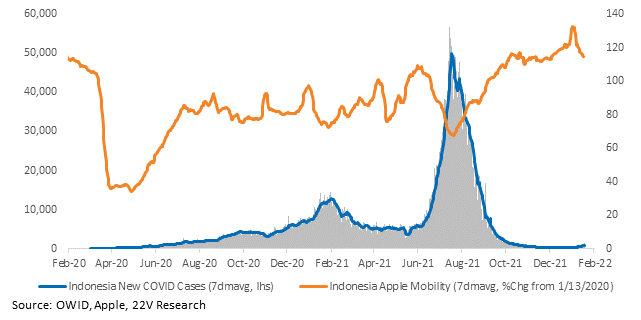
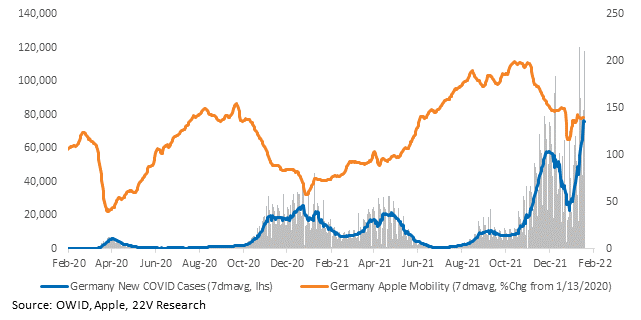
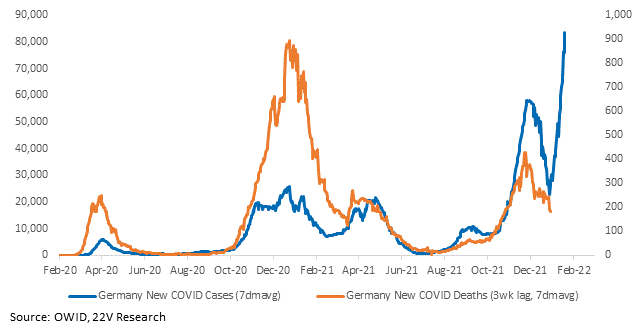
Elsewhere, Germany is recording record case growth. Mobility is falling. Deaths will soon reflect the Omicron wave. It’s unlikely Germany diverges from the low severity trends experienced in the US and UK.
FYI, we covered encouraging trends in NYC, the UK, and South Africa on Tuesday (see HERE) and ran through the COVID situation in the US yesterday (see HERE). Charts for every state and country we have data for are HERE.

