
Our entire repository of COVID charts is HERE.
We’re going to focus on the COVID outbreak in the US today, but first a quick reminder that trends from NYC, the UK, and South Africa are all encouraging (see more HERE). Hospitalizations are at a record, but ICU admissions are not. Only a couple states (Missouri and Delaware) have a record number of COVID patients in the ICU. Notably, case growth in states in the greater NYC area have peaked while ICU levels did not come close to their records.
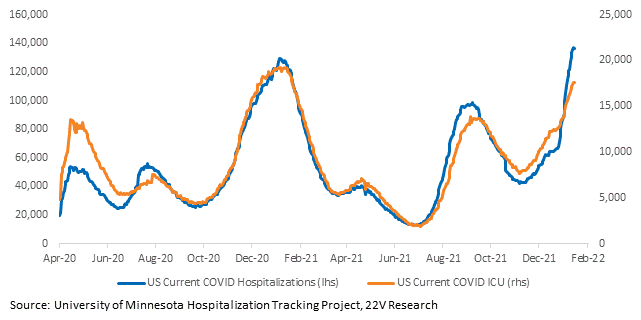
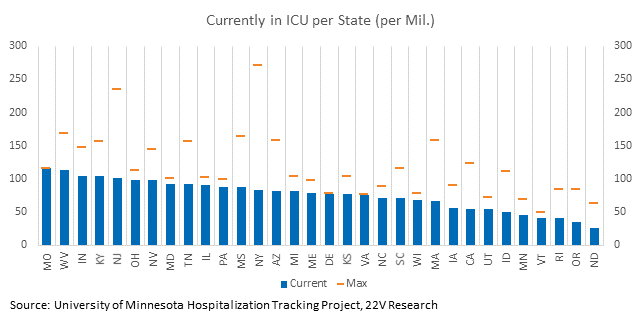
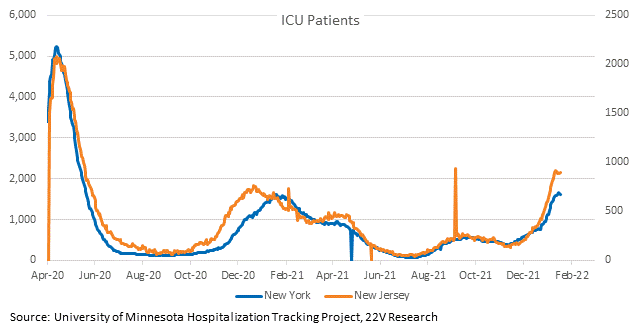
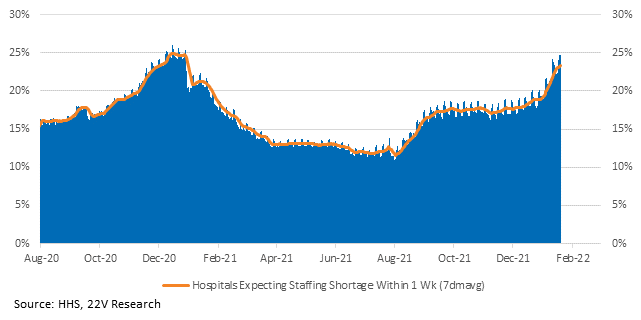
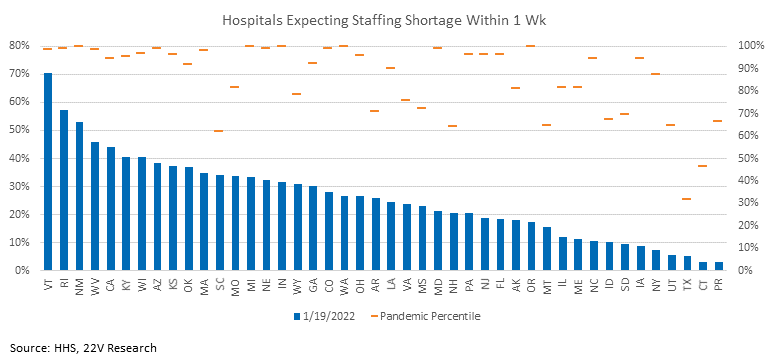
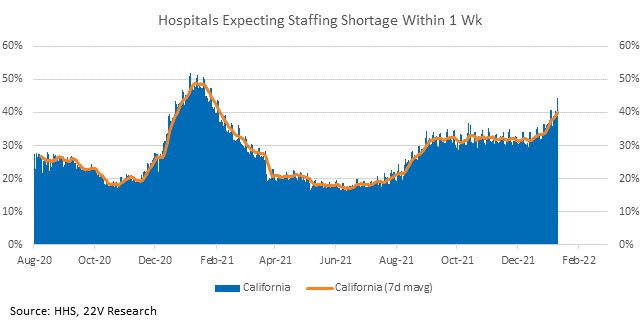
Less strain on the healthcare system helps the outlook for activity, but, as we have been saying, the specter of restrictions will remain as long as staffing shortages are making headlines. Not only is the country-aggregate of hospitals reporting imminent, critical staffing shortages near its pandemic high, but almost every state’s responses are above their 60th percentile (timeframe only in the pandemic). In other words, hospital staffing shortages are ubiquitous.
Case growth rates are easing in the earliest hit states, like NY and Florida (charts 2 and 3). Hospitalizations have rolled over in NY (chart 3).

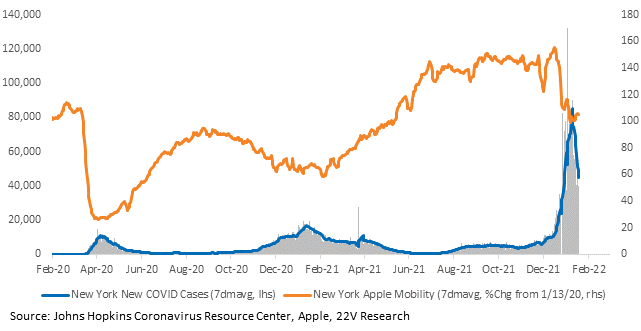
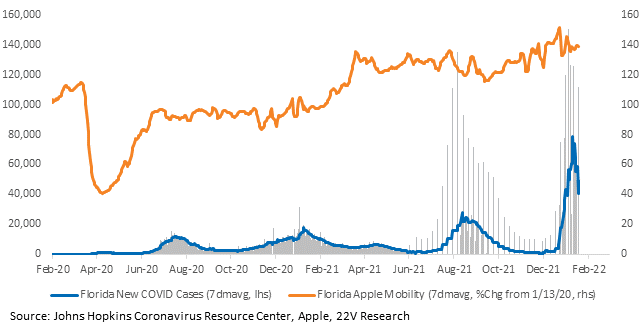
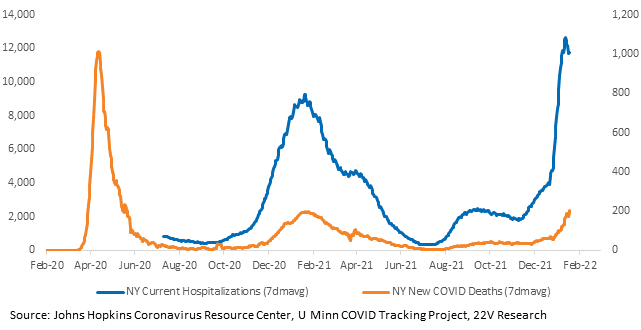
Declines in the early Omicron states are helping the country-wide counts.
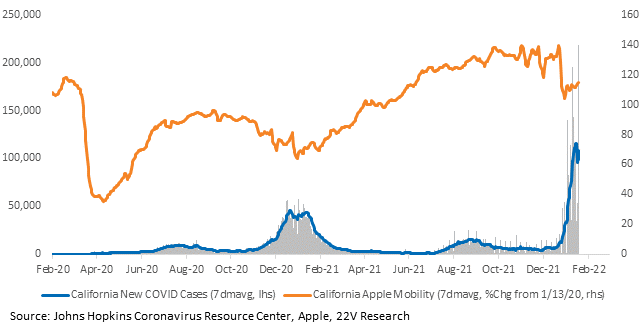
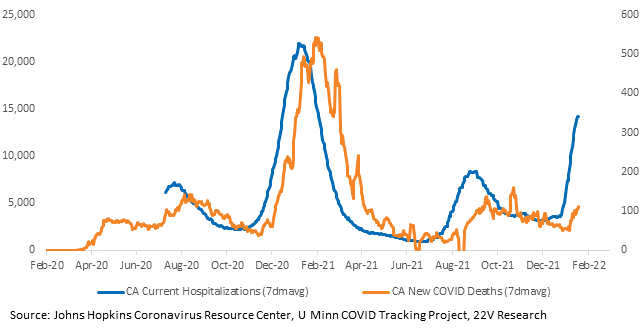
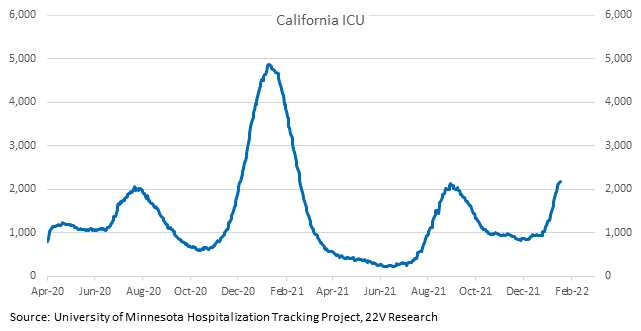
California’s recent reported case growth has been volatile – its most recent reading is a new high but the 7dmavg is lower. The holiday likely influenced reporting. It may be early to call for a peak, but we will be monitoring it. Its hospital system is under intense pressure; relief in case growth would be a significant development.
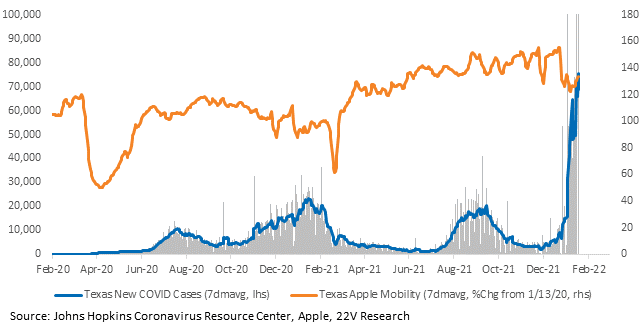
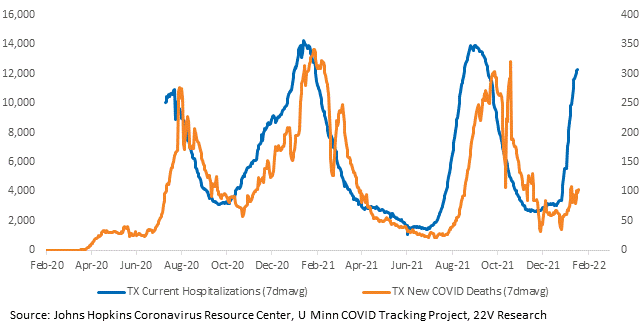
Case growth in Texas is accelerating.
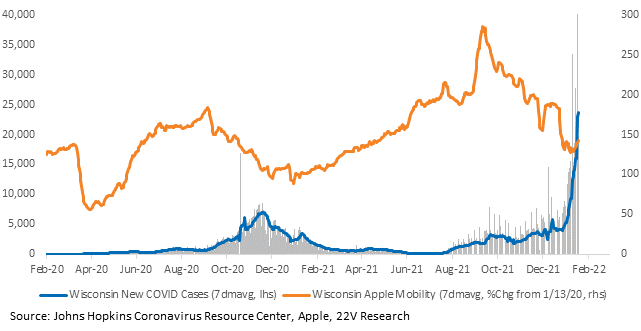
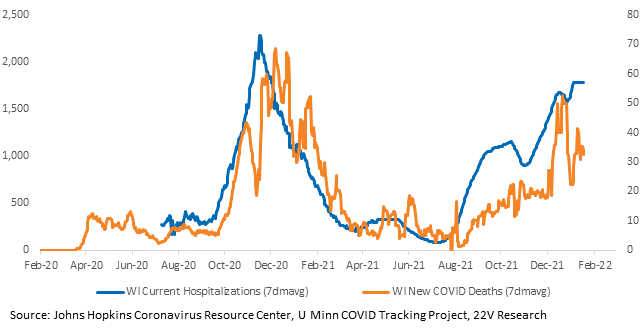
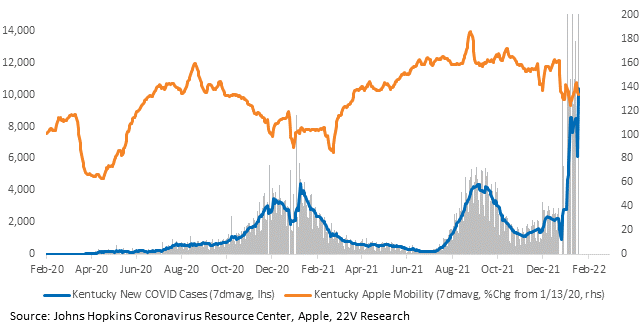
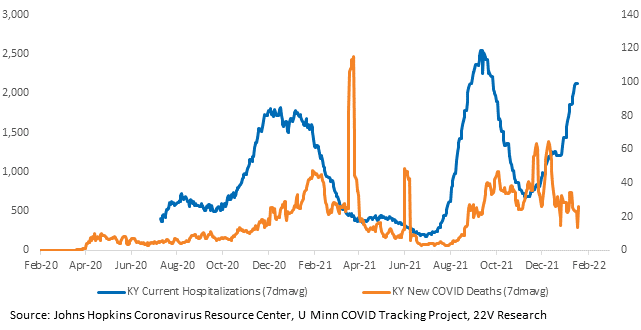
And Wisconsin and Kentucky have some of the worst case growth rates.
Charts for every state and country we have data for are HERE.

