SUMMARY: Over the course of 2H21, markets have had to absorb a constant barrage of shocks: Evergrande in China, the Fed discussing tapering, another COVID wave, rapidly rising inflation, political disfunction, and widening supply chain disruptions. Despite stagflation fears, the growth outlook has remained firm, supporting the steady though modest outperformance of Cyclicals relative to Defensives. Factor level market internals have been weak though with investors maintaining a largely risk-off stance, favoring Growth factors over Value. Since the end of 2Q, Value has underperformed Growth by -10%.

As we noted last week, the underperformance of Value relative to Growth has reached extreme levels, particularly relative to the backup in yields. The U.S. appears to have reached an agreement on a reconciliation bill, and as Kim Wallace pointed out, that clears the way for “$2.0 – $2.5 trillion range, including the $500 billion of new spending for infrastructure.” In addition, as Gerard MacDonell noted regarding the GDP report “…if we net consumer and business purchases of motor vehicles out of private final domestic demand growth, we find a “core” growth rate there of 3.8%…”
That backdrop, along with still strong earnings reports, help explain the rebound in Value yesterday (outperforming by ~1%). Today, we review the location of Value and Growth WITHIN sectors and across capitalizations. Bottom line is that while there are sectors with a greater or lesser number of Value and Growth names, there are few sectors, on a cap-weighted basis, that should be considered Value or Growth. The Cyclical versus Defensive paradigm is more useful for sector allocation. Value and Growth rankings are better for stock-by-stock analysis.
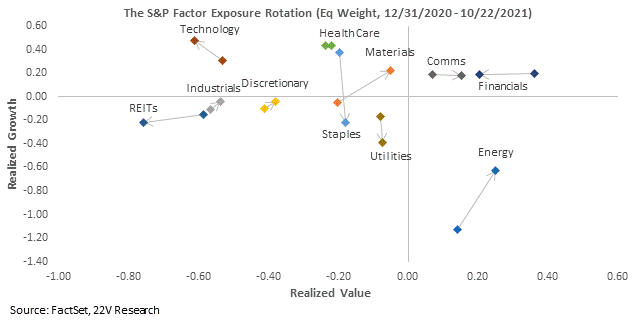
CYCLICAL ≠ VALUE: At the sector level, equally weighted factor exposure indicates the breadth of names that have high/low rankings to style factors. Below we chart out the current exposure of S&P sector to Realized Value (horizontal axis) and Realized Growth (vertical axis). One Cyclical, Energy (bottom right), has the highest Value and lowest Growth exposure, while another Cyclical, Tech (top left) has the highest Growth and lowest Value exposure. As our factors are not mutually exclusive (a stock can be Value AND Growth) Financials and Comm Services names have positive exposure to both Value and Growth.
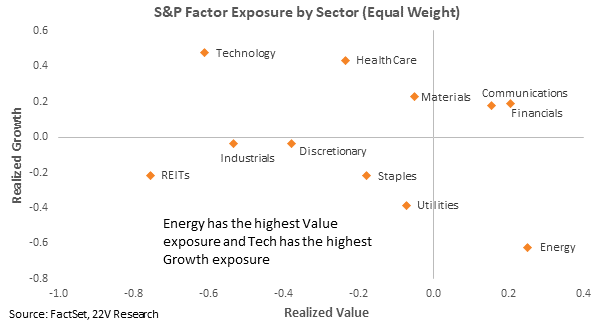
As we noted a in a Market in Numbers report a few weeks ago, there are frequently large divergences between market cap-based and equally-weighted factor exposures within sectors. Currently, on a cap weighted basis, few sectors have Value exposure that is meaningfully different than the overall market. That is not the case on an equally weighted (breadth) basis though.
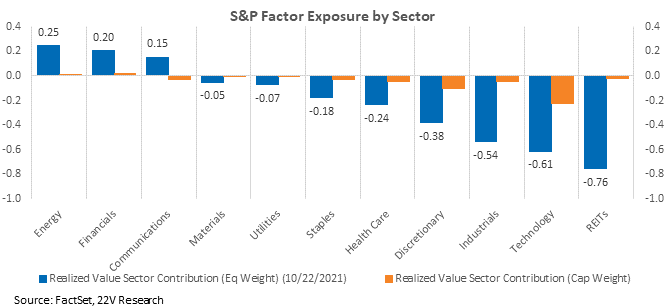
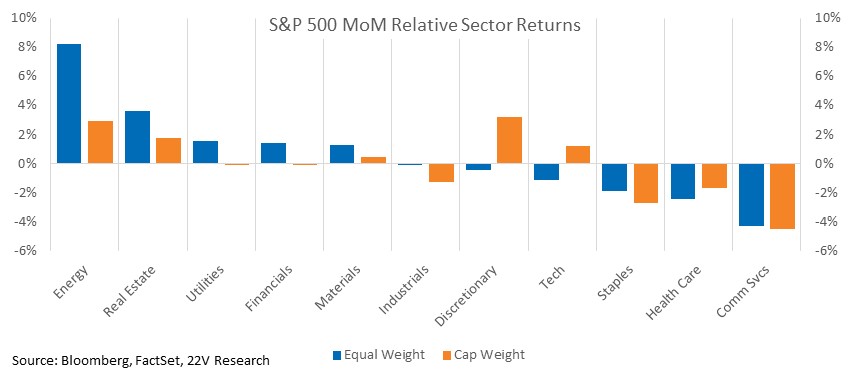
It is important to keep in mind that factor exposure of a sector does not necessarily mean the performance of that sector will be correlated with the performance of the factor. Most ETFs and major index sector baskets are cap weighted while sector exposure is typically measured on a breadth (count rather than cap) basis. Energy has been the best performing sector over the past month on an equally weighted basis and second-best cap weighted. That is despite having a high breadth of Value exposure. Value has underperformed Growth by -4.1% MoM.
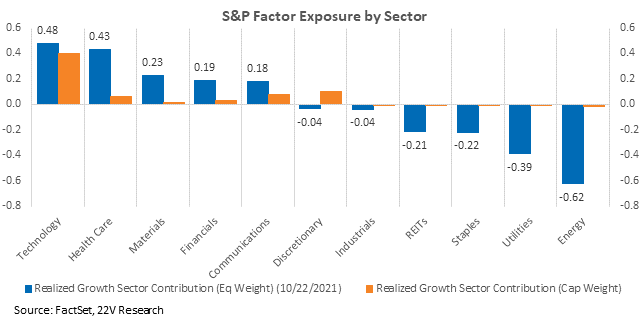
Going through the same breadth versus cap exercise for Growth leads to a similar result as with Value, with one noticeable exception. Tech returns (measured using XLK for instance) should be more highly correlated to Growth factor returns given the sector’s high market cap and breath exposure to Realized Growth. Yesterday, as Growth lost ground, Tech market performed (falling after the close on AAPL and AMZN’s EPS misses/warnings), trailing other Cyclicals. This is another example of Cyclicals outperforming regardless of Value/Growth returns. Factors remain a better sort on stocks while Cyclical/Defensive is a better sort for sectors.
FACTOR EXPOSURES ARE VOLATILE: One more important point is that factor exposures of sectors (cap and equally weighted) are far from static. Since the start of the year, Energy has become more exposed to Value over the course of the year (helped by a more than 50% increase in revenue), while Tech has become even growthier. Staples started the year as a source of Growth names and Materials have become growthier over the course of 2021. Our point is less about how specific sectors have moved but more meant to point out that sectors can have unusual and volatile exposures over time.
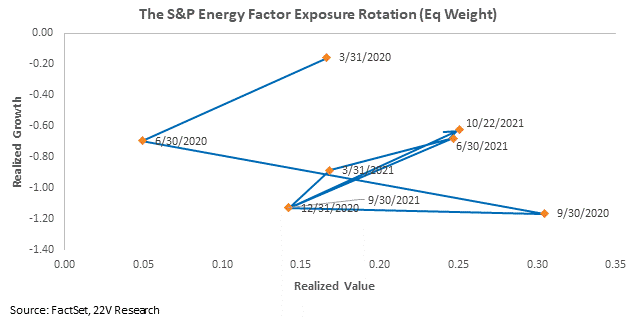
Energy is a good example of the changing nature of style factor exposures. Though the sector has had a less than index Growth exposure and more than index Value exposure for most of the past two years, the degree of that exposure has changed significantly quarter to quarter as economic growth and oil prices have fluctuated.
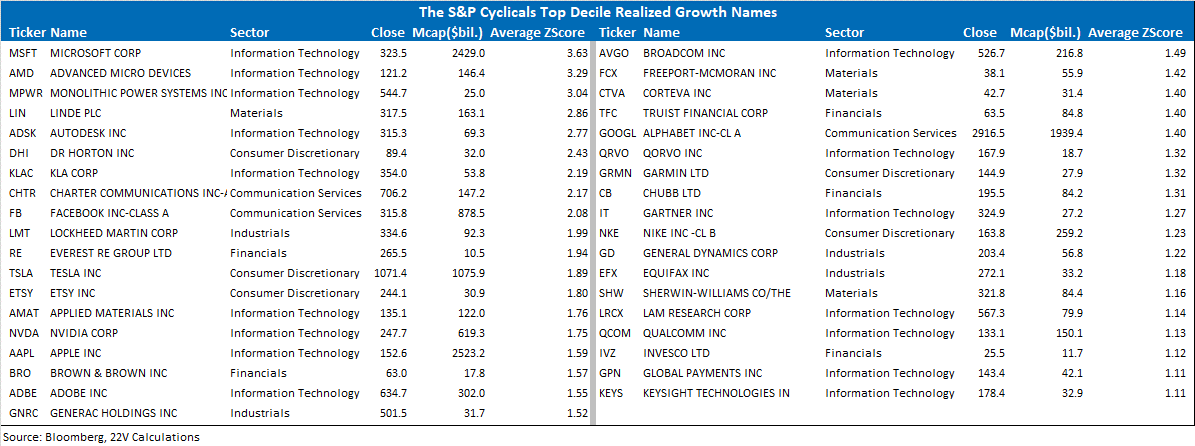
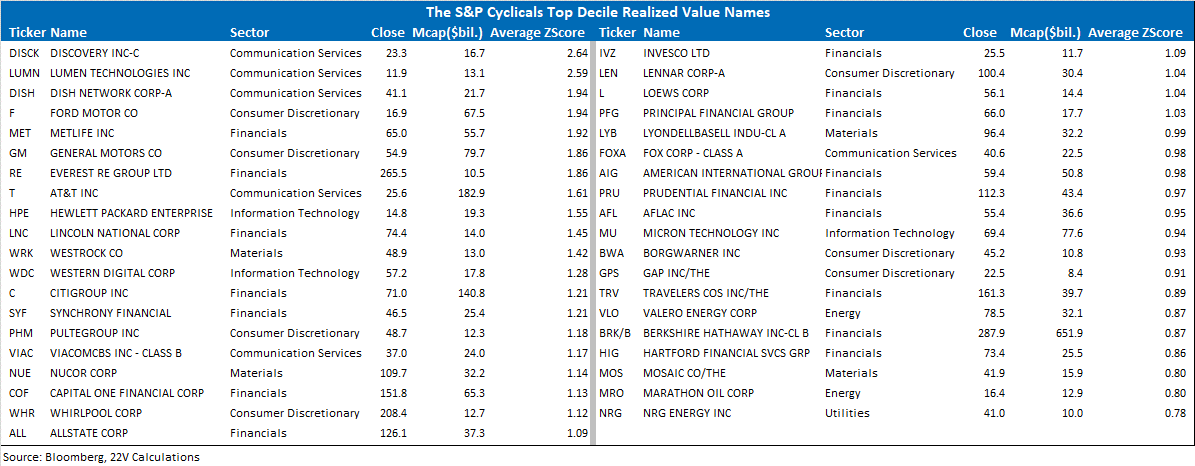
To identify Value and Growth within Cyclical sectors today, we list the stock with the highest Value exposure and those with the highest Growth exposure within Cyclicals below. Email us at [email protected] for a complete list of S&P factor rankings.
Top Decile Value Basket:
Top Decile Growth Basket: