
Our entire repository of COVID charts is HERE.
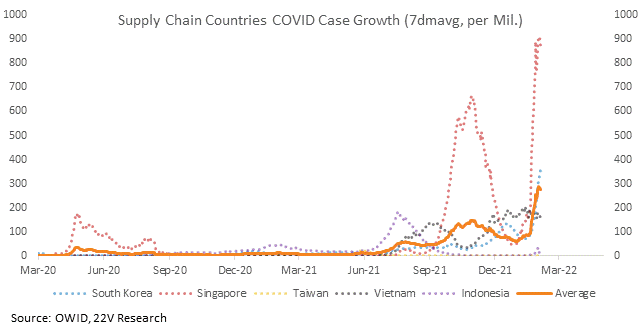
This morning, we specified we are still in sell-the-rally mode but argued finding a top will be easier after earnings season, when the important support earnings have provided fades. We referenced supply chains as a risk the markets will be left to contend with after earnings season concludes. Supply chain sentiment improved again this week. We are monitoring this because supply chain constraints will affect goods deflation, delaying it if supply chain bottlenecks reform during an Omicron wave in important supply chain countries. We’ll also be watching company supply chain sentiment, particularly among retailers, but not enough retailers have reported to draw meaningful conclusions yet.

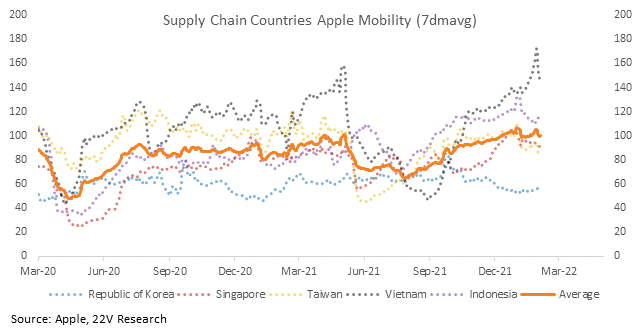
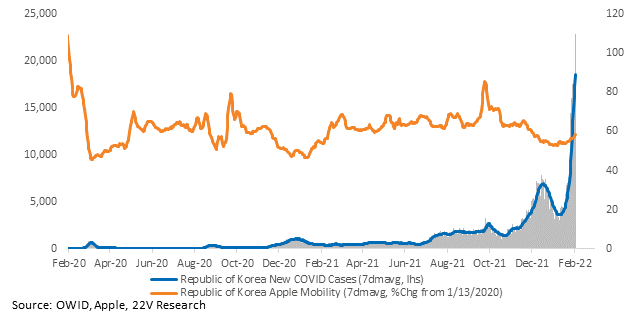
The improvement in supply chain sentiment will be more meaningful if it sustains as the Omicron wave, which looks to be beginning in earnest in supply chain countries, takes hold. Case growth is higher across a series of supply chain countries and is particularly poor in South Korea. Mobility has held up so far.
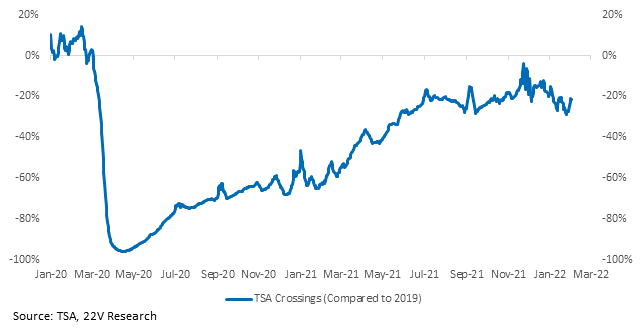
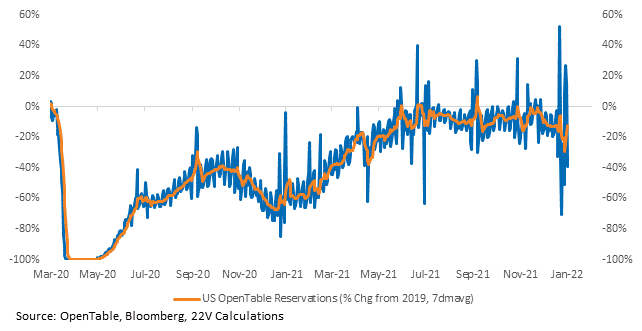
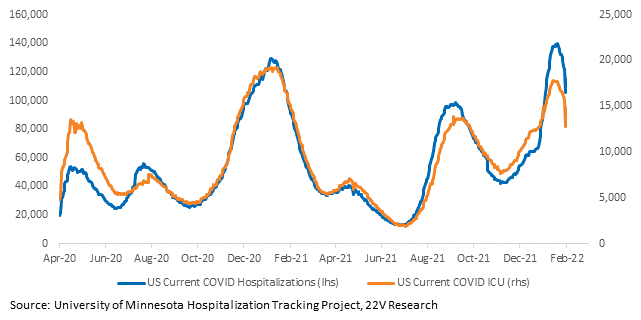
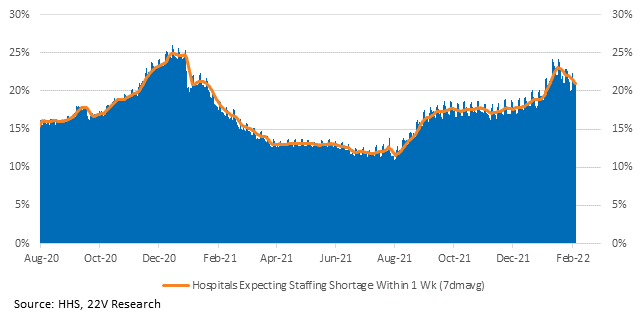
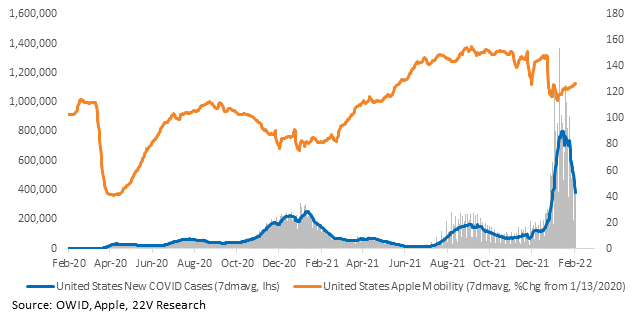
The recovery is progressing in the U.S. TSA and Opentable data have both increased this week, though still down from 2019 levels. Case growth, hospitalizations, and patients in the ICU are all decreasing significantly while mobility is recovering. And staff shortages in hospitals are alleviating.
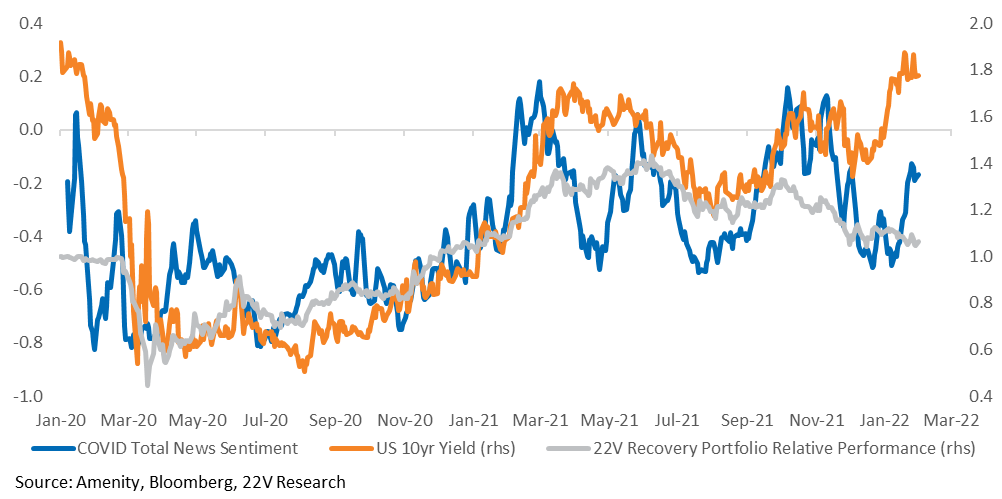
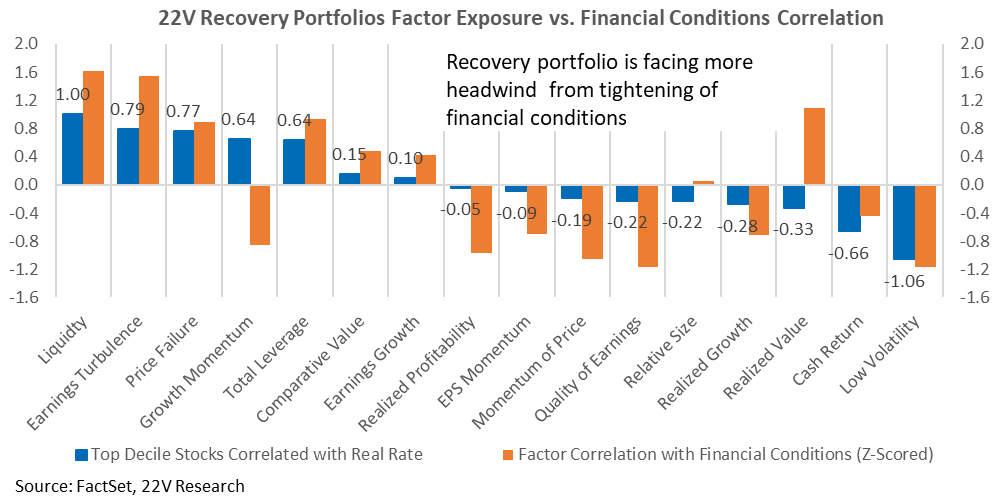
Our Recovery Portfolio continues to struggle despite the improvements in COVID trends and activity, higher 10yr yields, and better COVID sentiment. Its factor profile is the culprit; the Portfolio is exposed to the factors that face headwinds from rising real rates and tightening financial conditions, two major themes we expect will persist.
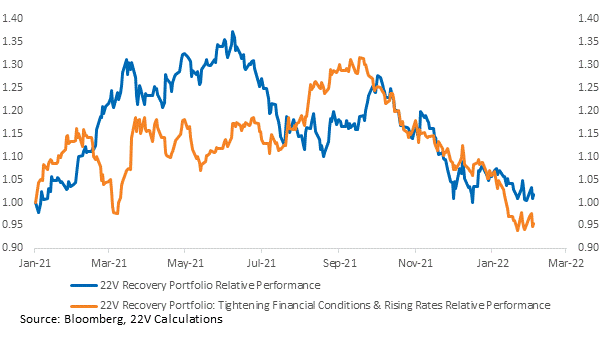
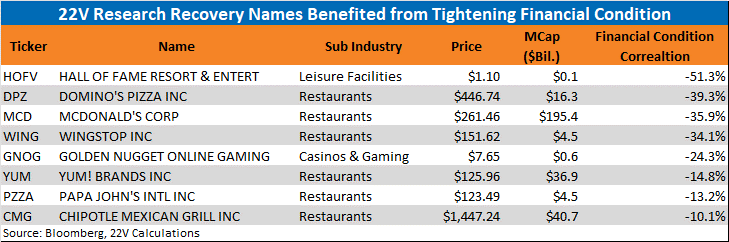
We created a subset of the Recovery Portfolio by filtering for stocks with factor profiles that benefit from tightening financial conditions. This subset has also underperformed, but should face less headwinds than its parent portfolio. Constituents listed below.
Charts for every state and country we have data for are HERE.

