
Our entire repository of COVID charts is HERE.
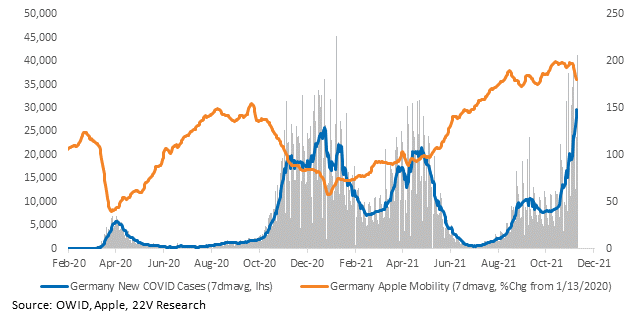
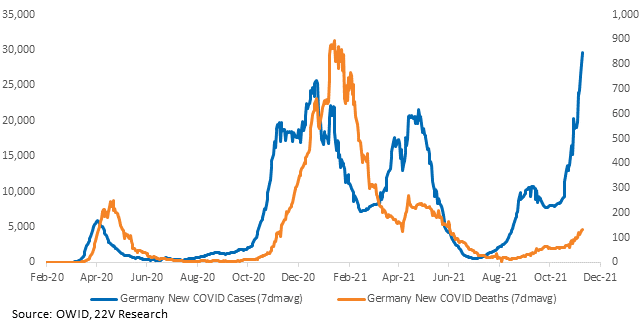
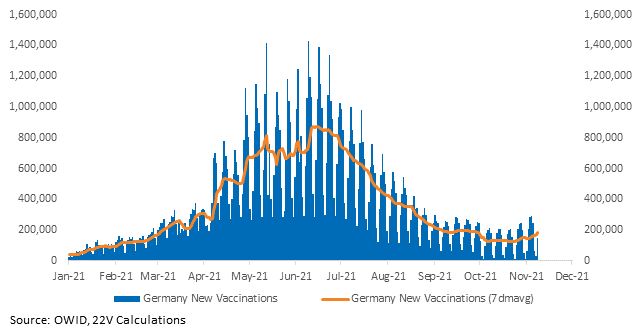
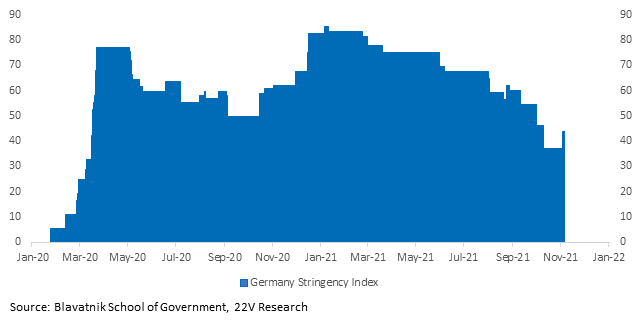
Smoothed case growth in Germany hit another record high. But the economic effect is unlikely to be severe. Mobility is still high and OpenTable restaurant traffic, though falling, is above 2019 levels. Deaths are low and the number of patients in intensive-case beds is now less than half of what it was during the peak in January. Germany’s health minister reported that the new wave is “mainly among the unvaccinated.” The government is prepping new rules to handle the outbreak, but the rules are about testing and vaccinations, not lockdowns. Rules can be about vaccinations rather than lockdowns since vaccines are working (the outbreak is not in the vaccinated). Vaccinations have increased a bit and the government is preparing to roll out booster shots. Germany’s stringency index increased recently but is near a post-pandemic low.
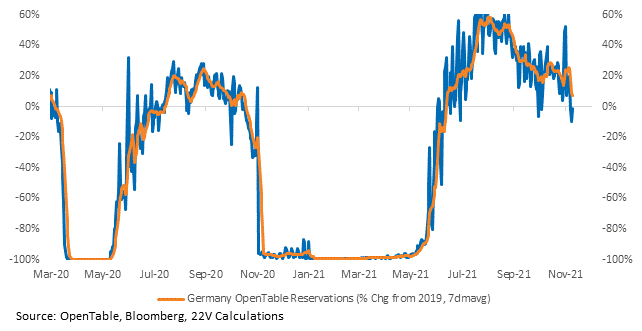
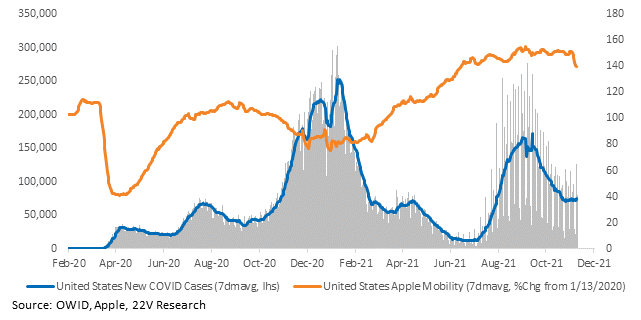
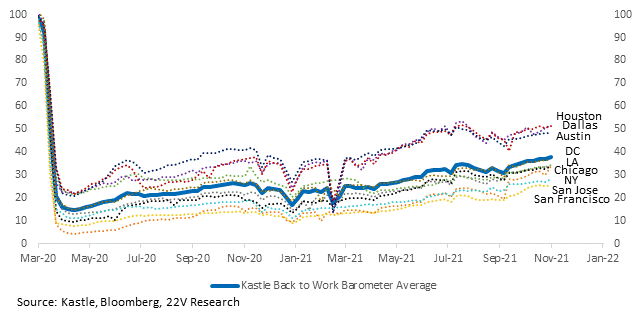
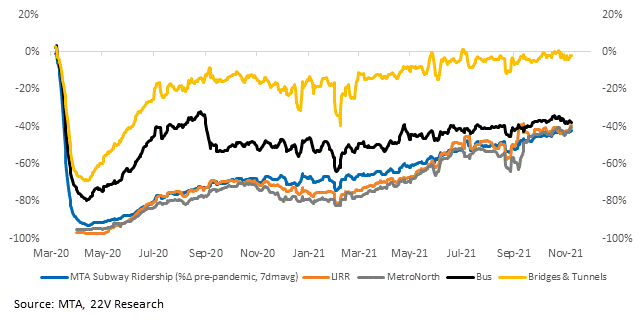
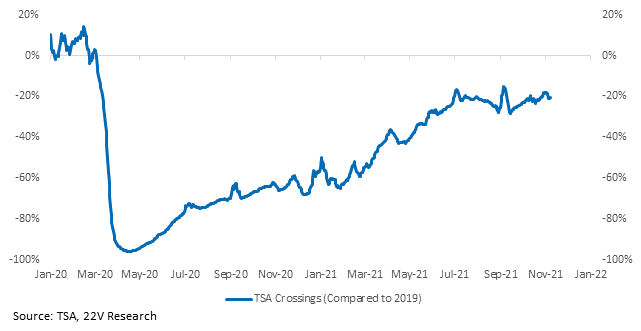
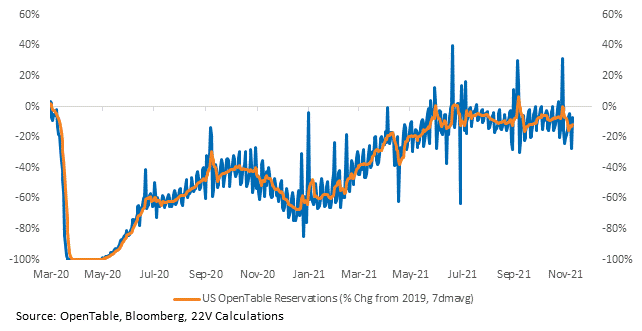
Case growth in the U.S. is stagnant. Mobility is still high while the country makes slow progress towards normalization. Kastle’s back-to-work barometer, which tracks office check-ins, is slowly increasing. NYC is at 34% of pre-pandemic levels. NYC’s MTA ridership is gradually increasing across the board as well. Subway and rail traffic is now down -40% compared to pre-COVID. OpenTable reservations have declined recently. TSA crossings are at around -20% compared to 2019. There’s still room to go before normalcy. Underlying demand is strong but there are implications for where money is being spent.
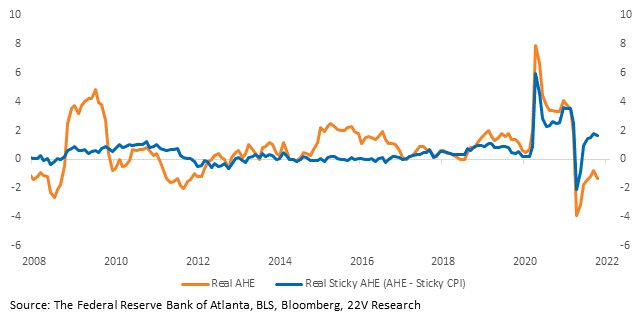
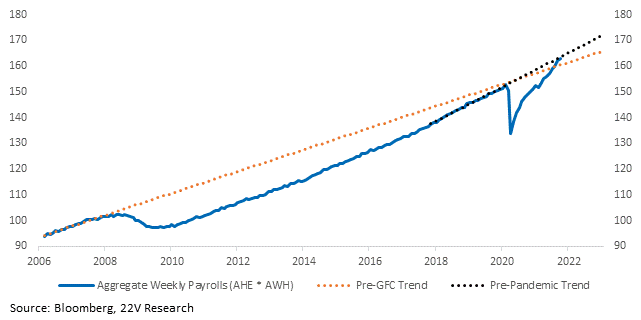
Demand is still strong. Today’s CPI data did not change that theme. Adjusting nominal wage growth to the Atlanta Fed’s STICKY inflation measure shows lower but strong real wage growth, not negative real wage growth. Sticky inflation is 72% of CPI, so we feel comfortable making this adjustment. Also, and as we wrote this morning, aggregate labor income has recovered to its pre-COVID trend. It took 13 years for aggregate labor income to recover to its pre-GFC trend.
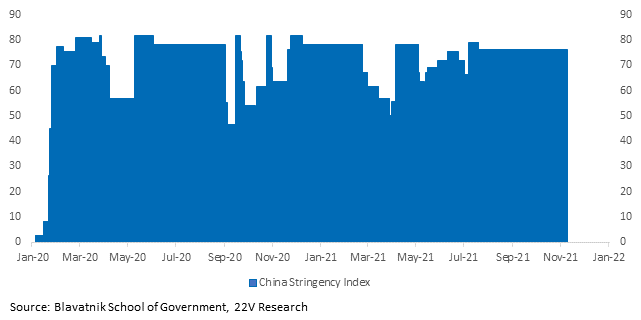
China’s COVID data is opaque so we are following Oxford’s stringency indices to gauge China’s response. So far, no meaningful increase at the national level despite headlines about increasing case growth.
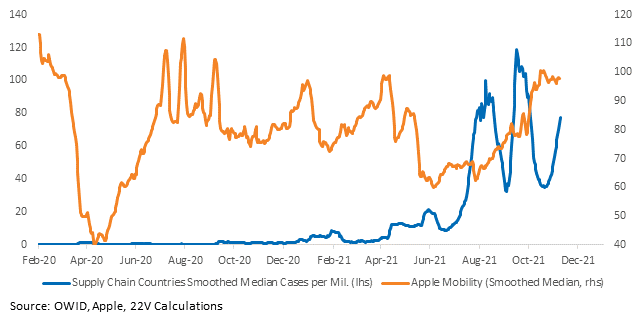
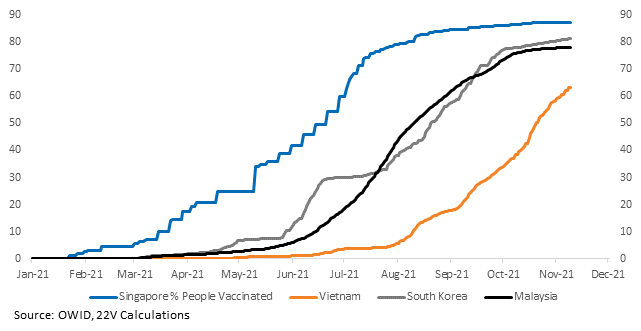
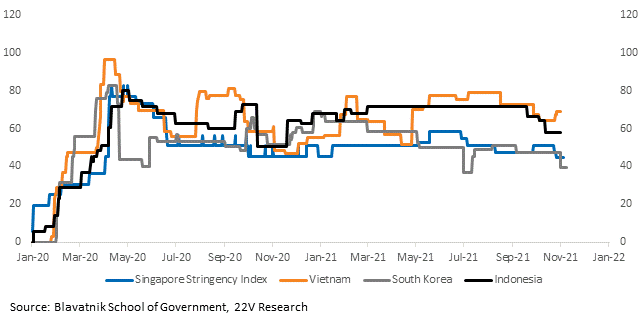
COVID trends in other supply chains are mixed. Case growth is higher, but mobility is still much higher than over the summer, there are less government-imposed restrictions, and vaccination rates are dramatically better.
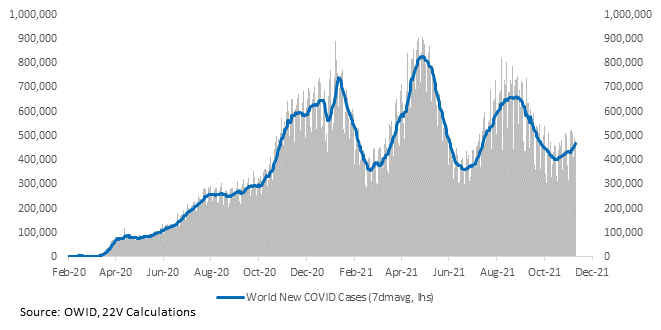
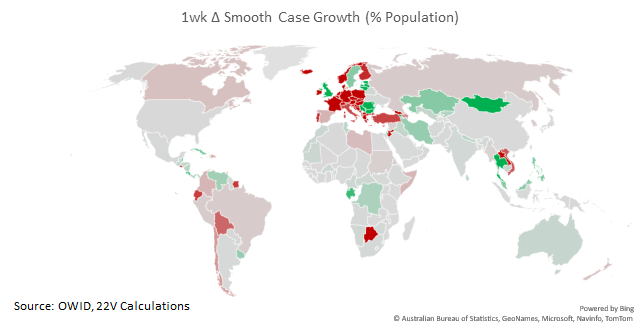
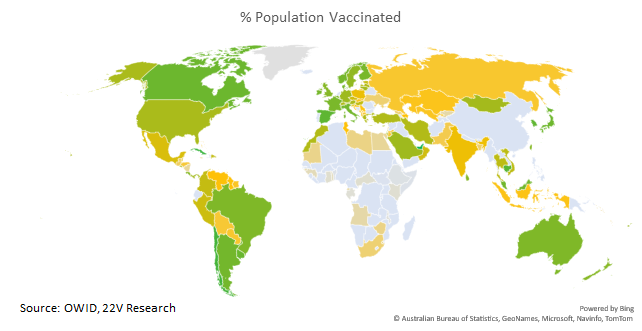
Globally, case growth is concentrated in Europe and Russia. Developed Europe has high vaccination rates, which (again) will help limit transmission and maintain activity.
Charts for every state and country we have data for are HERE.

