Weekly – Per the new format, we mark to market our main themes each week. Themes are bolded and market to market follows.
A benign where economic growth moved from 3% to ~2% would be consistent with 10yr yields in the 4.2-4.5% range. That backdrop is a support for duration sensitive equities (Tech, Discretionary, Banks, Consumer) and fundamental Factors. Marking to Market –10yr yields declined last week 4.37%, credit spreads remain tight, and real GDP forecasts for 2027 are ~2%. Risk-on factors and Cyclical industry groups levered to lower inflation (Retailers, Transports) outperformed, and small caps outperformed. I.e. a benign slowing in economic growth and inflation is being priced. We remain long non-AI related Cyclicals, like Retail stocks, Regional Banks, Airlines, and Homebuilders. The last ~4 weeks of outperformance should continue.
Theme – Lower Speed Limit Economy. GDP growth NEEDS to be at or below 2%, assuming productivity trends hold at roughly 2%, to keep core inflation in check. This theme is HIGH CONVICTION now. Marking to Market – We have high conviction on the destination (lower inflation to respect an economic speed limit of 2%), but lower conviction on how we get there. Our bias is weaker growth in the back half of 2026 reduces inflation the “easier way”. Call that a 6 out of 10 conviction.
Core PCE inflation data came in at 0.32% MoM and 3.4% YoY last week. That is well above the Fed’s forecast but did not change the outlook for financial conditions as the Fed, economists, and investors assume monthly inflation readings will slow in 2H26 WITHOUT the Fed raising rates. The Fed’s forecast for core PCE in 2026 is (3.3%) and 2027 (2.5%). That means core PCE (CPCE) needs to print roughly 0.21% per month from June forward.
New Theme – Theoretical Inflation Debates Are MUCH less Useful Now. Follow the Data – Peter Williams highlighted that most economists, the Fed included, assume the supply shocks will rapidly fade, the labor market is at equilibrium, and underlying/expected inflation is well anchored. Under this framing, inflation shouldn’t be an issue beyond the next few months. This framing is why financial conditions remain easy. The joint assumptions noted above keep being falsified though. In fairness, the supply shocks are real and SHOULD be temporary. But now the supply shocks are fading and Warsh made price stability the centerpiece of the FOMC press conference. Repeatedly.
Bottom line – if core PCE trends well above the 0.21% MoM range for the next 2 to 3 months. Core PCE would track above the FOMC forecast for core PCE of 3.3% for 2026, which would be inconsistent with the Chair Warsh’s price stability focus and Fed hikes should be priced. Arguments over how inflation SHOULD behave are secondary.
Theme – The Fed maintaining the current level of fed funds and financial conditions remaining stable for the rest of 2026 is fine for markets and supports fundamental factor gains (Growth, Momentum, Value, GARP) and Cyclicals relative to Defensives. The economic expansion continues, and EPS expectations should not change much in this scenario. Marking To Market – As we noted last week, the Fed will need to signal tightening before investors can monetize hawkish policy (owning Defensives and shorting risk-on factors). Risk-on factors worked last week. Total Leverage and Value had the most positive active returns last week. The Price Momentum factor struggled, but that seems more idio driven (more below).
New Theme – More Asymmetric Downside Risk for Markets: Marking To Market – If core PCE tracks closer to 0.25-0.30% going forward, there is meaningful risk of financial conditions tightening. 2yr yield breaking meaningfully above 4.2% (heading toward 4.3-4.5%) would likely be associated with hawkish economic data that forces the Fed to hike rates. 2yr yields declined last week and are back to pre Fed Chair Warsh press conference levels. This risk declined.
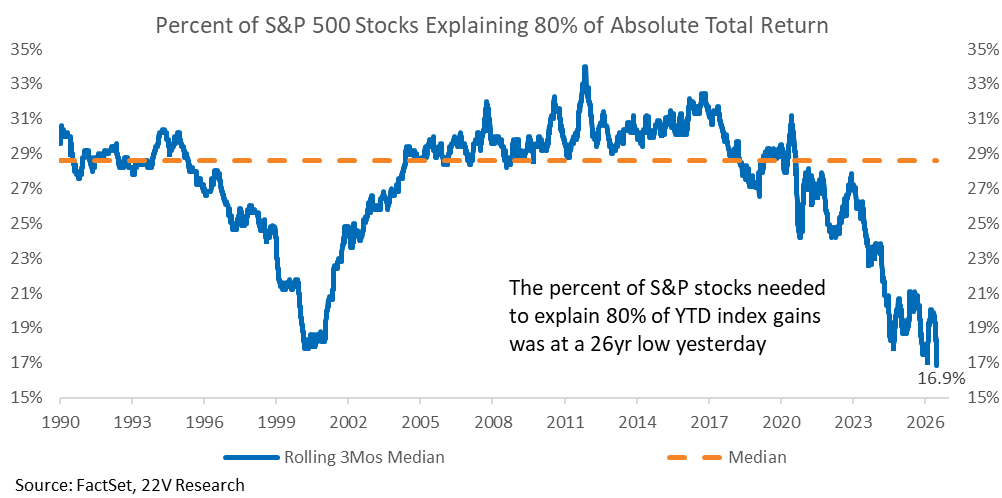
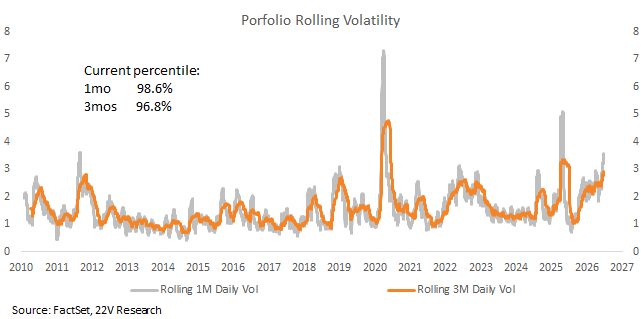
Theme – Idio, particularly AI driven Idio, is the Major Driver of Returns: Marking to Market – The S&P 500 names that have contributed the most to S&P appreciation this year (list below) have 1mo realized vol in their 99th %tile going back to 2010 and 97th %tile on a 3mo basis back to 2010. The price momentum factor vol is above its 95th %tile and single name stock vol is at the highest level ever relative to S&P index vol.
The extreme level of volatility in YTD winners makes it difficult to manage risk. The above is why Jeff Jacobson, head of 22V Derivatives Strategy has suggested hedging long Price Momentum exposure with IWM as the small cap ETF returns are being driven by AI winners. Alternatively, Jess suggests buying a put spread for MTUM (Momentum ETF), which has exposure to Momentum and covers most names in the list of stocks that have contributed most to YTD returns. Please reach out to be put in touch with Jeff.
Our Bottom Line On Price Momentum Remains & The AI Demand Trade In General – The focus for us is value creation. The current level of margin sentiment suggest an INCREASE in margins in 2Q26 (AI value creation). Unless margin sentiment or actual margins decline, it will be difficult to be short Price Momentum and AI demand beneficiaries longer-term. That was our bottom line two weeks ago and we reiterate the long-term call today. Let’s see what companies say in a few weeks. Earnings Momentum factor looks interesting to us now (details below).
Charts related to the comments above are below…
Indicators – Our current 10-year yield decomposition shows risk sentiment is the predominant factor explaining the 10-year yield return. Changes in inflation sentiment are likely to be the dominant influence on moves in the 10-year yield. 10yr yields declined and duration sensitive equities rallied. That is what you would expect to happen when the 10yr is being driven risk sentiment is driving 10yr yields.
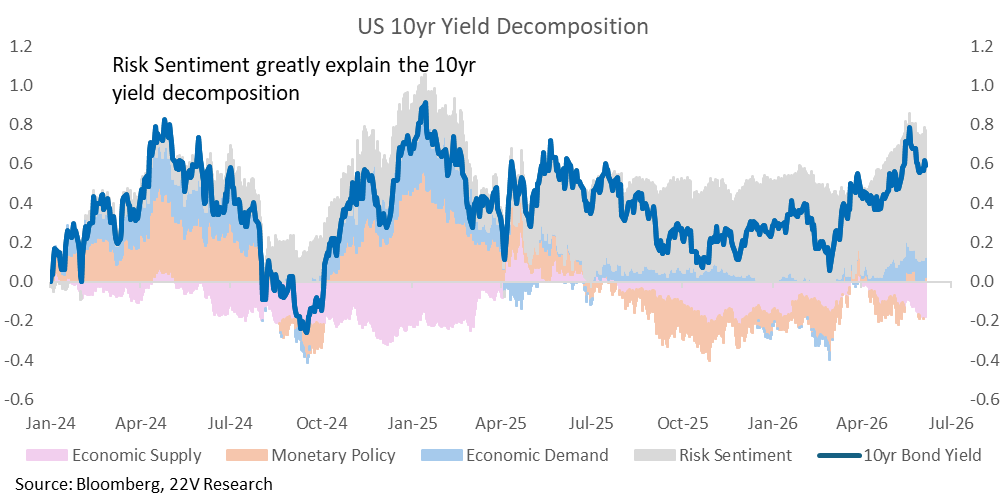
The risk reward in overall markets is less exciting now that a Fed tightening campaign is a live risk. We are focused on internals, and the Earnings Momentum factor looks interesting to us now.
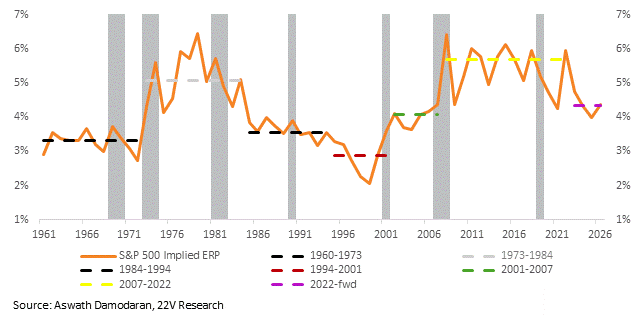
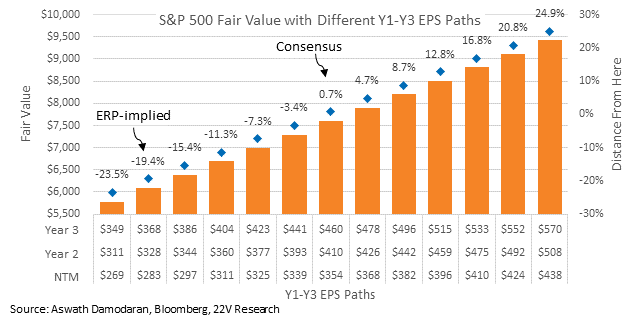
The implied equity risk premium has two-sided risk. i.e. a small increase in the equity risk premium, from the current 4.6% level to 5%, would indicate -9% to fair value. A 5% ERP should be expected IF the Fed moves to a tightening campaign.
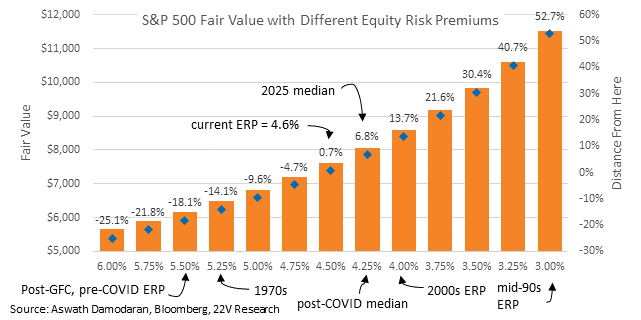
Earnings estimates have increased, significantly, this year, helped by an extremely strong 1Q (HERE). Applying the cash return ratio from 1Q to 2Q adds +140 points to fair value.
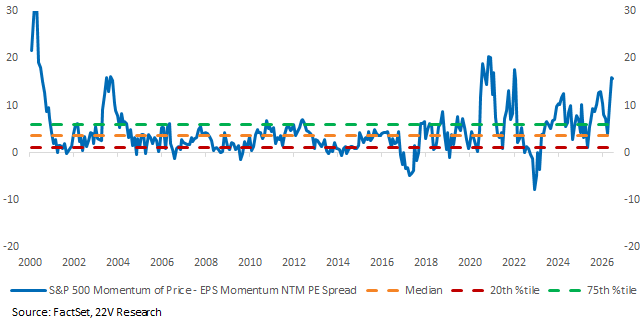
Price Mo accelerated sharply while EPS Mo advanced at a much milder pace, leaving a larger spread between the two. The NTM P/E premium of the top-decile Price Momentum basket relative to EPS Momentum has reached its 97th %tile, suggesting a stretched relative valuation backdrop. We continue to expect Momentum factors to gain, with EPS Momentum posting a better risk-reward profile.
PRICE MOMENTUM & CONCENTRATION: If the 2yr yield breaks meaningfully above the 4.2% level (heading toward 4.3-4.5%) it would likely be associated with hawkish economic data that forces the Fed to hike rates. The drawdown could be severe given the unusually high level of volatility in the concentrated group of YTD S&P 500 winners and the Price momentum factor.
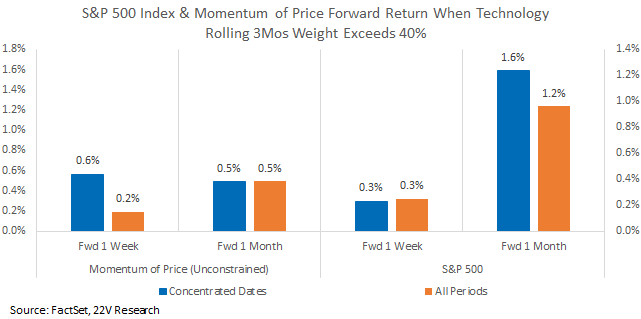
History suggests that such concentration does not necessarily signal an imminent reversal. When Price Momentum is being driven by a narrow set of names, forward 1 week and 1 month returns have been better or roughly in lined with all periods for both the Price Mo factor and the S&P Index.
Price momentum factor vol is above its 95th %tile and single name stock vol is at the highest level ever relative to S&P index vol.
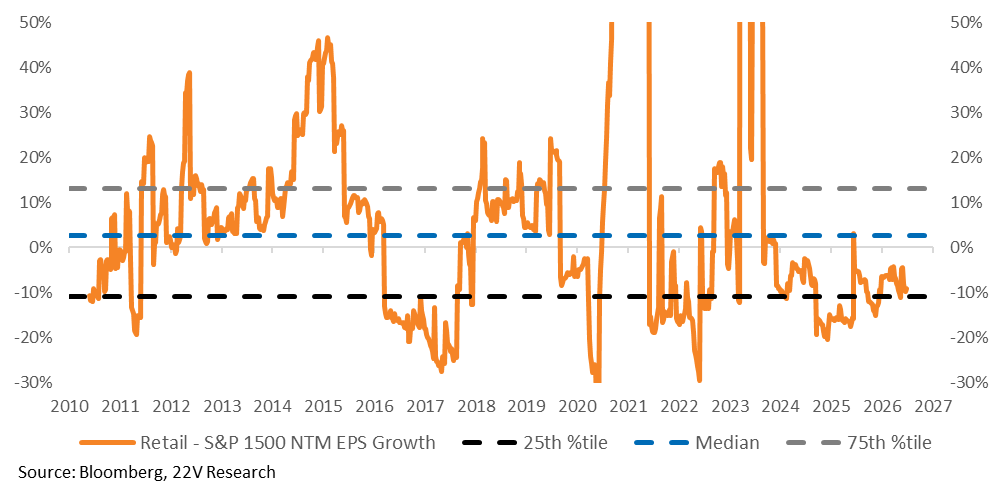
CONSUMER: The Retail names remain relatively cheap and have been increasing NTM EPS growth relative to the S&P 1500.
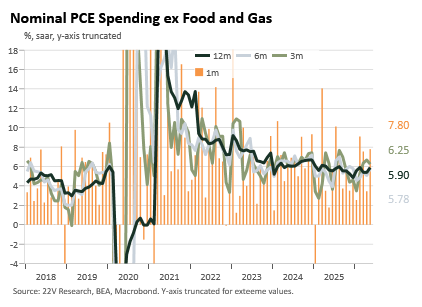
Consumption data last week showed REAL personal spending growth around 2%. Nominal spending growth is close to 5% though and the Income data suggests Nominal Income growth is running in the 4-4.5% range.
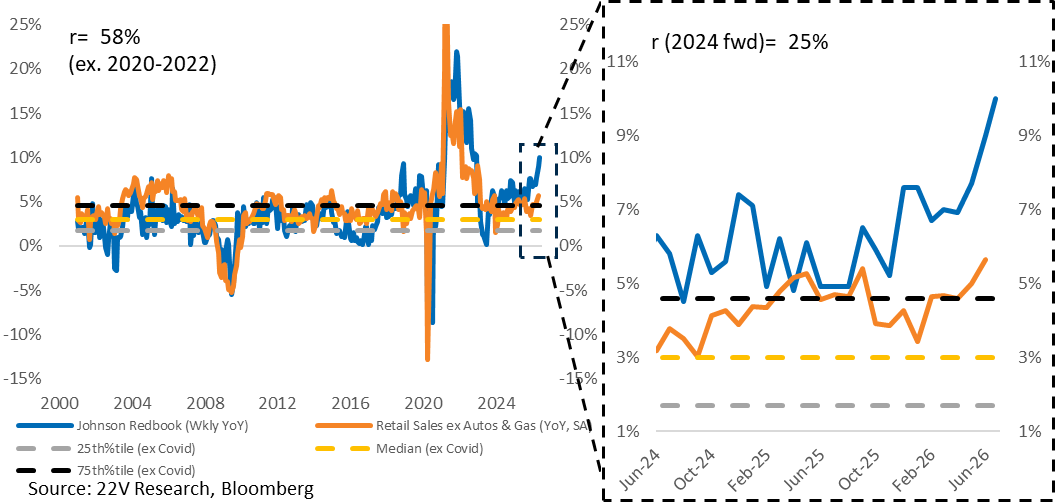
High Frequency Johnson Redbook Index Same Store Sales Weekly YoY increased to 10% from the previous week’s 9.4%.
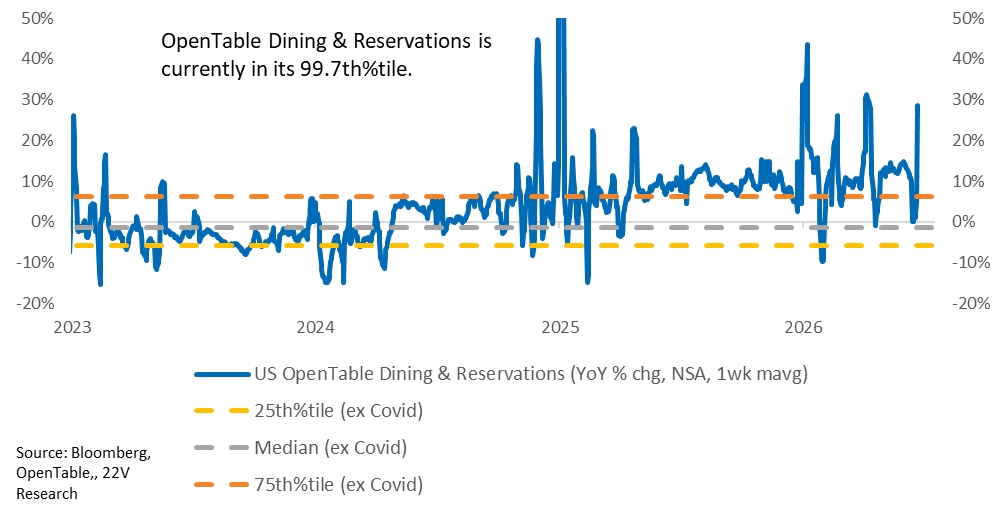
OpenTable dining & reservations have increased to its 99.7th %tile. The series measures the YoY change in seated diners from online reservations (for restaurants active on OpenTable), comparing the same day of the same week this year to last year. It is a noisy metric influenced by holiday timing, events, and weather (i.e, Father’s Day shifting dates).
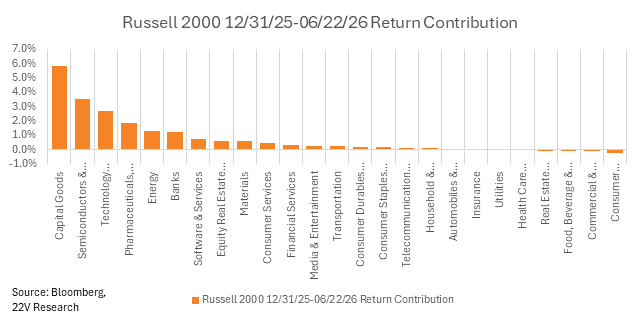
SMALL CAPS: Small caps benefit from a benign growth slowdown – economic growth slowing from ~3% to ~2%, limiting inflation overheating concerns but not increasing recession risk (HERE). Recently though, the AI buildout is the main driver of recent small cap returns. Idiosyncratic risk is the most influential component of returns.
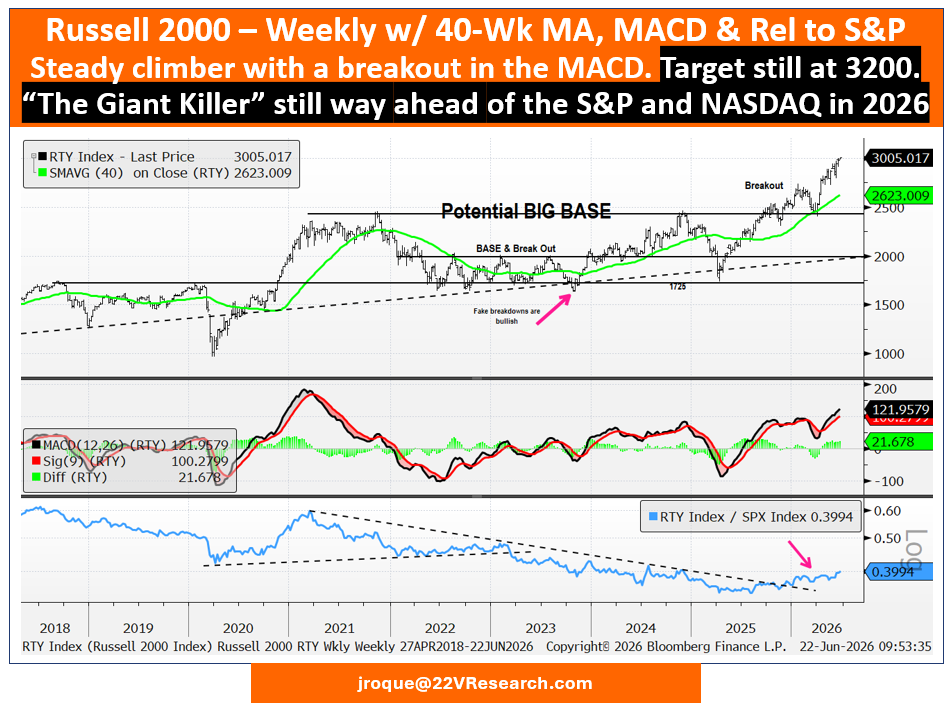
Longer Term we are inclined to lean into small cap outperformance because of our macro framework and indications from earnings reports that AI boosts profitability (HERE).
John Roque, 22V’s technical analyst, has a 3200 target on the Rusell (+6% from here).
Small cap margins continue to lag large caps. Improvement in small cap margins, driven by AI or better business practices in general, is the key to a durable multiple rerating.
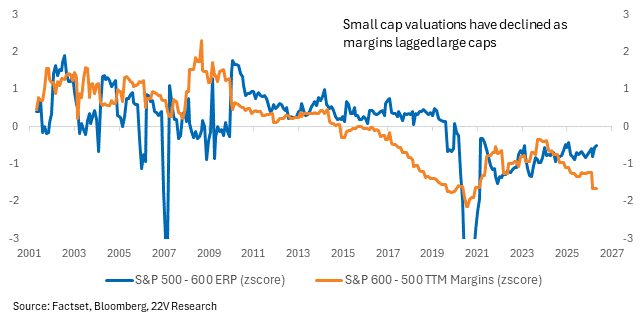
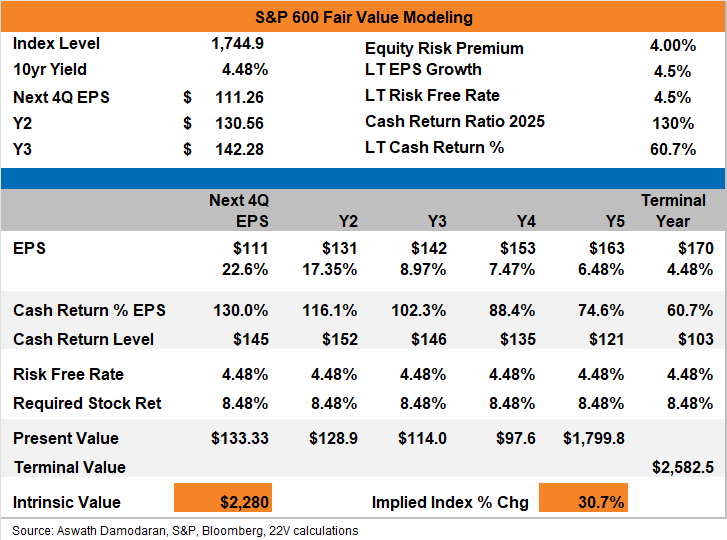
IF the multiple spread closes, likely because of margins, then implied upside in the S&P 500 is +30% relative.
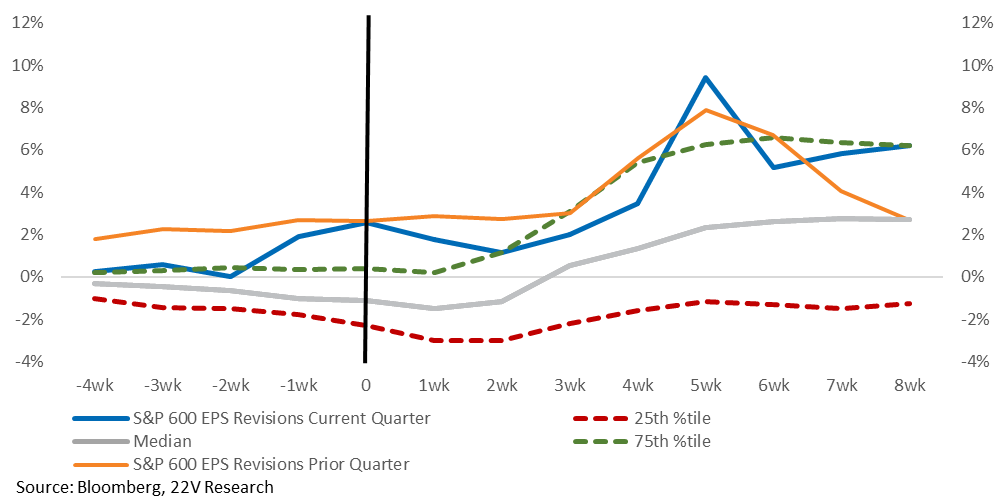
Small caps had a strong 1Q earnings season. Earnings beat rates, beat distributions, and earnings revisions were all better than normal.
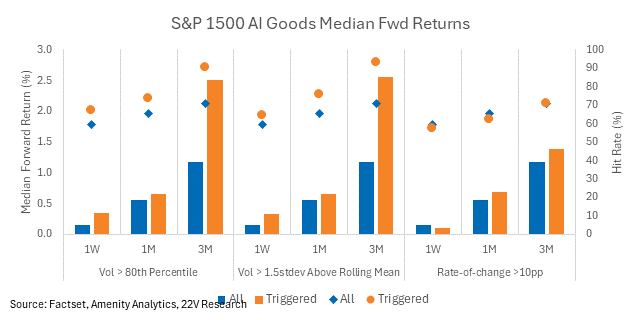
AI UPDATE: There is idiosyncratic vol from the risk of lower token prices and cheaper Chinese models eating into AI infrastructure ROI (HERE), and macro vol through the live risk financial conditions need to tighten (HERE). The limited data on realized vol does not show vol is an indicator of poor forward returns within AI Goods. Right now, realized vol is increasing in an up-trend.
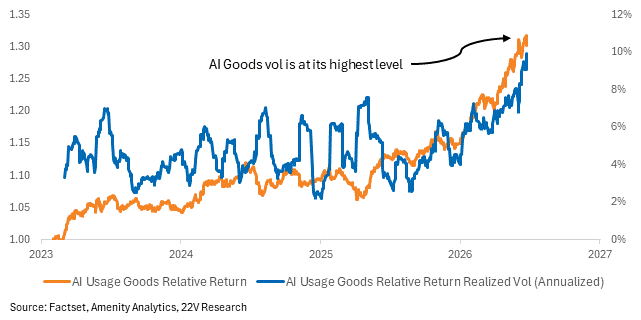
Spikes in vol have been followed by better-than-normal 1 week, 1-month, and 3-month relative returns in AI Goods.