June PCE and Q2 ECI Both Deliver Slightly Hawkish Messages
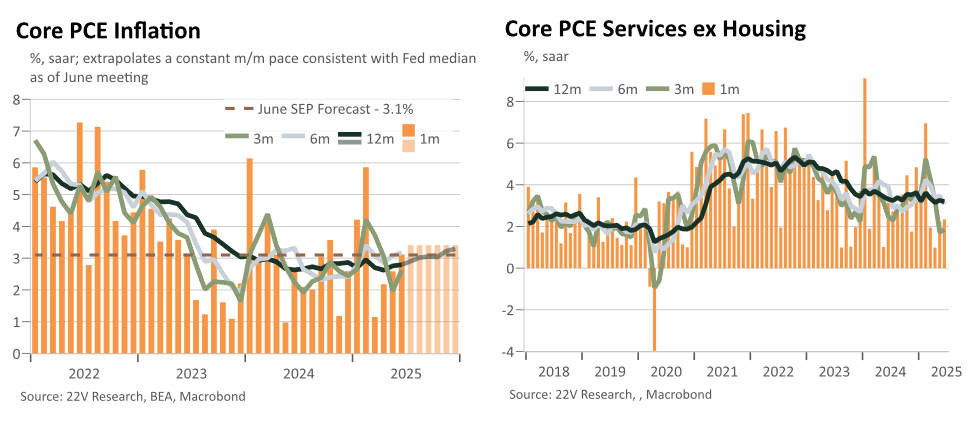
- June’s core PCE print was in line with consensus but both May and April saw revisions higher. This was driven by core services ex housing where 0.01% and 0.13% prints the past two months became 0.08% and 0.18%. Not too hot on their own but denting the disinflationary story.
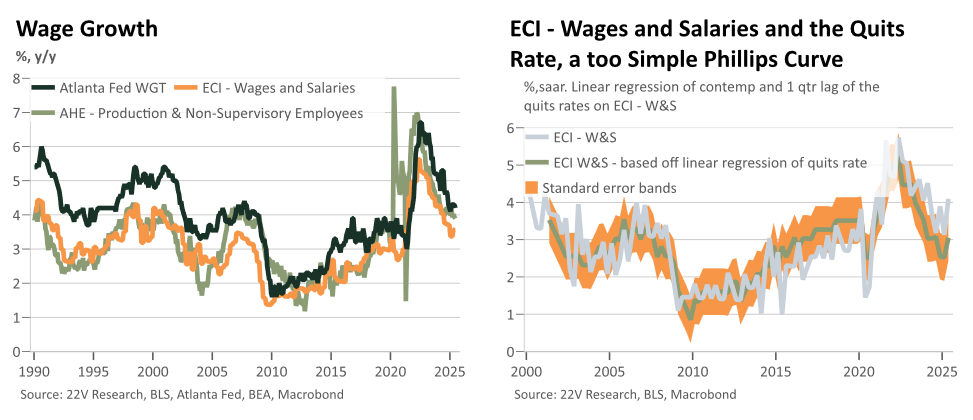
- The most concerning part of today’s data was softness in the past two month’s wages and salaries growth, softer than other sources suggest, but y/y remains around 4.5-5%.
- Leaning in the other direction is the Q2 ECI data which is consistent with underlying inflation pressures somewhat above target, and hotter than its historic relationship with slack suggests.
- Jobless claims continue to surprise in a positive direction.
- Nothing here substantially swings the Fed’s thinking from yesterday but it doesn’t tell us much about how the heart of the tariff shock will hit and how it will radiate into other prices. The setup is a bit less dovish than it could have been though. 0-2x cuts are all plausible outcomes depending on the next few months’ inflation, assuming the labor market continues its current trends. There is little discussion or pricing of a world with minimal further labor market slack easing over the next 3-6m.
June’s core PCE print was right in line with consensus but both May and April saw revisions higher. These revisions were was driven by core services ex housing where 0.01% and 0.13% prints the past two months became 0.08% and 0.18%. Not too hot on their own but denting the disinflationary story. Given the tariffs to come, and the risks they pose of some price-level shocks radiating out into the rest of the rest of inflation away from directly tariffed goods, this upward shift in recent CSEH trends is not a helpful one, even if the level itself isn’t necessarily problematic if the rest of inflation was cooperating.
It is also important to note that recent non-market prices have flattered topline core (the y/y pace of MPO core and core services ex housing is effectively flat for a year now; it may even be inflecting higher already) and CSEH will be revised higher due to lags between BLS and BEA revisions (Feb vs Sept) to some of the health care inflation components that feed into CPE.
One further inflationary issue I’m wrestling with given Powell’s frequent comments yesterday that they expect the pricing response of firms to tariffs to take longer than expected, is how the Fed will react to above “expectations” (always hard to define at short-horizons vs the SEP) inflation data over the next few months. The baseline pace extrapolated from June is roughly 0.28% m/m sa over the back half of the year. Are they expecting a smooth path or something initially jumpier with a slower descent afterwards? While Powell told us not too anchor too much to the June SEP, it is still the baseline we have in hand. In it the median expected 3.1% core PCE and a tentative 2x cuts this year, but they also thought the unemployment rate would increase to 4.5% in Q4, providing decent dovish pull lower.
The Q2 employment cost index data, the best measure of wage growth we get, suggests that wage pressures have bottomed and seem to be stabilizing over the past 4-5 quarters. Private sector wages and salaries ex incentive paid occupations, core wage growth in effect, at 3.5% is a bit warm with other measures hotter. This is happening at a pace notably above what post-2000 relationships with slack would suggest. Depending a bit upon how one assesses current productivity trends, wage growth also seems at least a bit too high to be consistent with inflation returning to 2% over the medium-term. One of the key risks, despite general nominal income stability, is that wage bargaining processes see a bit of an additional acceleration due to tariffs and this adds an additional durable leg to the inflationary impulse from tariffs (given that no one expects tariffs to boost productivity, even if AI is a wildcard here).
Nominal income growth in the PCE report has been sluggish over the past few months, and noisy on the broader measures due to social security policy changes, but y/y gains continue to hum along around 4.5-5%. These are likely to decelerate a bit going forward as payroll gains. Still recent tax withholding data remains robust in 5-6% y/y range.
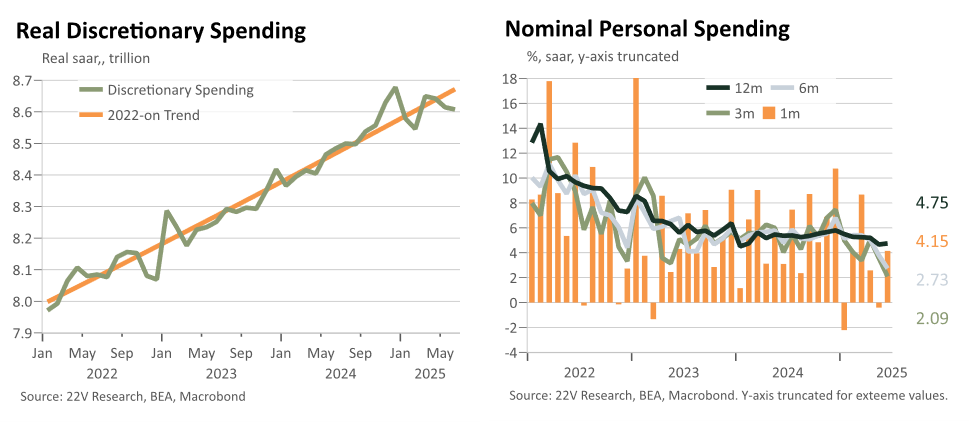
The PCE reports spending data has been noticeably soft, with little-to-no cumulative real growth to start the year. This is certainly a whiff of stagflation but the weakness started before tariffs and I think points to another framework which has been helpful since covid. Normally economists, conceptualize of and forecast nominal activity as the sum of real growth and inflation. However, since covid, I’ve found that thinking about real activity as the gap between steadier nominal activity and often cyclical volatility dominating inflation has been more useful (nominal – inflation = real). Worth noting too that we are going from a 5-6% nominal trend world towards a 4.5% one, maybe a bit below. This suggests that some of the inflation surge, which resulted in negative real volumes, is best seen as excess seasonality inflation rather than real indicative hit to activity (nominal spend was down in Jan as well but after a monstrous Dec’24). But since then, the story is less optimistic with nominal trends also slowing somewhat, in line with the timing of soft-data’s weakness around the initial tariff shocks. Recent card data (see more here) and continued nominal incomes gains suggest that some of this effect may be fading but the real impact of tariffs is also just getting started.