Weekly – Market-based measures of 1yr and 3yr inflation expectations have increased over the past two weeks. The initial move in inflation expectations reflected better-than-expected payrolls and the budget deal getting passed (growth positive). Inflation expectations and rates adjusted higher to reflect a stronger real economic growth backdrop. The labor market unwind fears we have documented (HERE) have unwound. Financial conditions remained easy (credit spreads tighter, commodity prices stable, USD stable), supporting the continued rotation into market laggards like small caps, debt risk names, and Value.
That changed late last week as the Trump administration started releasing tariff letters. Inflation expectations on a 1yr and 3yr basis broke out again, but for the wrong reason. Those moves coincided with the tariffs letters. 10yr yields moved higher and credit spreads widened while small caps underperformed. That is a supply shock reason for higher 10yr yields, which is a bad thing for riskier assets.
Bottom Line – We are sidelined on our summer risk-on framework for now: Our base case of slowing economic growth and some easing of labor markets over the coming months has not changed. That backdrop anchors long rates and inflation expectations, keeping financial conditions easy. It favors small caps, Earnings Risk, and Debt risk names. Our calls assume roughly 13% tariffs on a blended basis. If tariffs are significantly greater than 13%, which currently appears to be a risk, they will pose a significant headwind for small caps and Debt Risk names. Value should do okay. It appears markets might again have to force Trump to “back off” on aggressive trade policy, which increases the risk of higher 10yr yields, for the wrong reason.
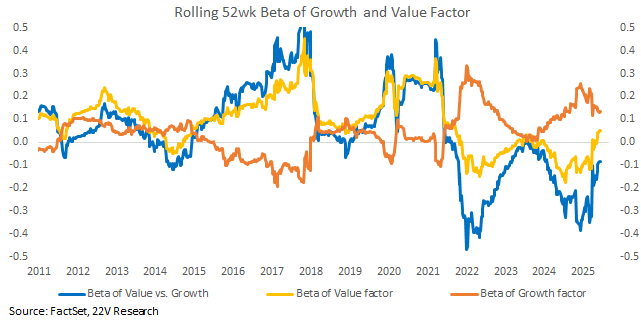
Value and Deep Cyclicals would likely perform okay RELATIVE, at least initially, in a tariff-related Risk-off move. Value’s beta to the market is close to zero and is negative relative to Growth. Value and Deep Cyclicals were the strongest relative performers in March and early April. They faded aggressively once tariff uncertainty increased downside risks to economic growth, but Trump backed off the harshest tariffs. We would be buyers of a pullback in Momentum and Growth.
More On Trade – Two things are driving the relatively muted reaction to tariff headlines, so far (this could change given the new threat of a 30% tariff on Europe issued over the weekend). Investors, according to our conversations, seem to believe two things. 1) That Trump is getting impatient with Trade progress and these aggressive announcements are an effort to get deals done. The expectation is the ultimate level of tariffs will be lower. Investors believe the admin knows how bad +13% tariffs could be for the economy. 2) That most of the IEEPA-related tariffs won’t hold up in court anyway.
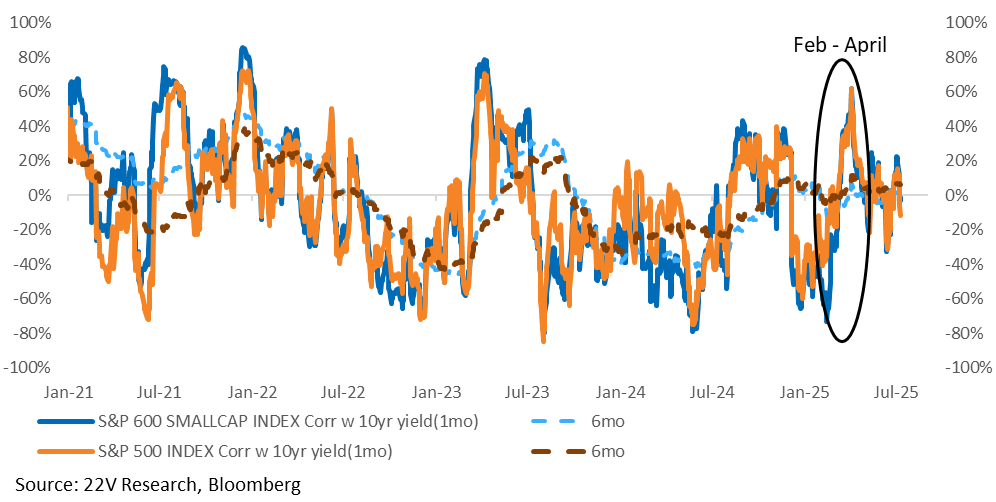
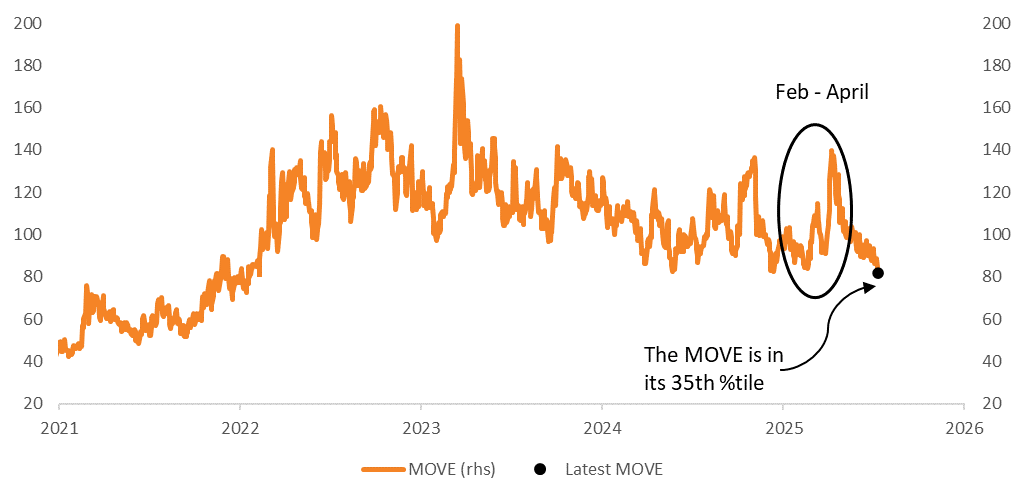
FYI – If those two assumptions prove incorrect, assets will return to the bad old days of a negative correlation between stocks and yields (higher 10yr yields = lower stocks) and significantly higher bond vol. Also, as Jacob Kirkegaard, 22V Geopolitical expert, noted over the weekend Europe likely believes that “only retaliation can really possibly make Donald Trump change his mind, now that his “initial ask” – obviously unacceptable to US trading partners – has been announced. This reduces the possibilities for a negotiated solution ahead of August 1.”
We hosted a trade webinar (replay HERE) with Alan Wolff, senior fellow at the Peterson Institute and former WTO Deputy Director-General. Alan’s view, which seems consensus, is that Trump does not have the power to apply tariffs as he is attempting due to 1) Congress’s tariff powers, 2) that Congress can’t delegate all their power, and 3) Congress didn’t delegate their power with IEEPA. He explained that while courts often defer to Presidents declaring national emergencies, they are unlikely to conclude that Congress delegated its constitutional tariff authority wholesale.
Fundamentals Into Earnings – Pretty Good Backdrop, Just Might Not Matter Much: Firm macro growth, less bad inflation, and low expectations are setting up to deliver a good 2Q reporting season. EPS growth estimates are well below where they were at the start of the year, before the tariff war kicked off, but have been stable over the past few months. There are outliers. Small-cap revisions are strong while mid-cap revisions are weak. The bottom line is that S&P 500 aggregate EPS are on track to beat expectations.
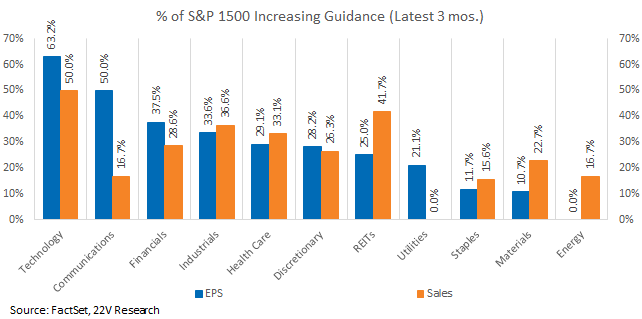
Earnings guidance over the past 3 months favors Early over Deep Cyclicals and Defensives. The percentage of companies increasing guidance is highest within Technology and Communications, with Financial and Industrials not far behind. Energy, Materials, and Staples are at the low end, with no Energy companies issuing increased guidance.
Internal earnings sentiment dropped across most factors in 1Q. The exceptions were Earnings Growth and Risk-on factors, where earnings sentiment improved slightly. Strong earnings names such as EPS Momentum, Realized Growth saw the largest declines. A rebound in earnings sentiment has the potential to benefit these factors most. That was an easier call to make before the recent increase in tariff uncertainty, but the condition still exists.
Charts & Commentary Below…
Indicators: Risk of trade impacting financial conditions is increasing again. Relative to the late Feb-April tariff headline shock, market moves have been muted (for now). That should change this week if Europe retaliates. Two things seem to be driving the relatively muted reaction to tariff headlines, according to our conversations with investors. 1) A view that Trump is getting impatient with Trade progress, and his more aggressive talk is an effort to get some deals done. The expectation is that tariffs will be lower once negotiations are completed. 2) Investors are assuming most of the IEEPA-related tariffs won’t hold up in court anyway. If those two assumptions prove incorrect, we would likely go back to the bad old days of negative correlation between stocks and yields (higher 10yr yields = lower stock prices)…
…And higher bond vol.
Source: Bloomberg
Better-than-expected economic data, easy financial conditions, and a global increase in 30-year yields (higher global 30-year yields are generally associated with more fiscal spending, so economic growth is positive) have helped the Value factor and Deep Cyclicals recently. If trade uncertainty leads to another large risk-off moment, Value and Deep Cyclicals would likely still perform okay, RELATIVE. At least on the first large market move lower. Value’s beta to the market is close to zero and is negative relative to Growth. Value and Deep Cyclicals were the strongest relative performers in March and early April. They faded aggressively once it became clear that tariff uncertainty was significantly increasing downside risks to economic growth. We would be buyers of a pullback in Momentum and Growth.
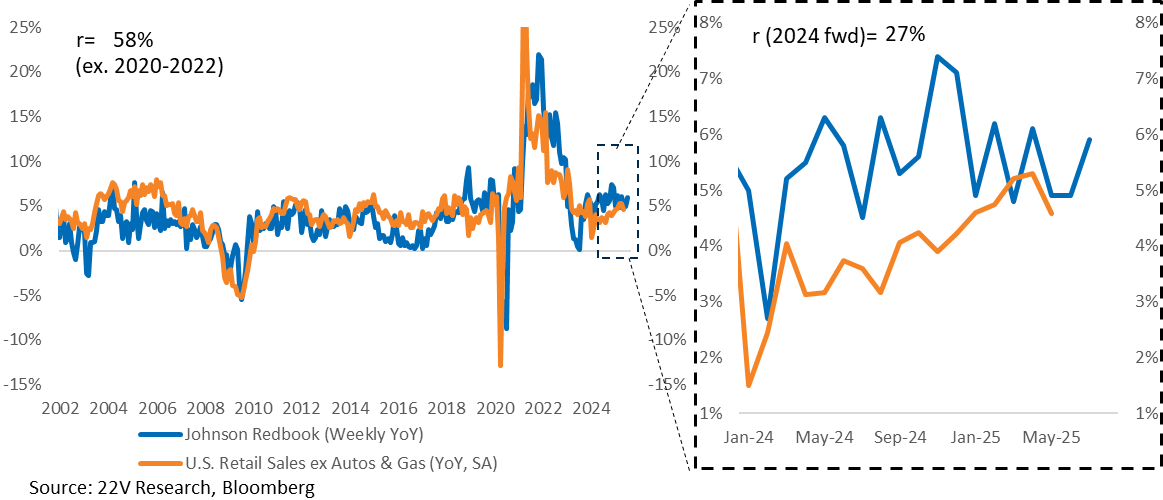
CONSUMER DATA: The Weekly YoY figures from Johnson Redbook, an index that covers a sample of large US general merchandise retailers representing about 9,000 stores, increased and remain at recent firm levels. We would not use the Johnson Redbook to predict retail sales for the month, but we would point out that directionally, the high-frequency consumer data does not indicate a significant change in retail sales trends.
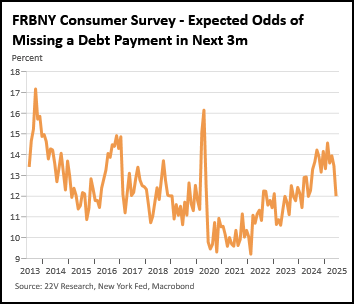
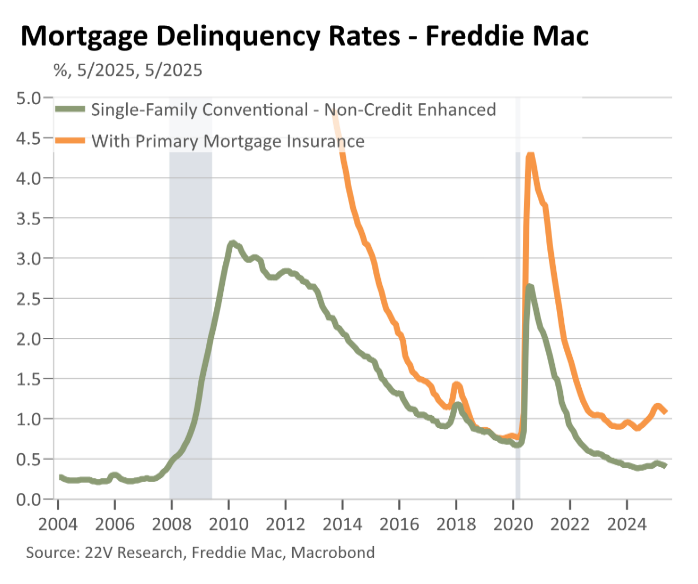
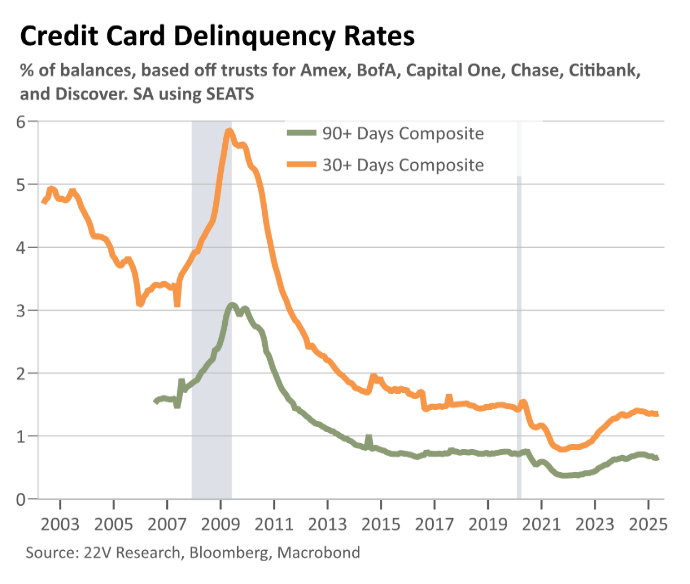
Peter Williams noted that the consumer credit environment appears to have stabilized and may even be slightly improving. One of the charts he highlighted was the New York Fed survey of consumer odds of missing a debt payment in the next 3 months. As of last month, that reading had stopped going up (good). In the update from the New York Fed yesterday, expected odds of missing a debt payment in the next 3 months declined significantly. The consumer credit charts that show some stabilization are included as well.
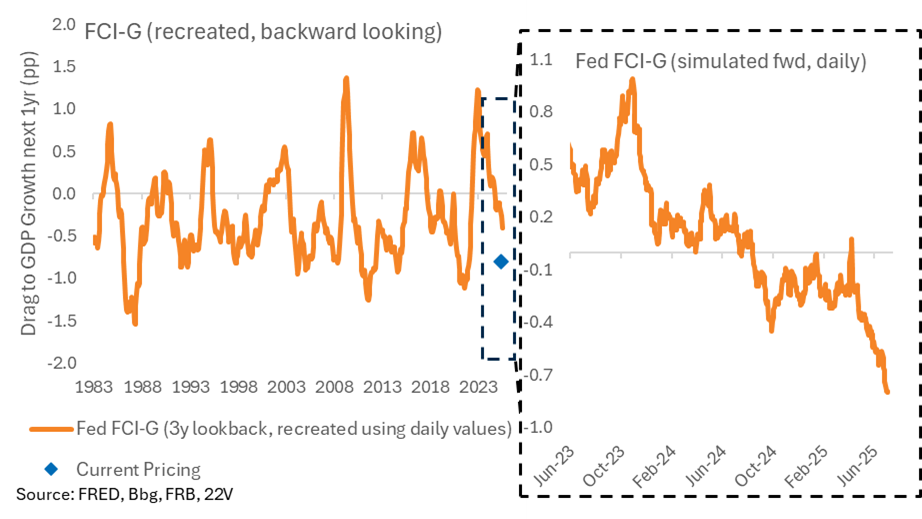
TLT TRADE: We expect higher yields in the fall as the labor market troughs and investors start discounting the impact of the budget bill on economic growth in 1H26. Higher tariffs would pull the higher rates trade into the next month, though. Labor market fears had been anchoring yields; yields tracked labor market surprises lower, and the investors we surveyed indicated the labor market was their chief concern (HERE). Once it becomes clearer that the labor market is not softening in a nonlinear way, yields have room to the upside. As we have noted a few times over the last couple of weeks, there doesn’t appear to be a good NEAR-TERM reason for the aggressive easing in financial conditions to reverse.
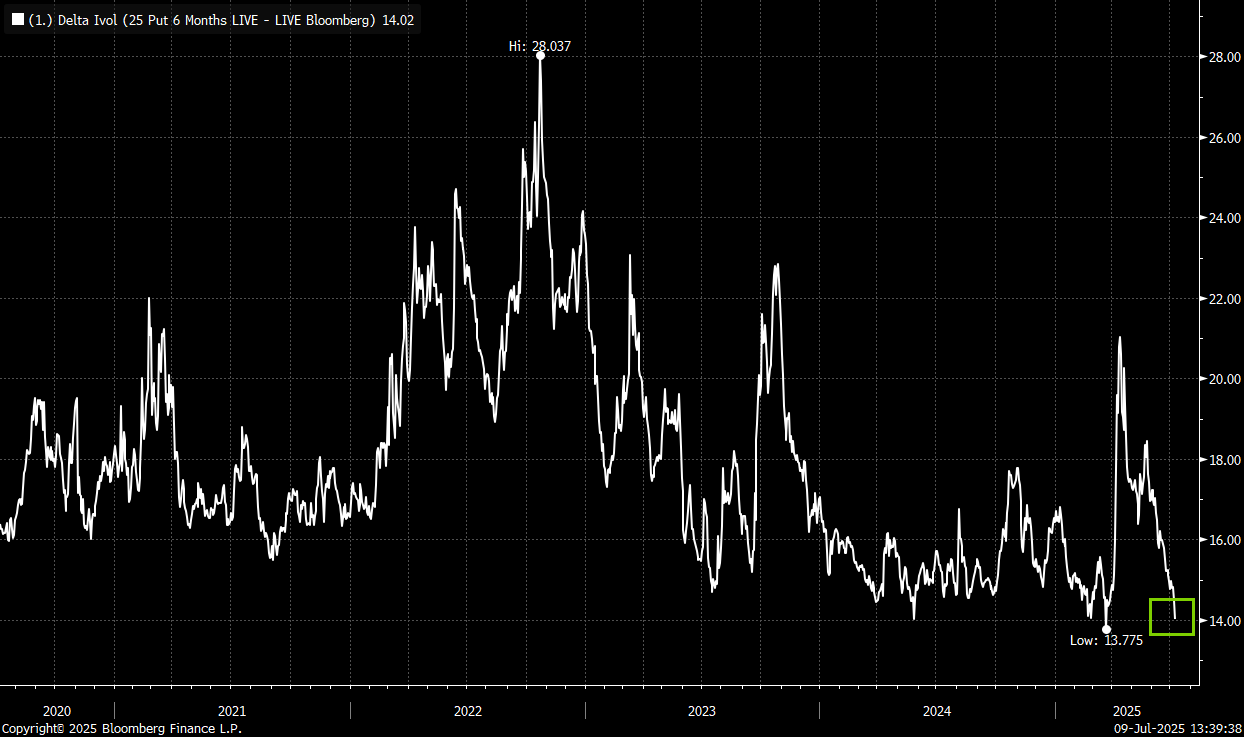
Jeff Jacobson, 22V’s options strategist, pointed out to us that implied vol in the TLT is very low. From Jeff, “While there may be concerns about a spike in yields on the long-end in the second half of the year, there certainly doesn’t seem to be much fear being priced in by the options market. When looking at 6-month 25-delta put vol in TLT, I basically see it back trading at the five-year lows (see chart below). I think with vol this “cheap” it makes sense to own tail-risk hedges for the end of the year.”
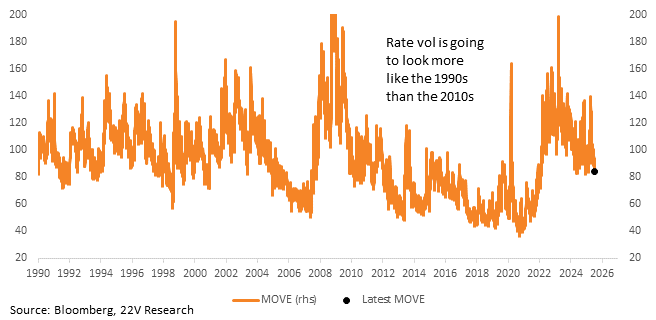
Peter Williams, 22V’s rates specialist, agrees with Jeff’s position. From Peter…
- Higher neutral rates mean more, if smaller, policy rate adjustments and moves mid-cycle and much less risk of the ZLB being restruck and crashing rates vol.
- The new inflation regime is shifting the skew in rates around neutral. Markets are still digesting the higher neutral rate and term premia implications of deficit spending, more volatile and inflationary supply shocks, fairly easy financial conditions elsewhere, and broader policy risk to LT US rates.
- As we move past the post-GFC rates regime, we should expect a much more ‘90s like rates vol environment.
Trade:
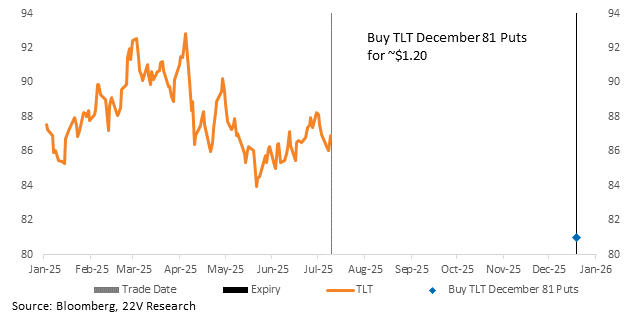
Buy TLT Dec 81 puts for ~ $1.20 (TLT 86.63 price ref)
Trade Details:
- Buying the six-month (Dec) 23-delta TLT puts with vol just above the 5-year lows
- Targeting a break below the 2023 lows for TLT
- Would imagine we see a sharp spike in vol should TLT start to move anywhere towards the former lows (why I want to own puts outright)
- Great “set it and forget” rate tail hedge given potential concerns as we move into the second half
TLT remains in a long-term downtrend. Targeting a potential break below the 2023 lows by buying the Dec 81 puts
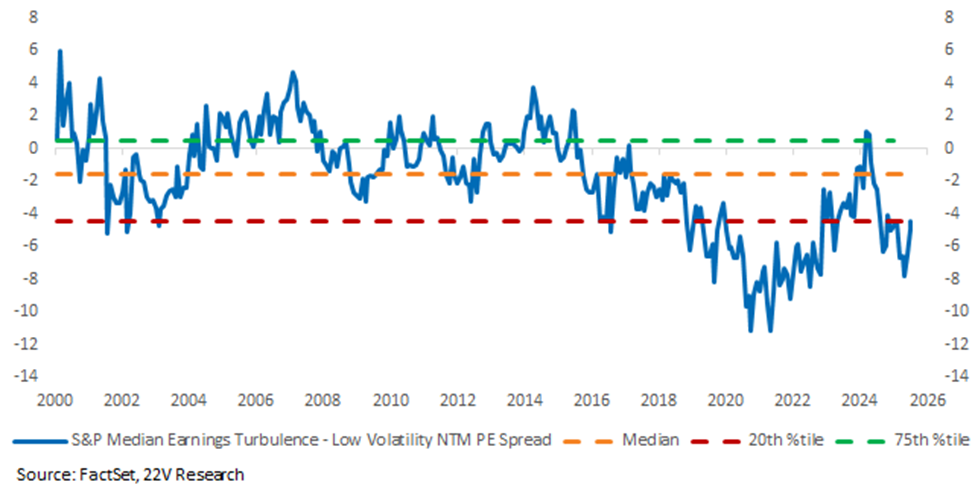
QUANT HIGHLIGHTS: As the quant team highlighted (HERE), valuations are not stretched, and high earnings risk names have had much better earnings beat rates than Low Vol recently, with better earnings sentiment to boot. The valuation spread between Risk-on and Risk-off remains around its 25th %tile even after the recent surge in risk-on. During 1Q earnings season, Earnings Turbulence names had higher beat ratio than historical median while Low Volatility beat rates were the weakest among our factors. Earnings outlook sentiment was also better for Earnings Turbulence names than for Low Volatility names. Relatively strong fundamentals help support Earnings Turbulence, especially heading into 2Q earnings season.
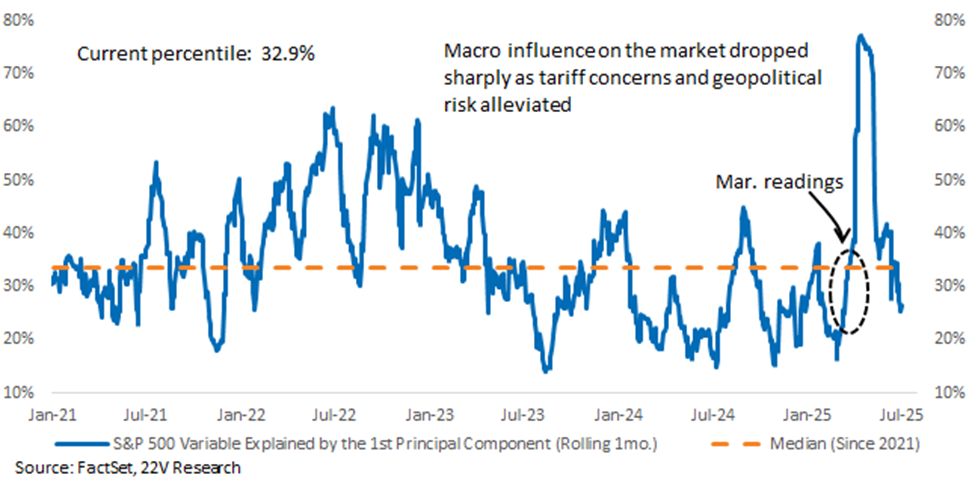
The steady economic expansion and reduced macroeconomic influence mean stock picking and micro themes will be a large source of alpha going forward. The longer the low-vol economic expansion continues, the more market laggards should catch up. EPS reporting season could be a catalyst for such moves at the stock level. We focus more on micro theme catch-ups (Housing/Biotech in particular. See options notes HERE) vs. broad-based indices moves FROM HERE.
Earnings guidance over the past 3 months favors Early over Deep Cyclicals and Defensives. The percentage of companies increasing guidance is highest within Technology and Communications, with Financial and Industrials not far behind. Energy, Materials, and Staples are at the low end, with no Energy companies issuing increased guidance.