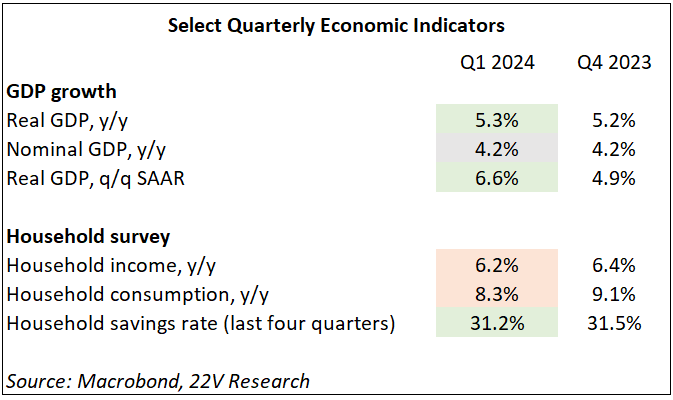
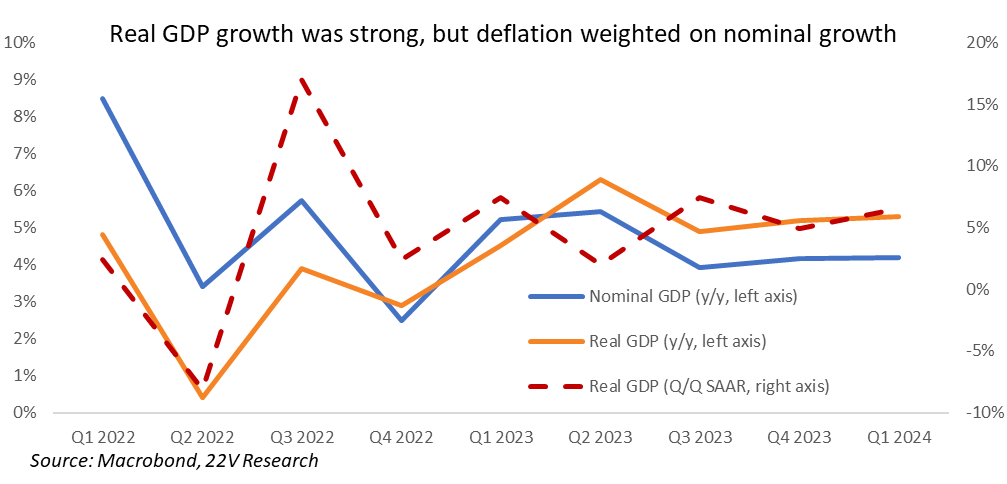
China’s real GDP growth in Q1 beat estimates by a wide margin, growing 5.3% y/y (compared to 5.2% y/y in Q4 2023) and 6.6% q/q annualized (from 4.9% in Q4 2023). However, that growth remained heavily lopsided, with the production side of the economy – manufacturing production and investment – growing faster than domestic demand, particularly consumption. And the symptoms of that imbalance – including deflation and excess capacity – became even more acute.
This was the setup we anticipated in our preview report (link HERE). With Q1 GDP growth in line with the official growth target of “around 5%” in 2024, Beijing will likely see little urgency to address weak domestic demand and shift its economic strategy. The result is that deflationary pressures will remain a drag on corporate earnings in China, and that more demand-side support will be necessary later in the year as the impact of stimulus fades and as manufacturing investment runs into the limits of sustainability. Policymakers, focused on manufacturing strength as Xi’s top priority, will likely remain behind the curve in adjusting course.
Supply side strength is running into limits of sustainability
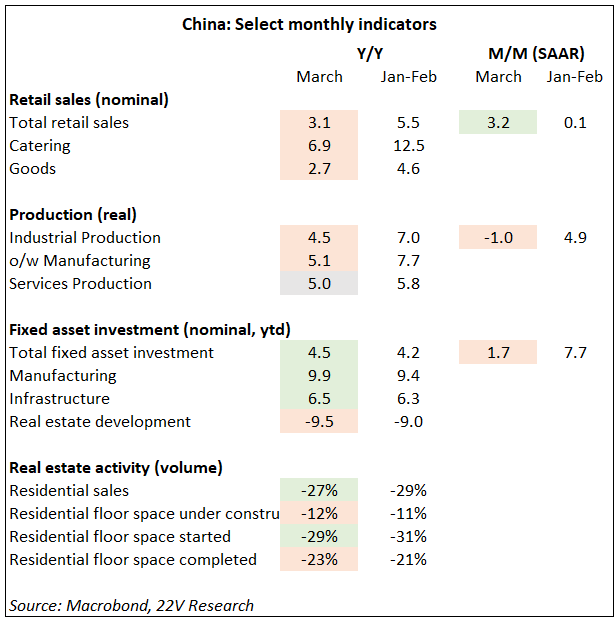
Growth in Q1 was powered by infrastructure stimulus and manufacturing activity. Infrastructure grew 6.5% y/y in Q1 (from 6.3% in Jan-Feb) as fiscal spending ramped up. While that support should continue for several more months with funding already in place, Beijing will need to announce additional fiscal stimulus later in the year given ongoing weakness in property, which crimps local governments’ spending capacity.
Manufacturing investment accelerated to 9.9% y/y in Q1 (from 9.4% in Jan-Feb). But mounting signs of excess capacity (discussed below) are a major potential headwind. Officials and firms may be forced look to slow investment growth out of concerns over domestic financial risks and brewing trade tensions. In that case, infrastructure stimulus would need to shoulder even more of the burden for sustaining activity in the second half.
Manufacturing output expanded by 6.7% in Q1, helped by infrastructure spending as well as a pickup in China’s exports in Jan-Feb. One point of caution is that manufacturing output slowed sequentially in March (-1% m/m SAAR, from 4.9% in February), though this partly reflects seasonal affects and slip in export growth that may not persist through April.
Demand challenges: cautious consumption, weak real estate sector
The headline numbers for consumption in Q1 were decent at face value. Household consumption expenditures (measured by China’s quarterly household survey) grew by 8.3% y/y, a bit slower than Q4 2023 (9.1% y/y) but still faster than overall GDP. There was a slight decline in the household savings rate though at 31% (four-quarter average) it remains above pre-pandemic levels.
However, the details show a familiar pattern from the last year: while households are spending on services such as travel, they remain cautious when it comes to spending on goods. Nominal retail sales of goods grew 4% in Q1 and by a startlingly low 2.7% y/y in March (from 4.6% in Jan/Feb). This was partly due to a fall in auto sales, which fell to -3.7% y/y (a drop of 12 percentage points). A silver lining for the consumption outlook is the resilience of household income growth (6.2% y/y) and a rise in wages for migrant workers, but there is little to suggest that consumers are feeling financially secure enough to shed cautious habits picked up during the pandemic. And travel and other spending services will likely slow due to base effects and reduced “revenge” spending to make up for pandemic restrictions.
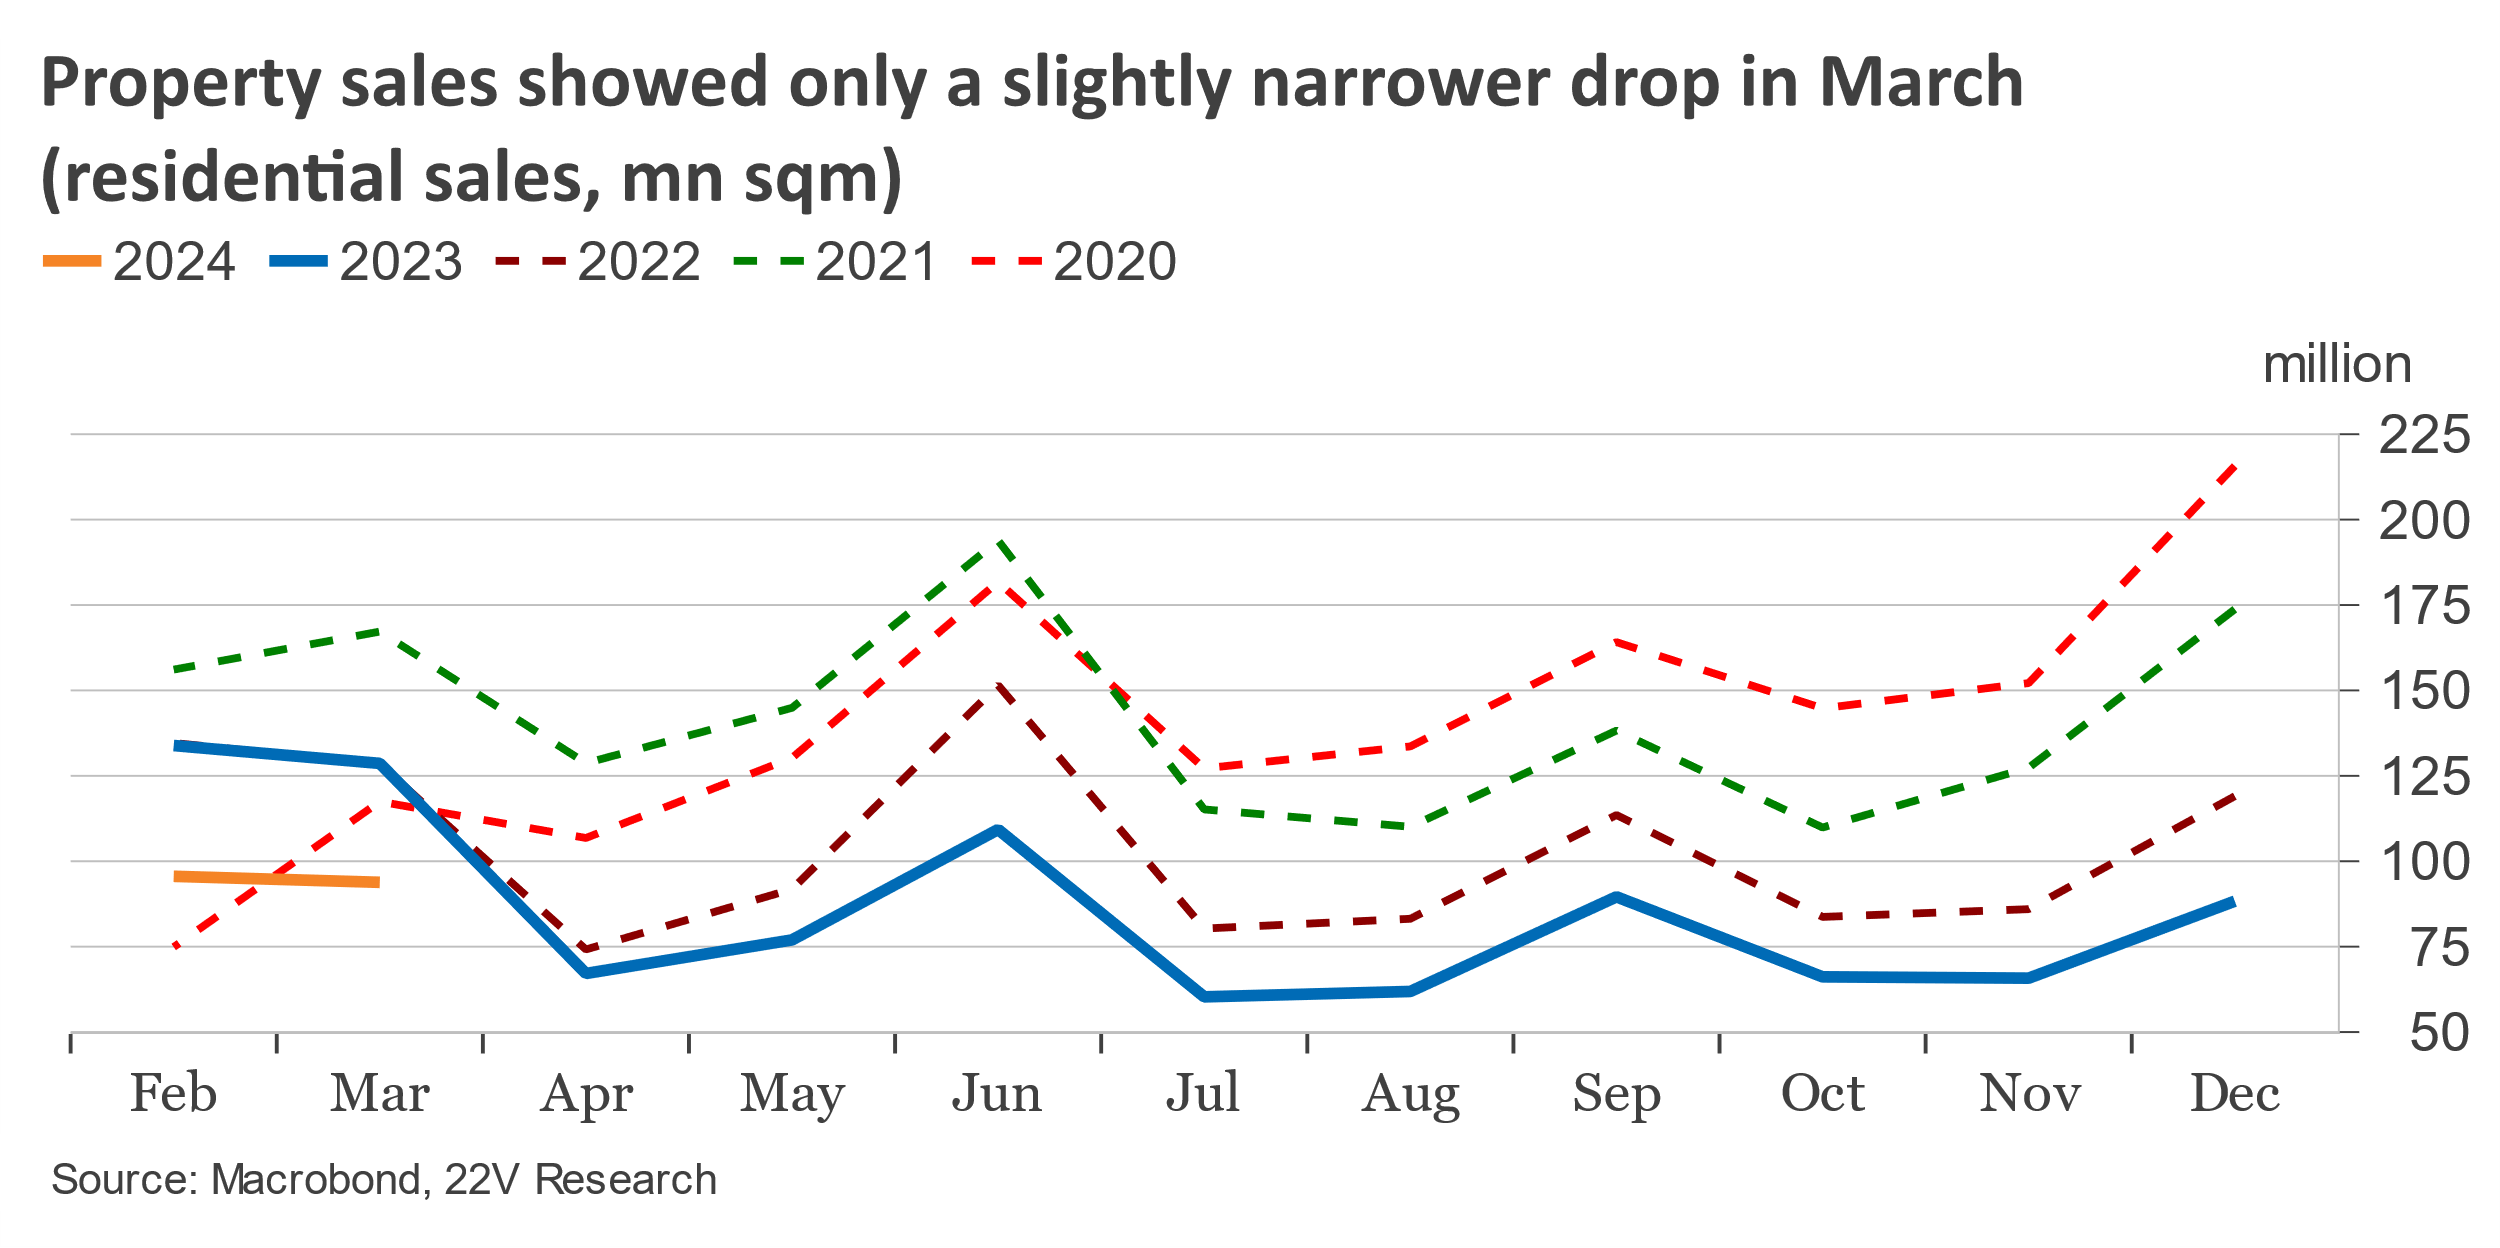
Meanwhile, real estate activity showed few signs of bottoming. Real estate investment worsened in March (-9.5% y/y YTD, from -9% in Jan/Feb) and developers’ lack of financing became more acute. China’s past revisions to y/y growth complicate comparisons in the monthly date, but by our calculations residential property sales fell -27% y/y in March, only slightly better than -29% in Jan/Feb. Weakness extended across housing starts, residential floor space under construction and residential floor space completed (see summary table). The drag from housing will continue to weigh down overall growth, fiscal capacity, and credit demand.
Outlook: Demand-side support will remain behind the curve
The main symptoms of the supply/demand imbalance became even more acute in the Q1 and March data:
- Nominal GDP growth was weak as deflation worsened. Nominal GDP growth was 4.2% y/y (the same as Q4 2023), meaning that China’s GDP deflator was -1.1% y/y (from -1% in Q4 2023). This is the fourth straight quarter in which deflation has deepened and is the fastest rate of deflation since 2009. Deflation is a direct drag on corporate revenue and profit growth and thus on macro fundamentals for China’s equity market. The longer-term danger is that deflation will feed on itself through the expectations channel, further reducing appetite for household purchases and corporate investments.
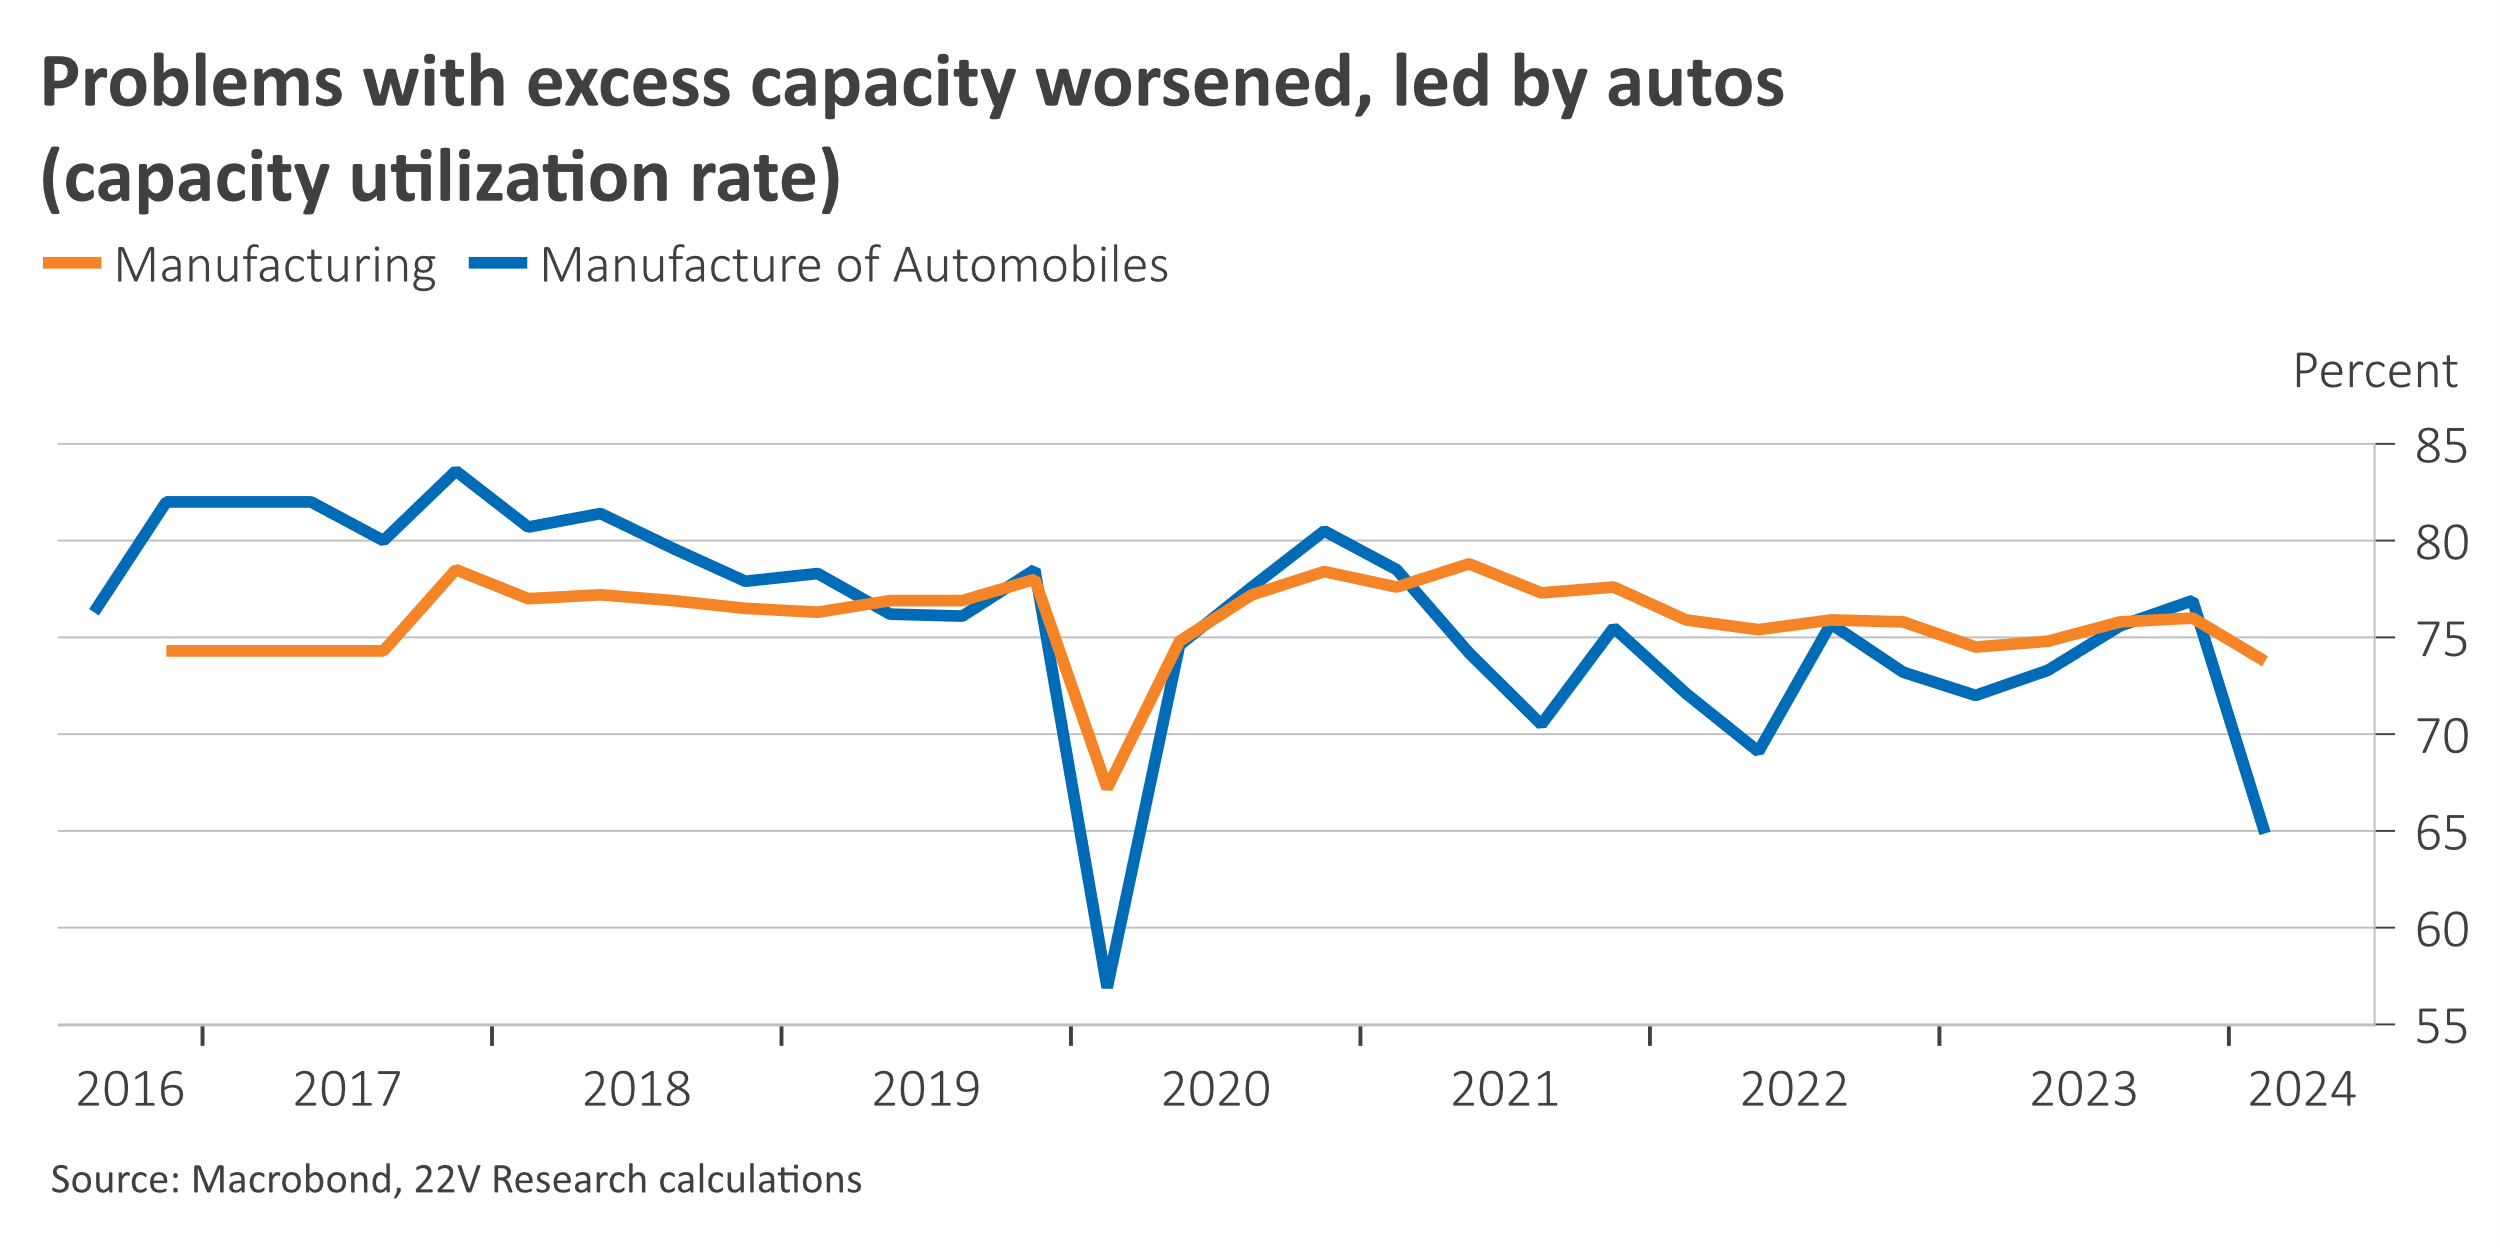
- Signs of worsening excess capacity in manufacturing. Industrial capacity utilization in Q1 fell to 73.7% (from 76% in Q4 2023), the lowest level since at least 2016 other than during the onset of the pandemic in Q1 2020. Capacity utilization in the auto sector fell from 76.9% to only 64.9%. A related indictor for industrial firms, the ratio of sales to production, fell to a record low of 93.1%. The fall in capacity utilization will add to trade complaints over China’s large manufacturing surplus and domestic concerns over the financial and fiscal risks (see our recent special report on this HERE).
But the GDP beat makes it less likely that Beijing will add more demand-side stimulus or shift its strategy in the near term. It is of course very clear to officials within the system that economic conditions for firms and households are worse than the headline GDP number, flattered by the production side of the economy, would suggest. But the fact that growth is on track with the official target makes it politically difficult to advocate for increased stimulus and especially for the two steps that are most critical for reviving domestic demand: direct stimulus to households, and a more comprehensive approach to restructuring the debt of property developers.
Instead, the path of least resistance for officials will be to continue the current incremental approach of:
- Moderate fiscal stimulus focused on infrastructure and manufacturing
- The industrial and consumer upgrading program to stimulate demand, though the impact (particularly for consumption goods) is limited by the lack of budget funding
- Marginal easing of credit conditions, with PBOC’s room for maneuver limited by concerns over exchange rate weakness as the prospect of Fed cuts this year diminishes
This approach seems unlikely to revive domestic demand and reduce slack in the economy anytime soon, with two main implications:
- Deflationary pressures seem set to persist, challenging the outlook for an improvement in corporate earnings and running the risk of an intensifying self-fulfilling dynamic, which will be watching closely for.
- Additional stimulus will likely be necessary mid-year to prevent momentum from slipping amid the downside pressures from property and weak consumption. But Xi’s focus on fiscal discipline and manufacturing strength means that policy will likely remain behind the curve in supplying that support on a timely basis.