Back Portfolio Strategy

Growth is Way Too Strong Right Now

Published on February 6, 2024

∙ Download the PDF Report

By

Dennis DeBusschere

Brian Herlihy

Kevin Brocks

Sophia Wang

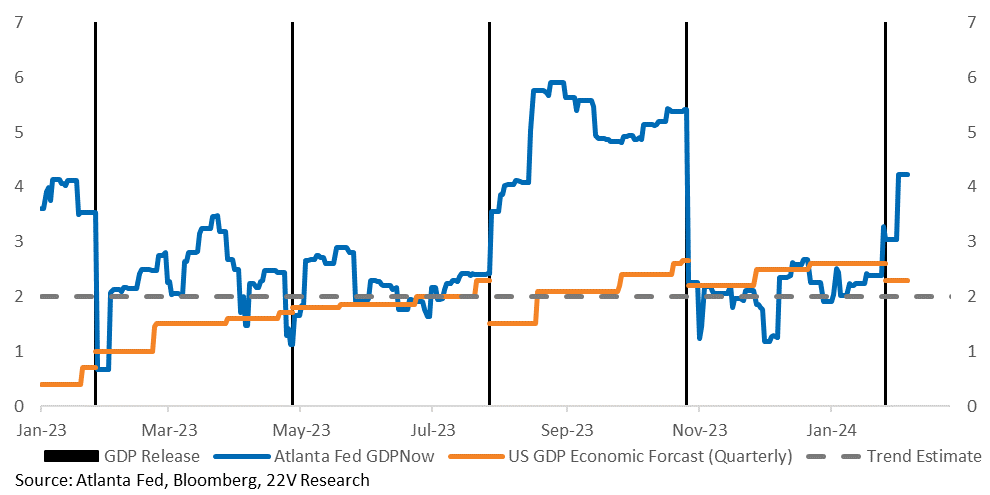
SUMMARY: Economic growth is too strong right now. Atlanta Fed GDPNowcast for 1Q24 is tracking 4.2%. That is significantly above estimates of trend GDP (2%ish), and consensus estimates of 2.3%. The Senior loan officer survey (SLOOS) showed a noticeable decline in the share of banks tightening credit standards and recent comments from banks and financial institutions suggests that the credit cycle, especially for the consumer, is normalizing (see Peter Williams’ report HERE for more details). If economic growth is running well above trend, while the economy is at full employment, the risk is core inflation remains too high for the Fed increases.

A graph of a graph of a graph

Description automatically generated with medium confidence

Just like in 3Q23, when estimates of GDP growth ran WELL ABOVE trend and 10yr yields started to increase, Cyclicals outperformed Defensives. The Cyclical outperformance is concentrated in Early Cyclicals though and the Low Vol factor has outperformed across sectors. Deep Cyclicals have lagged, companies with debt sustainability concerns have been punished (MS22DEBT) and small caps have underperformed. Our call has been for stronger than expected GDP growth in 1H24 (our call is 2-2.5%), but current strength is much more than we expected and punished our calls.

Over the course of 2024 it is highly unlikely data will continue to track 4% and core PCE is highly likely to fall to the 2.5% range, or below, on a YoY basis. But how and why the economic data decelerates will be critical for how risk factors trade.

BOTTOM LINE: Either economic growth is going to slow the easy way or the hard way. The easy way is economic activity moving back toward the 2-2.5% range without a large change in rates or broader financial conditions. That would make the Fed more comfortable, their inflation targets will be met and allow for 3 -4 cuts. Risk-on factors work. Or growth slows the hard way. I.e. persistently stronger growth leads to higher 10yr yields (corporate spreads, mtg rates, etc.,) and expectations of much slower economic growth in the back half of 2024. In the later scenario, risk assets will trade poorly until the slower growth mission is accomplished.

If economic data shows some slowing over February and March without significant FCI tightening, we will become more interested in a risk-on factor rebound. For now, we will wait to see how things evolve and focus more on fundamental factors and mitigating risk factor exposure.

More details in the full report below…

MARKET VIEWS: Economic data last week was much stronger than expected and the Atlanta Fed’s GDPNow estimate for 1Q24 is now 4.2%. The risk is elevated (though not certain) that the Fed delivers significantly fewer rate cuts in 2024. We’re not arguing that 4.2% is accurate – the point is that the data is much stronger than just about everyone estimated has increased the risk of significantly higher 10yr yields. The last few days internals have looked like 3Q23, when the data was much stronger than expected, and riskier equities came under pressure as UST yields increased.
A graph of a graph of a graph

Description automatically generated with medium confidence

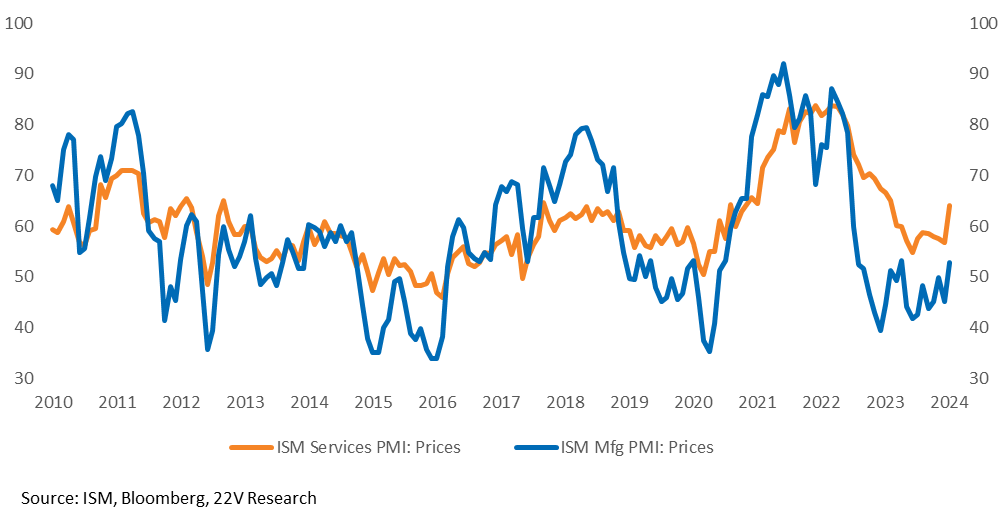
The service ISM yesterday reinforced last week’s strong data. Headline at 54.3 vs 52 expected and 50.5 last. The prices paid component jumped from 56.7 to 64. Risk-off factors were positive (Low Vol +21bps) and companies with debt problems severely underperformed (MS22DEBT Index on bbg -1.23% relative). The Senior Loan Officer Opinion Survey (SLOOS, also released yesterday) showed a significant lessening in the share of banks continuing to tighten credit standards. Peter Williams’ take is that it removes a downside tail for the Fed to risk manage (dovishly). The FOMC had the SLOOS early and removed the bank language from the statement.
A graph showing the price of the company

Description automatically generated with medium confidence

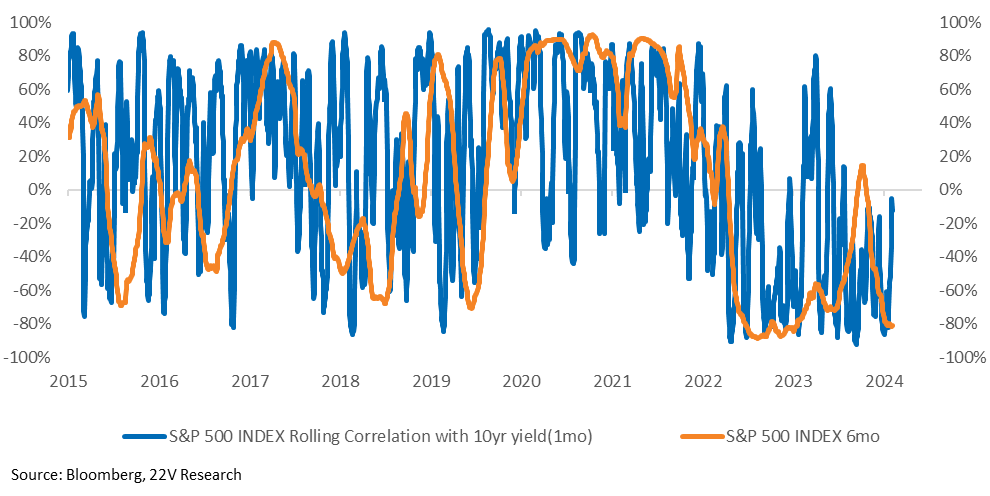
The soft ECI and good productivity data last week are helpful to risk assets when growth is +2%, but not good enough with growth at +4%, given the Fed had already pushed back against a March cut pre-Payrolls. Per Peter Williams, “Seems like the ‘why bother cutting given growth’ argument might only get a bit stronger and some of the easiest part of disinflation is done so the m/m wiggles probably start mattering more than they should.” We think that the framework applies to risk factors. Riskier assets need to see some evidence that growth is not at a breakneck pace here, otherwise increases in yields will be a headwind.
A graph with blue and orange lines

Description automatically generated

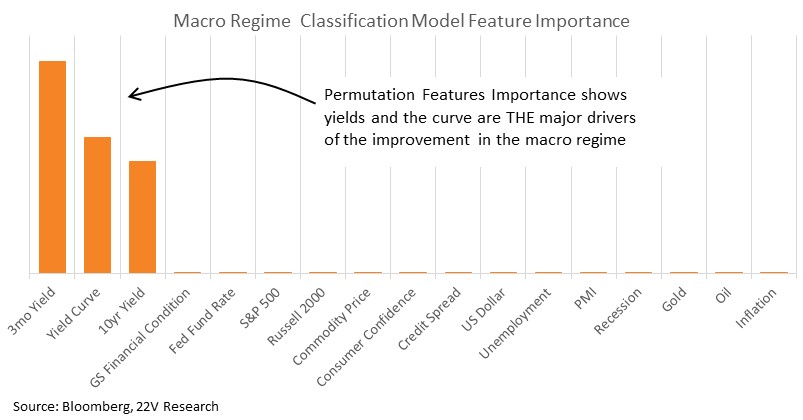
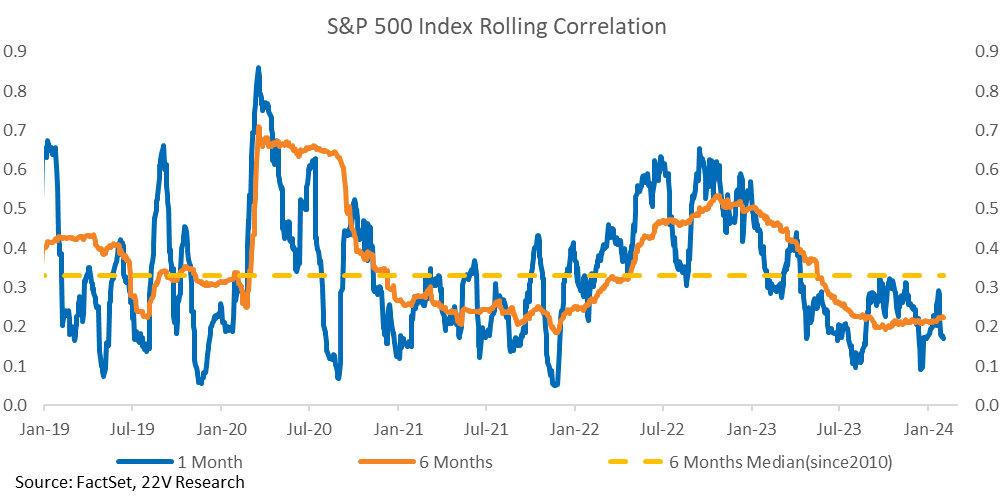
The macro regime is VERY sensitive to changes in yields and curve today, and that sensitivity is mirrored in the market reaction to changes in short rate expectations. The probable regime is still one of ‘Growth,’ though those odds decreased 5pp following the move in yields over the past few days. The bottom line is policy uncertainty is feeding rate volatility, which is impacting risk assets. The strength of the macro backdrop supports lower average levels of volatility/correlations, the outperformance of fundamental factors, and Cyclical leadership OVER TIME. For now, concerns are high that growth is far too strong currently and that means tighter for longer policy, and increased risk of a policy mistake. Higher yields and tighter FCI will act as a governor on growth, but we will likely need to see inflation data ease for risk assets to works first.
A graph showing the difference between the average and the average

Description automatically generated with medium confidence

The practical implication risk rotations will be harder to play here. If economic data shows some slowing over February and March without significant FCI tightening, we will become more interested in a risk-on factor rebound. For now, we will wait to see how things evolve and focus more on fundamental factors and mitigating risk factor exposure.
A graph with blue and orange lines

Description automatically generated

DISCLOSURES AND DISCLAIMERS

Analyst Certification

The analyst, 22V Research Group, primarily responsible for the preparation of this research report attests to the following: (1) that the views and opinions rendered in this research report reflect his or her personal views about the subject companies or issuers; and (2) that no part of the research analyst’s compensation was, is, or will be directly related to the specific recommendations or views in this research report.

Analyst Certifications and Independence of Research.

Each of the 22V Research analysts whose names appear on the front page of this report hereby certify that all the views expressed in this Report accurately reflect our personal views about any and all of the subject securities or issuers and that no part of our compensation was, is, or will be, directly or indirectly, related to the specific recommendations or views of in this Report.

22V Research (the “Company”) is an independent research provider. The Company is not a member of the FINRA or the SIPC and is not a registered broker dealer or investment adviser. 22V Research has no other regulated or unregulated business activities which conflict with its provision of independent research.

22V Research, LLC is a professional services and independent publication organization. 22V Research, LLC is not a securities broker-dealer, not a member of the Financial Industry Regulatory Authority (FINRA), not a registered investment advisor (RIA) and not a member of SIPC.

Securities transactions, when offered, are offered by 22V Securities, LLC through LPS Capital, LLC. Certain employees of 22V Securities, LLC are dually registered as securities representatives of LPS Capital, LLC or Analyst Hub Securities, LLC. 22V Securities, LPS Capital and Analyst Hub Securities are members FINRA, SIPC.

https://brokercheck.finra.org/

Current Ratings Definition.

SECTOR OUTPERFORM: An “outperform” rating anticipates the company will outperform the S&P Regional Banking Index (peer group).

SECTOR PERFORM: A “market perform” rating anticipates the company will perform in line with the S&P Regional Banking Index (peer group).

SECTOR UNDERPERFORM: An “underperform” rating anticipates the company will underperform the S&P Regional Banking Index (peer group).

Limitation Of Research And Information.

This Report has been prepared for distribution to only qualified institutional or professional clients of 22V Research Group. The contents of this Report represent the views, opinions, and analyses of its authors. The information contained herein does not constitute financial, legal, tax or any other advice. All third-party data presented herein were obtained from publicly available sources which are believed to be reliable; however, the Company makes no warranty, express or implied, concerning the accuracy or completeness of such information. In no event shall the Company be responsible or liable for the correctness of, or update to, any such material or for any damage or lost opportunities resulting from use of this data. Nothing contained in this Report or any distribution by the Company should be construed as any offer to sell, or any solicitation of an offer to buy, any security or investment. Any research or other material received should not be construed as individualized investment advice. Investment decisions should be made as part of an overall portfolio strategy and you should consult with a professional financial advisor, legal and tax advisor prior to making any investment decision. 22V Research Group shall not be liable for any direct or indirect, incidental or consequential loss or damage (including loss of profits, revenue or goodwill) arising from any investment decisions based on information or research obtained from 22V Research Group.

Reproduction And Distribution Strictly Prohibited.

No user of this Report may reproduce, modify, copy, distribute, sell, resell, transmit, transfer, license, assign or publish the Report itself or any information contained therein. Notwithstanding the foregoing, clients with access to working models are permitted to alter or modify the information contained therein, provided that it is solely for such client’s own use. This Report is not intended to be available or distributed for any purpose that would be deemed unlawful or otherwise prohibited by any local, state, national or international laws or regulations or would otherwise subject the Company to registration or regulation of any kind within such jurisdiction.

Copyrights, Trademarks, Intellectual Property.

22V Research Group, and any logos or marks included in this Report are proprietary materials. The use of such terms and logos and marks without the express written consent of 22V Research Group is strictly prohibited. The copyright in the pages or in the screens of the Report, and in the information and material therein, is proprietary material owned by 22V Research Group unless otherwise indicated. The unauthorized use of any material on this Report may violate numerous statutes, regulations and laws, including, but not limited to, copyright, trademark, trade secret or patent laws.
