Summary: We spent the week in Abu Dhabi, Dubai, and London. Investors we met with expressed concerns over valuation (although nobody seemed particularly negative on stocks) and near-term downside risk to US labor markets. It is commonly believed that the US is a relative winner in 2024 given European and China economic growth concerns. Large international allocations to U.S. markets might help explain some of the mega cap outperformance to start 2024.
We reiterated our call that easing financial conditions in 3Q24 will lead to firmer than expected growth in 1H24, the Fed would cut 3-4 times this year, 2024 economic estimates will be revised higher, and spent just about every meeting pushing back against the idea that an abrupt loosening of the labor market was likely. Economic data last week was supportive of our view of stronger growth and low enough inflation for the Fed to cut 3 or 4 times. The data supported the risk-on rotation market internals last week (Value, Cyclicals & GARP all outperformed).
On The Labor Market Concern Discussions: Investors seem to be leaning on the slowdown in hiring, declining quit rates, and negative private payroll revisions as reasons for concern. We explained that being at full employment and through the BLS estimates of labor supply, hiring SHOULD slow, and payroll growth of 75-100k is all that is needed to keep the unemployment rate flat. The Atlanta Fed’s wage tracker has been at 5.2% for the past 3 months, suggesting some of the weakness in the labor market people have been concerned about has abated.
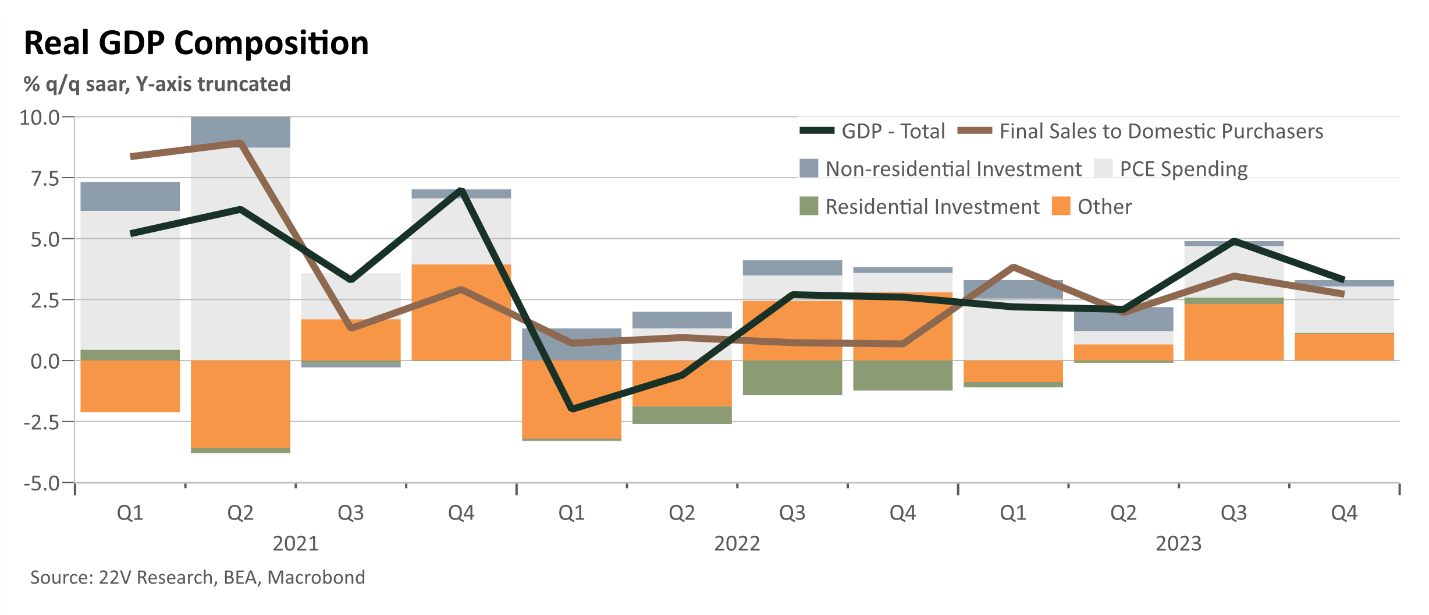
Also, as Gerard highlighted, “total real personal consumption expenditure growth was up 54 basis points last week, and the ex-auto core was up 50 basis points. The statistical launch into Q1 is quite strong. For example, if real PCE were to grow sequentially at an annualized rate of 2% through the quarter, then the growth rate for the quarter would be 3.4%.” The pre-COVID trend was ~1.25%. Why would firing increase in an environment of such strong consumer spending (claims are VERY low now)?
Fundamental Support That Has Been Consistently Missed: A force that has been consistently underappreciated is the RAPID private sector balance sheet repair (the other side of the fiscal deficit). The strong net worth effect has helped keep savings rates low, and the positive real income shock that consumers have been experiencing (goods have fallen at a much more rapid pace than wages). And consumer spending HAS NOT been credit dependent. We covered this in more detail as part of 2024 Outlook (HERE) and spent considerable time talking to investors about this last week.
Bottom Line: Our forecast of 2-2.5% real GDP growth and 3-4 cuts is positive for risk-on factors, Cyclicals over Defensives, small and mid-cap stocks, and GARP. Data last week justified that view. Also, stable PMIs, strong new orders, and improving outlooks do not support continued topline pressures going forward. And margins have 1) expanded, and 2) consistently surprised to the upside (they are 10bps stronger than expected early in 4Q23 reporting). The bar for earnings remains low (see details below). This all supports a catchup in laggards, particularly those with a disconnect between performance and macro variables. Check out more on that HERE.
Two Tail Risks Odds that Need to Decline for Risk-on Trends to Persist: We expect the labor market data over the next few months to be the key swing factor in either eliminating or justifying the economic tail arguments. The two main tail arguments are as follows. Tail Risk 1) The Fed cuts 6+ times to aggressively offset recession risk. Given concerns of downside risk to economic growth to start the year (more HERE) and the Bloomberg recession probability of 50%, this was the concern for the first few weeks of 2024. If this happens, own Mega caps and Defensives. Tail Risk 2) 1 or 2 cuts and done scenario, or something similar that leads to significant financial conditions tightening. Economic growth being well above trend (above 2.5%ish) and wage growth remaining around current levels would increase that risk. It would suggest core inflation could re-accelerate in later 2024. That is the 3Q23 playbook scenario. Debt Risk baskets, small caps, mid caps, and all risk-on factors all suffer.
We opened every meeting explaining why we are worried about the much tighter FCI scenario, because growth is too strong relative to expectations of the Fed cutting 6 times (which would require economic growth to be seen as much weaker than expected).
Clearing Events: The odds of one of the tail scenarios coming to fruition need to be reduced further for risk-on leadership to sustain momentum. This week COULD provide some support for lower tail risk if there are no large surprises from the Fed, major earnings announcements, and the payroll report. Peter Williams expects the Fed meeting “to be relatively sedate with minimal changes to the statement, with enough looming data and lack of consensus on a possible March cut to make it a wait and see meeting more than anything else.” Payroll is expected to be 180k on the headline, a urate of 3.8%, and wage growth that moves down a touch MoM. A “sedate” fed meeting and consensus payroll would be a LARGE positive for risk assets.
Investors are also focused on the US Treasury Quarterly Refinancing Announcement (QRA). On 1/31 we get the breakdown of issuance and USD amount per maturity that they plan to target. We don’t have anything to add, but just pointing out that if it passes without much fanfare, that would be a good thing, and another clearing event passed.
Charts and commentary below…
Indicators: Peter has a longer-term take on the data (HERE), but the punch line is that recession risk is declining. “The economy keeps beating expectations, inflation has fallen, and the rate-sensitive and cyclical sectors did suffer serious drags. But the overall strength of the consumer, a general reluctance of firms to lay off workers after having such difficulty in re-staffing post-pandemic, robust nominal topline growth, and the asynchronized nature of many of the hits to activity means that the long-expected recession has not yet materialized… Having the same causal story running for strongly recession calls, or very elevated odds, seems a stretch; at some point the mechanism just isn’t working.”
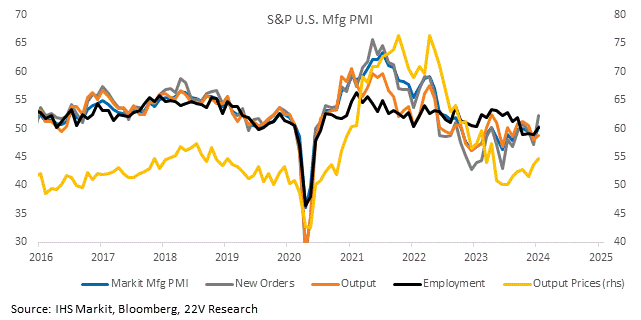
The S&P PMI showed manufacturing prices may be bottoming, consistent with Peter’s view that core goods disinflation is set to slow and mostly fade over 1H24. The official writeup (HERE) flagged improving new business conditions and outlooks several times.
Stable PMIs have contributed to our regime classification model reading ‘Growth.’ The recessionary argument we see most is that labor flow data (like the JOLTS hire rate) show underlying weakness in the labor market. There was a surge in hiring over the past few years, even with slowing growth. Continued topline pressures would eventually mean layoffs to preserve margins. Stable PMIs, strong new orders, and improving outlooks do not support continued topline pressures going forward. And margins have 1) expanded, and 2) consistently surprised to the upside (they are 10bps stronger than expected early in 4Q23 reporting). This all supports a catchup in laggards, particularly those with a disconnect between performance and macro variables. Check out more on that HERE.
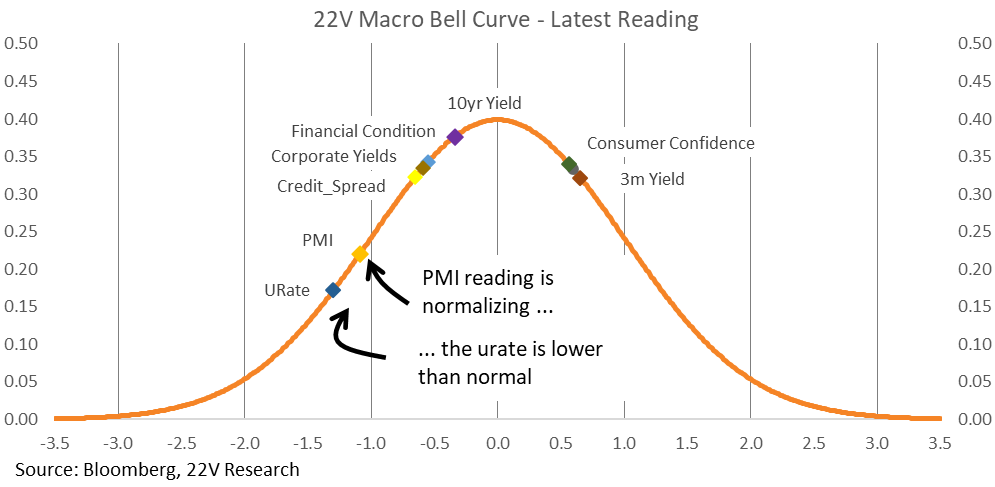
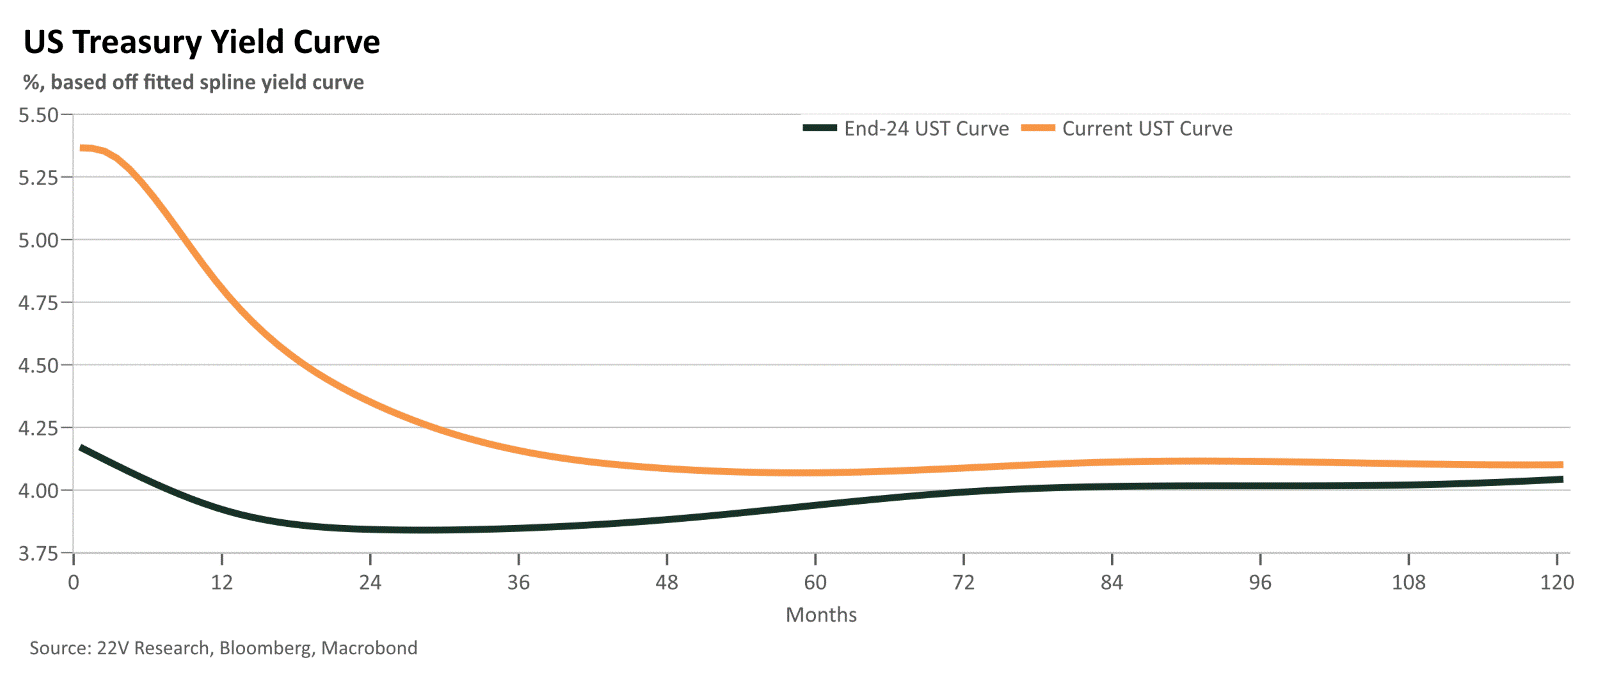
Our macro regime model is much more sensitive to yields and yield curves today, and that is also where some of the biggest deviations between factor performance and the macro environment have taken place. Yield curve futures indicate the 10s2s will be positive at year end, roughly a +50bp steepener. Value is lagging though. Realization of futures would support further catchup.
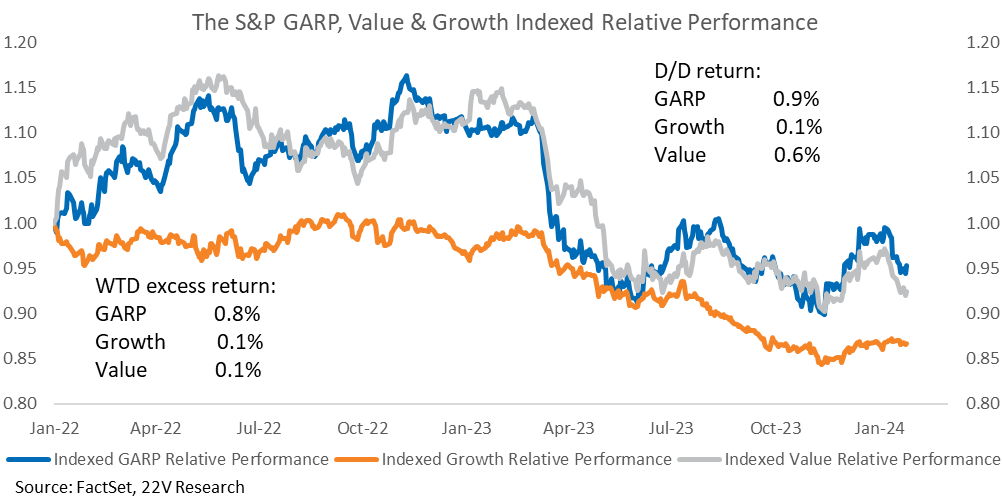
The bottom line is that growth is stronger than expected and considerably better than feared. Yields fell. Small caps outperformed large. Value and risk-on factors, two segments of the market that have lagged the economic backdrop the most, performed better last week. Also, lower recession risk will continue to benefit Cyclicals relative to Defensives longer-term. Within Cyclicals, Early Cyclicals (Tech, Comm Svcs, Discretionary) less exposed to Size and Momentum, and Deep Cyclicals should benefit. And after a Value catchup, our favorite factor play is GARP. The Fed won’t let economic growth runaway, so some exposure to Growth along with Value makes sense. FYI, our formulation of GARP outperformed Growth ex-GARP and Value ex-GARP.
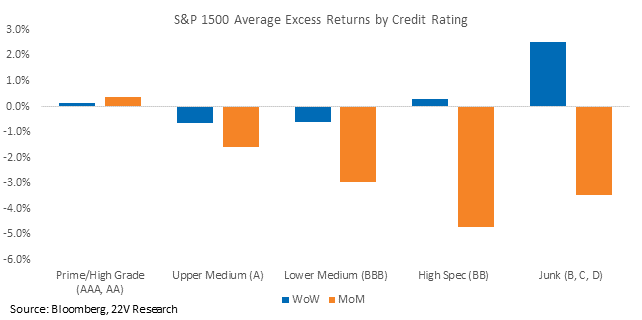
The spec and junk parts of the market have reversed some of the YTD trend this week. Lower recession risk and tighter spreads are a tailwind to lower rated names.
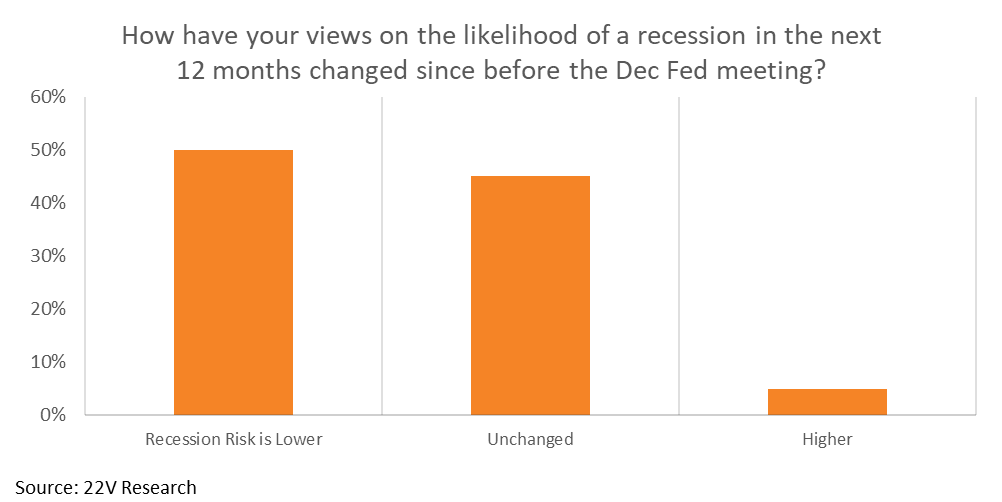
The investors we polled are getting more optimistic about the economy too. Only 5% of respondents have raised their recession expectations relative to their baseline from before the December Fed meeting. Nearly 70% think real GDP growth will be in-line or beat expectations this year too. Our view is a turn in sentiment will help contribute to an internal rotation (along with data), bringing laggards more in-line with the economic Growth regime, like we saw yesterday. Labor market data confirming our view is important.
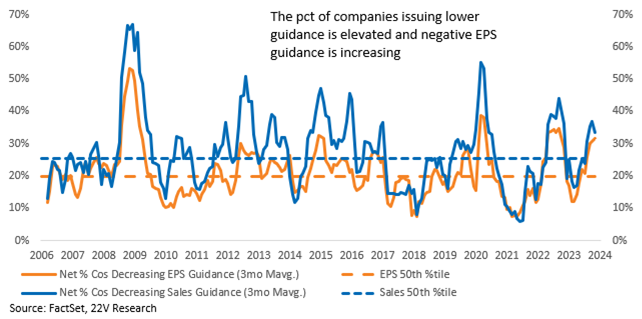
Earnings Hiccup: Guidance remains poor. Net negative sales and earnings guidance levels are at the high end of their normal range and negative EPS guidance is moving higher. Index growth is expected to accelerate into the back half of the year, and weak guidance puts that at risk. Margin sentiment readings are still VERY high but are rolling over some too. We expect upward revisions to 2024 EPS estimates, in part due to a strong 4Q season that leaves the level of EPS and margins higher than consensus. Earnings need to grow less in 2024 to reach >$240 if final 2023 numbers are $218+ instead of the $216 current expected. What that means is earnings are a support now, but we need to keep a close eye on guidance and sentiment shifts.
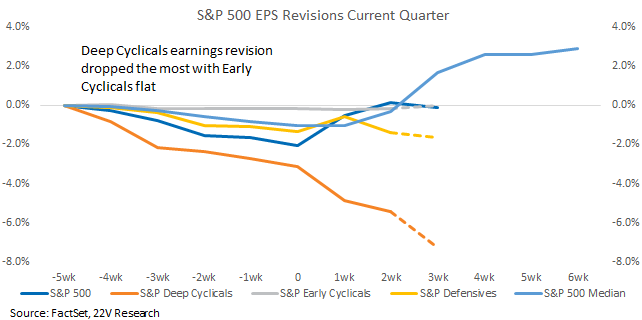
FYI Deep Cyclical revisions are by far the weakest. When revisions are atypically negative, it can signal a problem in the sector/group rather than a larger rebound. The bar for Deep Cyclicals to recover beyond a rebound is high.
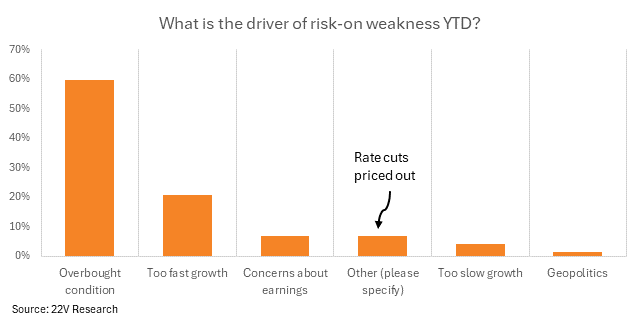
Other Factor Commentary: Momentum, Low Vol, EPS Momentum, and Realized Growth, the four best factors YTD, and all fell last week. Earnings Turbulence and Liquidity, the two worst factors, rose. Our survey work indicates the majority of investors think the weakness to start the year was due to overbought conditions, which have been worked down over the past few weeks. The data has supported a risk on rotation as well.