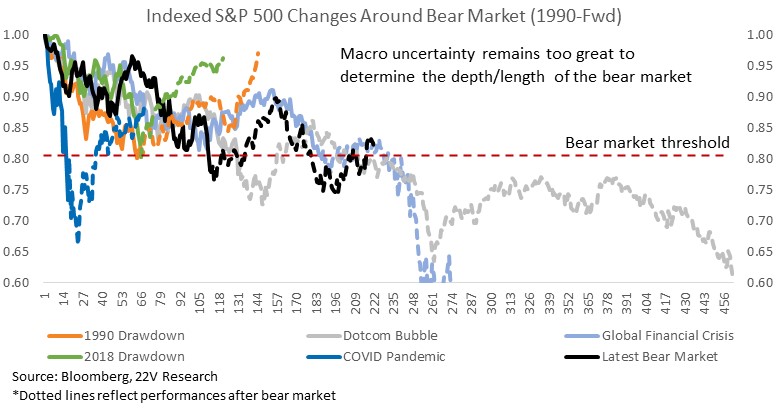
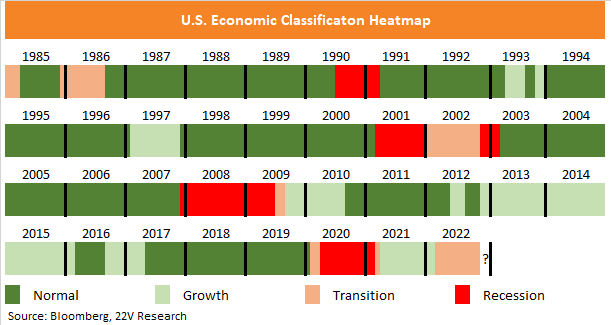
We updated the MRC today with month-end data from November. For the 9th consecutive month, the macro regime is classified as “Transition”, which basically means a period of slow growth with no clear signs of collapse OR reacceleration. The last time a transition lasted this long was during the TMT bubble burst, which is also one of the last times a bear market has lasted as long as the current one. It remains too early to call the end of the bear market.
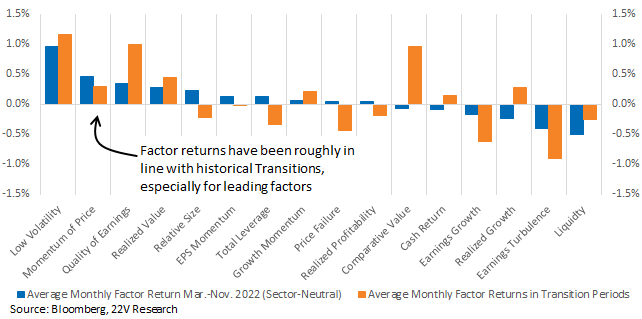
The stable regime backdrop has helped reduce equity volatility and correlations but has prevented clear factor trends from taking hold. Since March, average monthly factor returns have been roughly in line with what we have seen during historical Transition periods. Low Volatility, Momentum, and more recently, Quality have gained. Risk-on factors like Liquidity and Earnings Turbulence have posted the worst returns. Rotations between risk-on (Earnings Turbulence etc.) and risk-off factors (Low Volatility) are likely to continue. Longer-term, we favor Profitable Growth names given the current and expected slowing of economic activity.
Rising of unemployment, falling yields, and a plunge in consumer confidence have marked transitions into previous recessions. Confidence has fallen and yields have started to move lower. BUT labor market demand remains strong, keeping the Urate and inflation from collapsing. The ISM is the macro force most recession-like today. All the internal measures, including Supplier Deliveries, Prices and Backlog of Orders have slowed. Growth is clearly slowing, but the breadth of macro data does not indicate an imminent recession.
Inversion of the yield curve deepened in November, generating recession warning headlines. Historical data in our latest Macro Regime Classification model report (HERE) suggests recession happened ~12.5 months after the first inversion of the yield curve (there is a WIDE range) This is the reason we focus on our more holistic regime model rather than any one or two indicators.
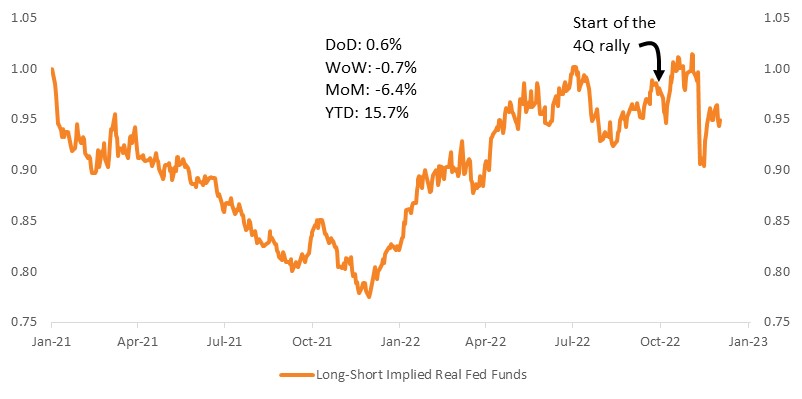
At the end of the report, we focus on the real rates portfolio. A continued Transition period suggests limited upside to real rates and likely further declines in the real rates portfolio.
An Exceptionally Long Economic Transition: The bear market rally continued last week, bringing the 4Q rally to 13.8%. The last time a transition lasted this long was during the TMT bubble burst, which is also one of the last times a bear market has lasted as long as the current one. The economic path forward remains uncertain, and investors the Strategy team surveyed are worried about a retest of the S&P low sometime in 1Q. It remains too early to call the end of the bear market.
Macro uncertainty and volatility have eased a bit, which is reflected in the stability of our Macro Regime Classification (MRC) model. We updated the MRC today with month-end data from November. For the 9th consecutive month, the macro regime is classified as “Transition”, which basically means a period of slow growth with no clear signs of collapse OR reacceleration. That stability has helped reduce equity volatility and correlations but has prevented clear factor trends from taking hold. Internals continue to rotate between risk-on/off factors, and Value and Growth.
Since March, average monthly factor returns have been roughly in line with what we have seen during historical Transition periods. Low Volatility, Momentum, and more recently, Quality have gained. Risk-on factors like Liquidity and Earnings Turbulence have posted the worst returns. We expect the market will remain range bound (3800-4200) into 1Q, and the economic backdrop looks stuck in Transition (more on that below). So, rotations between risk-on (Earnings Turbulence, etc.) and risk-off factors (Low Volatility) are likely to continue. Longer-term, we favor Profitable Growth names given the current and expected slowing of economic activity.

Rising of unemployment, falling yields, and a plunge in consumer confidence have marked transitions into previous recessions. Confidence has fallen, yields have started to move lower, and recently, yield curves have been inverted. But, labor market demand remains strong, keeping unemployment low and wage growth firm. A steady decline in yields or a strong uptick in unemployment would tip the model into recession. The other factor keeping the MRC model from shifting into recession is inflation. Inflation tends to fall sharply as recessions get underway.
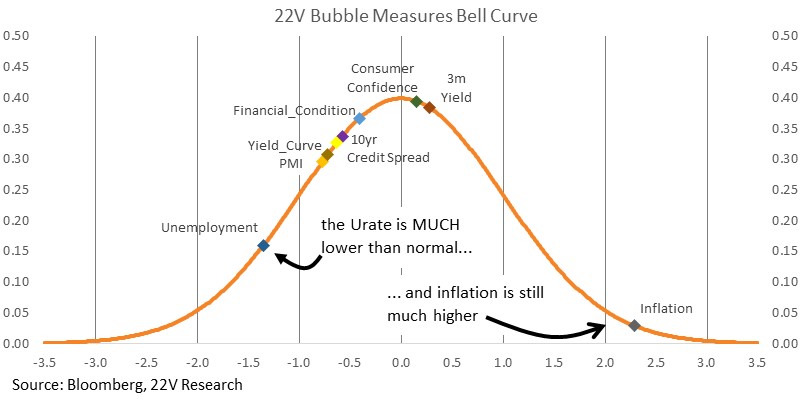
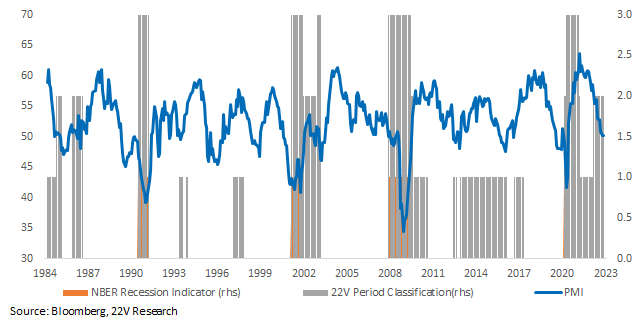
Some readings are already in recession ranges. The ISM is the macro force most recession-like today. All the internal measures, including Supplier Deliveries, Prices and Backlog of Orders have slowed as mentioned in Strategy report (HERE), reflecting the slowing of economic growth. The NY Fed Weekly Economic Index, which is a higher frequent reading for demand changes, has also been trending lower. Growth is clearly slowing, but the breadth of macro data does not indicate an imminent recession.
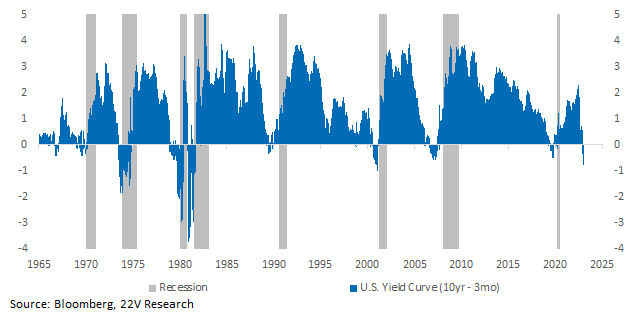
Inversion of the yield curve deepened in November, generating recession warning headlines. Historical data in our latest Macro Regime Classification model report (HERE) suggests recession happened ~12.5 months after the first inversion of the yield curve (there is a WIDE range), while the deepness of the yield curve inversion does NOT correlate with the deepness of recessions. This is the reason we focus on our more holistic regime model rather than any one or two indicators.
Expected Rates Opportunities: In 4Q, the near-term Eurodollar curve has moved higher while longer-dated expectations have declined. That reflects increased near-term rate hike expectations, but a medium-term slowdown that reduces the level of rates. Slower growth as inflation and economic indicators decline are consistent with that long-term view. Interestingly, the strong payroll report caused little reaction in the front end of the Eurodollar curve, which is consistent with a Fed is at least willing to wait for more data before setting a higher rate path.
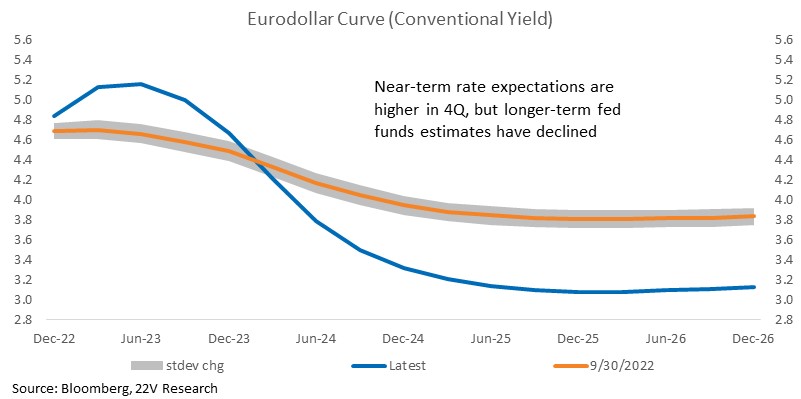
Changes in implied real rates have been an important driving force (along with financial conditions and real yields) this year as investors discount the impact of the rate hike cycle. Our long-short implied real rates portfolio has been volatile recently but is down about -3% in 4Q. Data have been mixed (weak ISM, strong payroll), but near-term rate hikes have been stable recently and longer-term (2yr out) rate expectations have fallen a full point over the past month. Easing inflation trends and slowing economic activity indicate the path of rate expectations will be flat to down over the coming months.
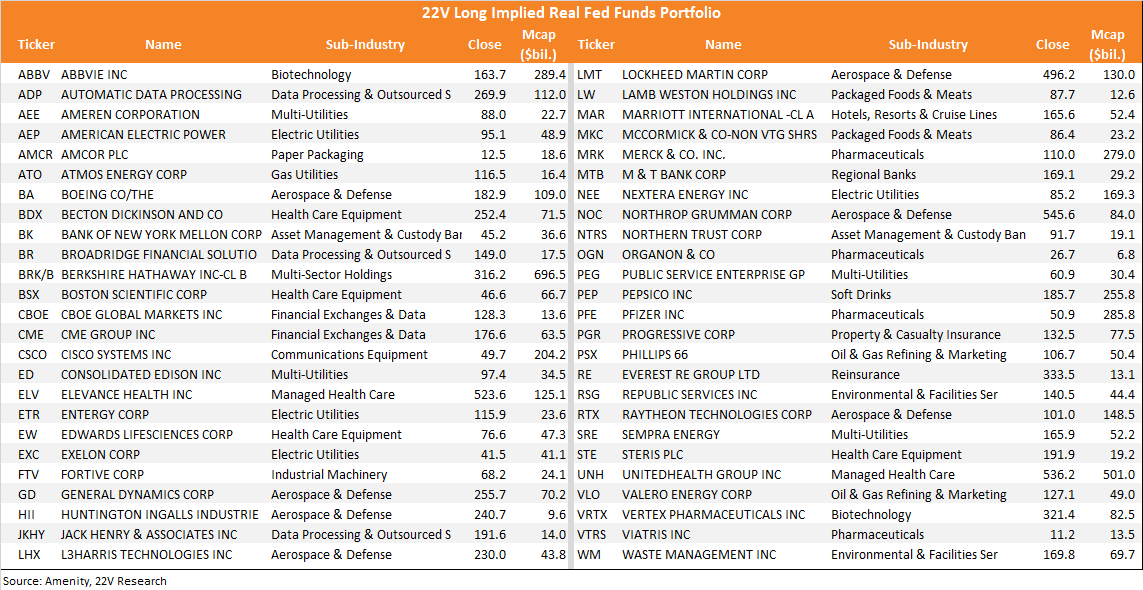
Below are the current constituents of the long side of our real rates portfolio. These are stocks that would struggle if rate expectations remain biased lower, as we expect.
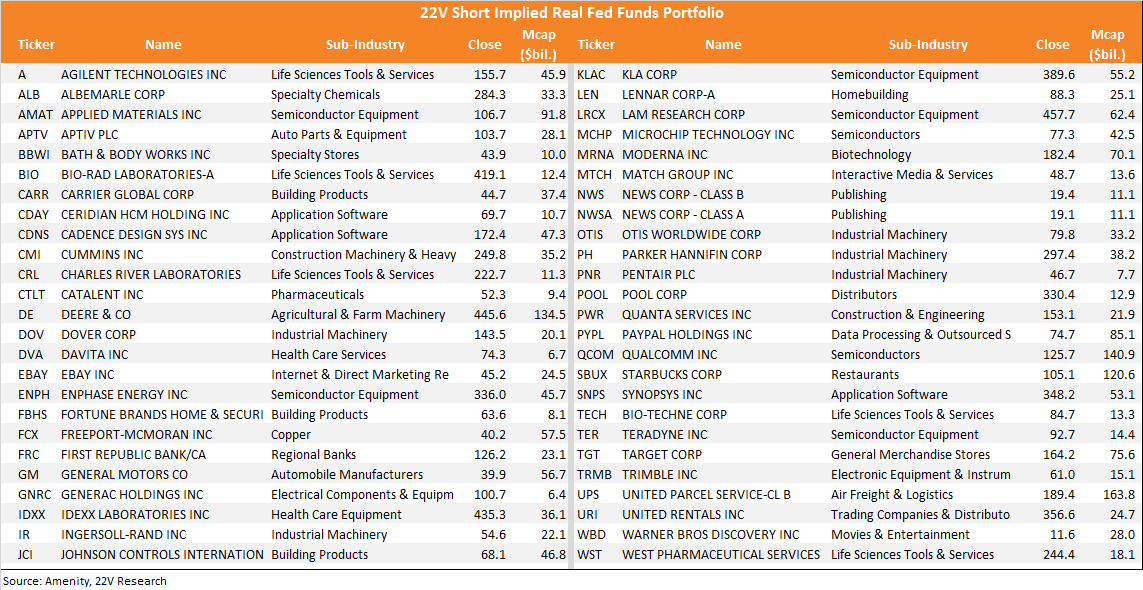
The basket below is the short end of the real rates portfolio. If the transition period continues, these names should continue to perform well. The biggest risk to these stocks is an acceleration of growth that forces the Fed to tighten policy further than is currently expected.