Summary: Ahead of payrolls, inflation expectations were low, JOLTS data showed some loosening of the labor market (openings declined significantly), claims increased and the NY Fed Weekly Economic index declined again, so the case for a bear market rally in a strong seasonal period was starting to make sense. Then payrolls hit. And although the jobs report was roughly in-line with consensus, the decline in the unemployment rate reinforced the main macro story/overhang. The labor market is too tight, that tightness is the source of underlying inflation, and it must be forced to ease even if that involves higher recession risk. The services ISM reinforced that same theme. Not so coincidently, bond yields and Fed Fund futures bottomed on the services ISM data (Wednesday) and moved straight up the rest of the week.
Bottom line, despite some tentative signs of labor market cooling (JOLTS in particular) and some easing of demand growth (see the NY fed Weekly), investors continue to fear a service economy that is too hot relative to a tight labor supply. CPI could alleviate some of those fears this coming Thursday (supporting another bounce in equities), and we have a high conviction that economic growth will slow much more quickly starting now. The trend has turned EVERYWHERE, but services demand is still too strong at the same time financial conditions are tight.
Two Types of Pivots. One Supports a Possible Equity Bounce. The Important Pivot is Far Away: Our economist Gerard (who has been correct on rents and inflation generally. So he has been hawkish) has been arguing there may be a pivot in the Fed’s rhetoric around the funds rate as easy disinflation (more HERE) takes hold. This will be a less bad outcome for equities and why we think a 4Q bear market rally will happen. Also, the Fed is likely past “peak bravado” regarding the instrument path. Their claim that they will not react to a financial accident or that they know what the funds rate must do or not do in 2023 is obvious nonsense as shocks abound. In terms of the Fed’s objectives for economic growth, there is probably no pivot coming. Expect the Fed to stop raising rates around 4.5% (a pivot on the policy tool, which could cause some short-term equity market relief) but NO PIVOT on the policy objective. The NY Fed Weekly Economic Index needs to fall to ~1% for an extended period before the Fed pivots its objective to delivering unchanged growth instead of slower growth. When that shift happens (maybe some point next year), a long call on equities will be more interesting. For now, minor pivots = bear market bounces at best. Risk-on factors will lead in bear market rallies and low vol will underperform.
An Interesting Divergence Has Implications: Inflation expectations have rebounded but are well off their recent highs even as TIPS yields have moved higher. Put differently, the cost of hedging out inflation has increased. As Gerard pointed out (HERE), this creates an opportunity to be LONG TIPS. If TIPS yields come in, which we expect over the coming months, a short-term typical risk on rally should unfold.
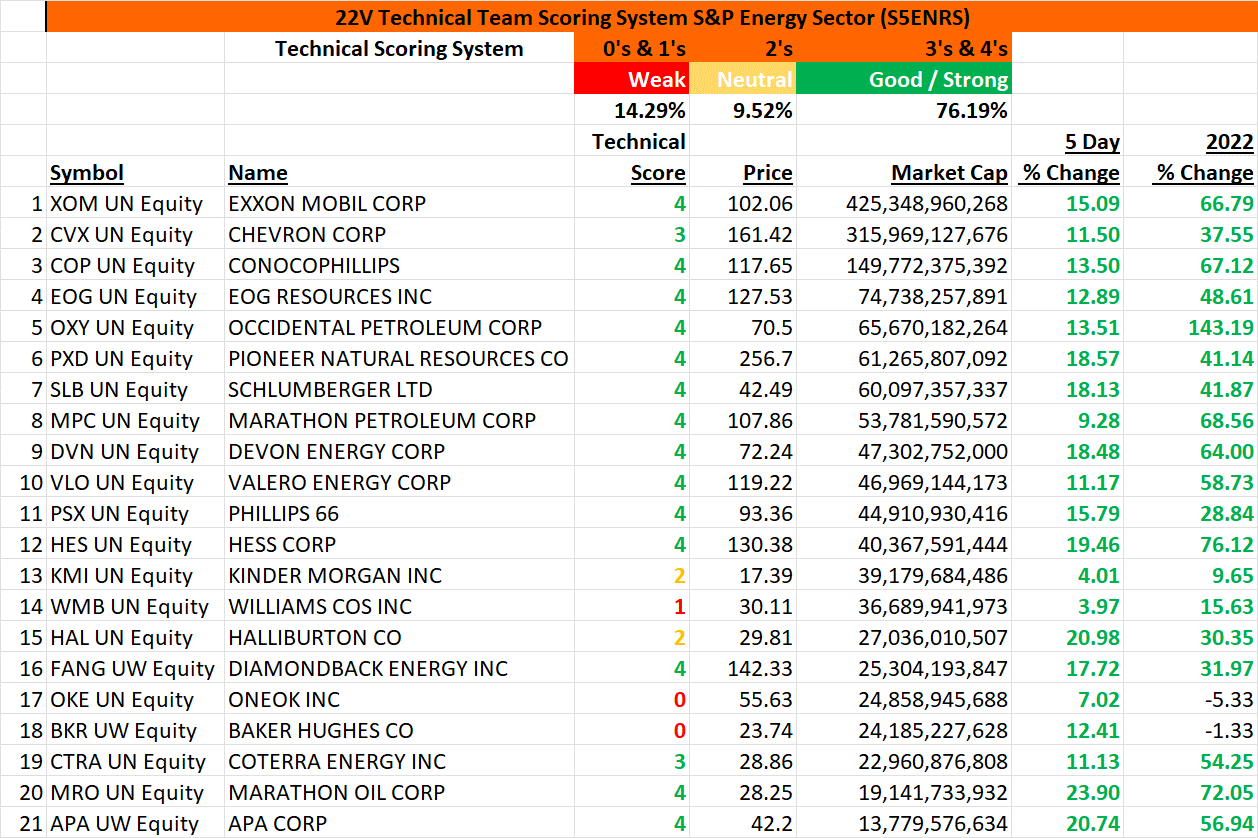
London Trip Notes: The vast majority of investors favored Energy. That makes sense as Energy closely tracks changes in oil prices, and oil prices have been less influenced, relative to other commodity prices, by global growth trends. OPEC flooring the price as Europe moved to implement price caps were consistently cited as reason to be long energy. If China reopens more quickly, there is asymmetric upside. We disagree with the China point (see below), but have sympathy for the idea that Energy will be a place to hide in 4Q. Especially if investors get confident the Fed will pause the tightening cycle at 4.5%. We have been fading Energy of late, but being more long Energy than short makes sense in 4Q. A list of John Roque’s favorite Energy names to be long is in this report. We also hammered home the idea in meetings that Cyclicals look attractive relative to Defensives REGARDLESS of the backdrop. Defensive dividend yields are well below 2yr rates (so not Defensive) and have historically high absolute and relative PEs. Defensives have underperformed over the past two weeks despite a down market.
Michael Hirson, Our New China Analyst Launched: Michael is deeply skeptical that Xi will pivot away from COVID zero after the party congress. The pivot away from zero-Covid will likely begin only after the March 2023 NPC meeting and be very gradual, with containment policies staying tight throughout next year. The key reasons are as follows: 1) Xi and the CCP have cast China’s success in limiting deaths from Covid as proof of the superiority of China’s governance system over the West’s and a testament to Xi’s leadership. Xi and the CCP leadership will view embarrassing setbacks — such as a surge in deaths —as damaging to their longer-term political legitimacy. 2) China’s leadership transition is not complete until the March NPC meeting when key government positions are announced. Until then, the policy will be in stasis, with new leaders not yet fully in their jobs. 3) China doesn’t have the hospital capacity or immunization levels to make a smooth transition happen. The risk of a surge in deaths is high. many citizens will likely be deeply fearful of catching Covid, both in terms of illness and the risk of forced quarantine/hospitalization. Simply put, a sudden surge in cases, without sufficient preparation and communication, could easily create its own economic and political shock from a panicked population — one that China’s leadership will be keen to avoid.
All the above suggests that depending on a China reopening to drive commodity prices higher is a mistake. Oil might still move up for other reasons, but China’s reopening isn’t likely to be a driver.
Full report below…
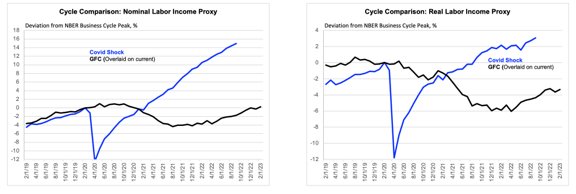
Indicators & Themes: The jobs report was roughly in-line with consensus and with the main macro story is intact. The labor market is too tight, that tightness is the source of underlying inflation pressures and must be forced to ease even if that involves higher recession risk. Nominal labor income growth has momentum, typically, and it was predictable that the real measure would hook higher as soon as headline inflation cooled off.
Source: BEA, FH calculations
Nominal data are actual to September. The headline PCE deflator is estimated up 0.15% for that month.
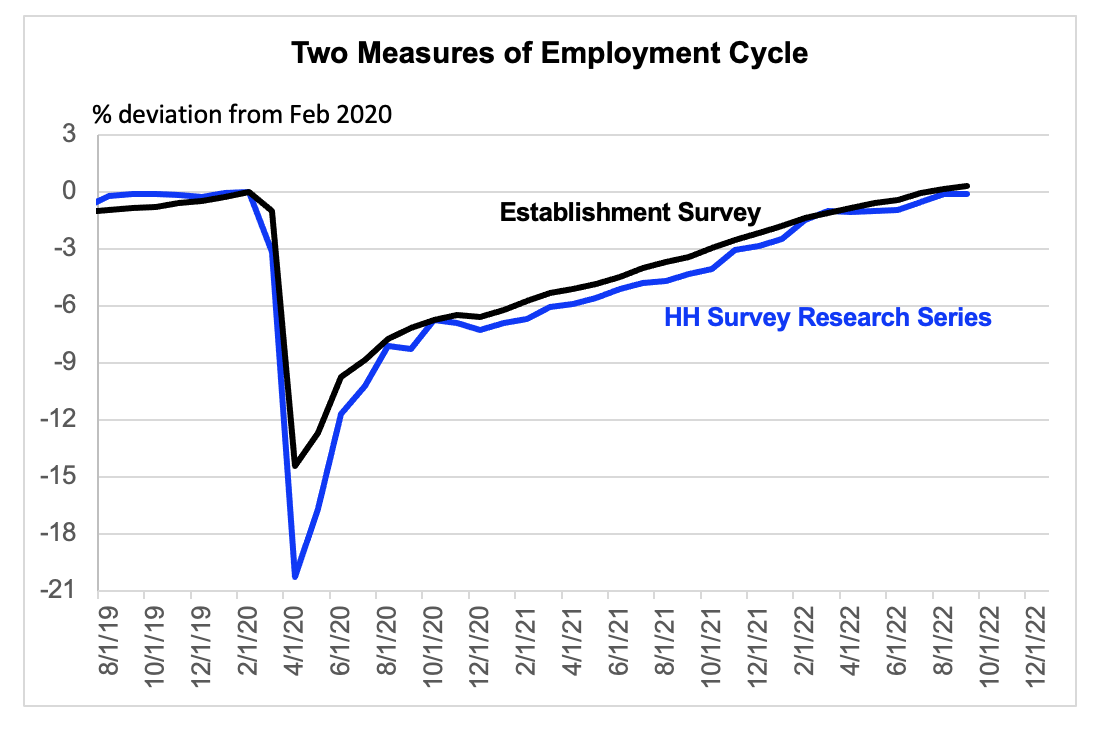
One element of softness in the report was the weak gain in the so-called “research series” measure of employment growth which places data from the household survey on the same definitional footing as the headline establishment survey figure, by excluding farmers and double counting, multiple job holders. It was up only 12k, which may impress some because it is not affected by the birth/death model which can cause trouble at turning points. But no meaningful gap has accumulated over the past several months. This is just a minor divergence.
Nominal data are actual to September. The headline PCE deflator is estimated up 0.15% for that month.
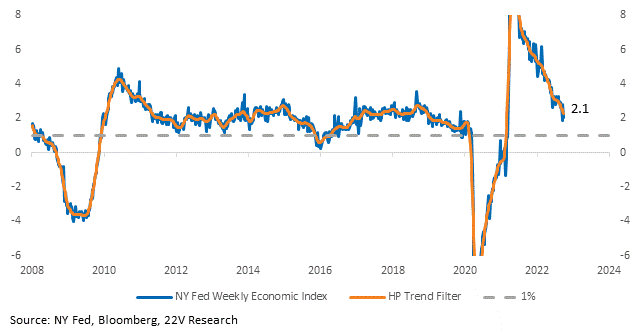
Some Signs of Slowing: Gerard has been arguing there may be a pivot soon in terms of the Fed’s rhetoric around the fed funds rate as easy disinflation (more HERE) takes hold. But in terms of the Fed’s objectives for economic growth, there is probably no pivot coming soon. Yesterday the WEI dropped from 2.81 to 2.07. The trend is lower, which is encouraging, but we need to see demand growth cool to ~1% to get comfortable with a Fed objective pivot to delivering unchanged growth instead of slower growth.
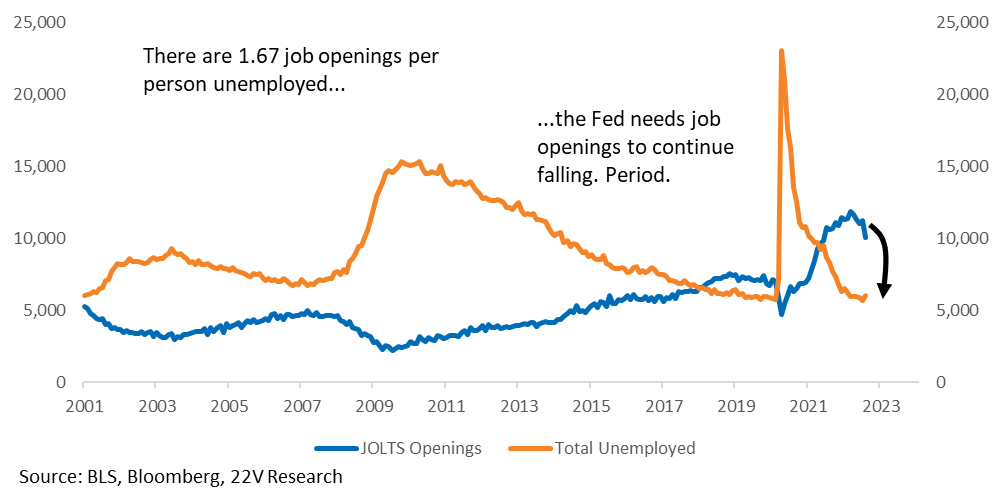
The vacancy rate (jobs per unemployed) dropped significantly in August (JOLTS data is delayed). It’s still too high, but trending in the right direction. This is another weaker but not too weak data point
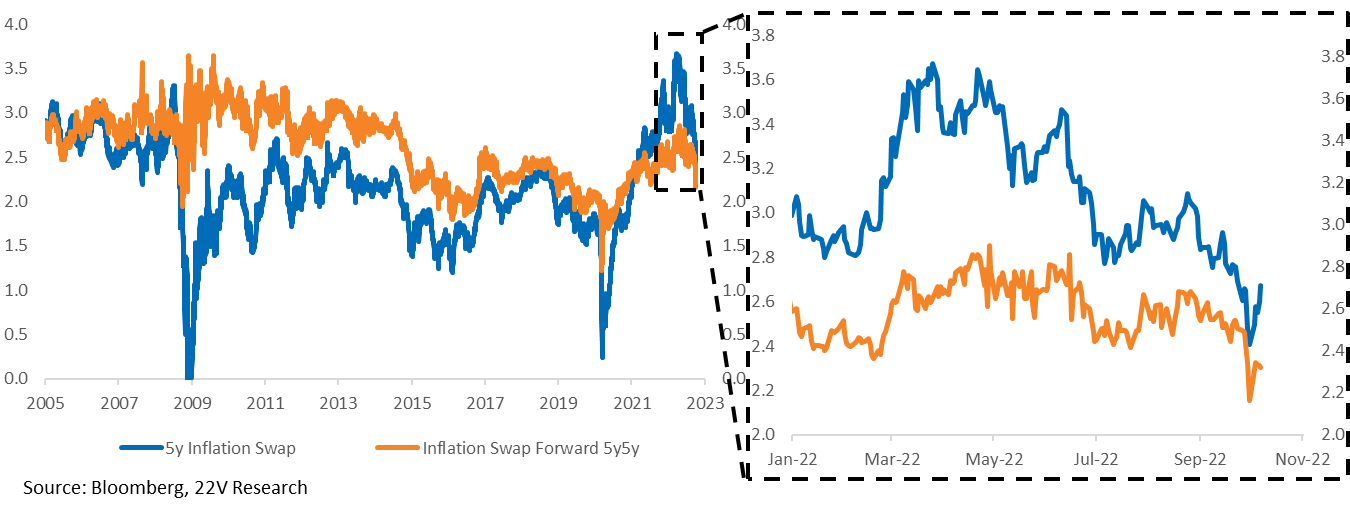
Investors are increasingly pricing in a quick slowdown in economic growth as financial conditions have tightened significantly. Despite actual economic growth still running above trend (especially services). Inflation expectations have rebounded some but remain well below where they were a few months ago.
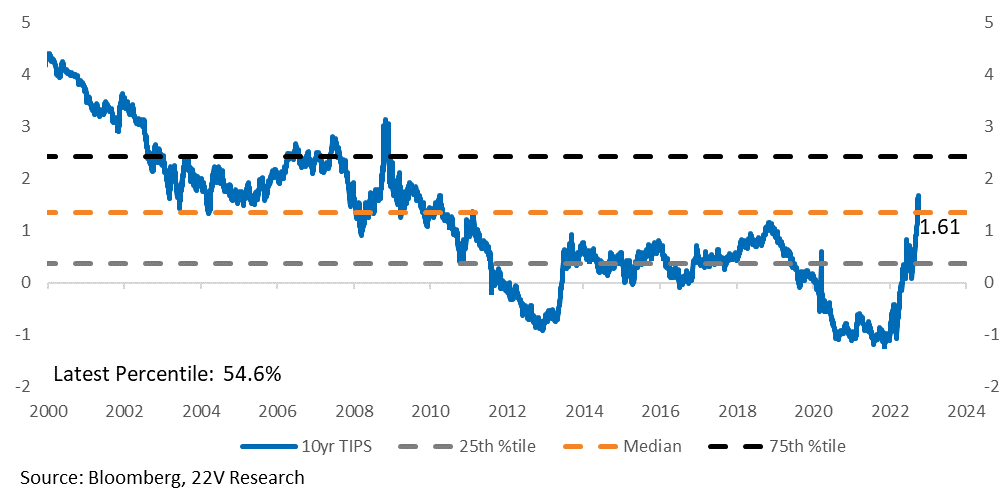
Interestingly, TIPS yields have moved higher. Put differently, the cost of hedging out inflation has increased. As Gerard pointed out last week (HERE), that created an opportunity to be LONG TIPS. Real rates would decline if Gerard is correct. The very low savings rate, the reversal in the credit impulse (tightening of financial conditions enhances this), and the recognition that the Fed will not focus only on inflation forever (unemployment will be a consideration again) creates some opportunity to be long TIPS now. And we would argue long bonds in general. The bottom line, the cost of inflation compensation has gone up.
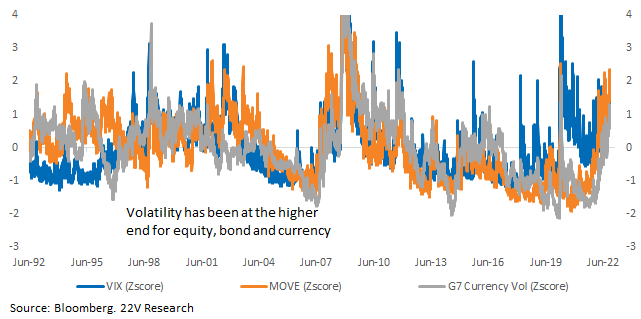
We are heading into a strong seasonal period for equities with unusually high volatility (deservedly) across asset classes with washed-out positioning. Something to keep in mind from a risk management point of view. Pressing shorts now could be difficult. And as we have noted a few times, Defensives are not offering much Defense now (HERE). Vol probably comes down as economic growth slows down, reducing monetary policy uncertainty.
Defensives not defensive and relatively expensive. Yields on Defensive sectors are well below 2yr rates.
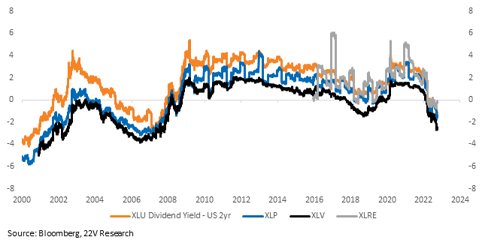
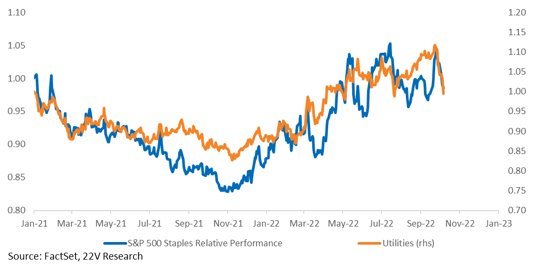
As of Thursday, relative to the S&P, Staples is down 4.2% in the last two weeks while Utilities are down 10.6%.
If We Rally Focus on Risk-On Factors: Bear market rallies largely look the same, regardless of magnitude. Risk factors (Earnings Turbulence) rally while risk off (Low Vol) reverse lower. The same pattern holds during the first 10% of rallies as during the next 10%, and both are similar to bear market bottoms. The point being, factor internals will be coincident with, not an indicator of an eventual bottom.

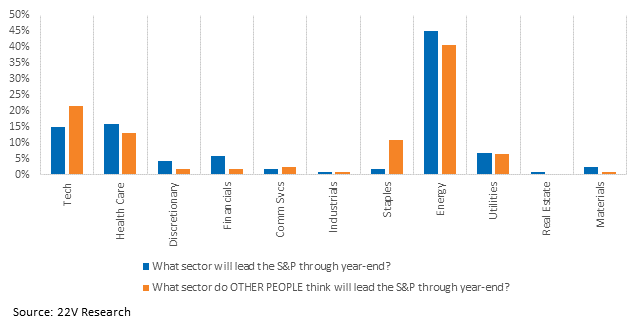
A plurality of investors expect Energy to lead through year-end. That makes some sense as Energy is largely isolated from general macro concerns, closely tracking changes in oil prices, which have moved independently of concerns about global growth. Health Care and Tech were the next two most popular choices.
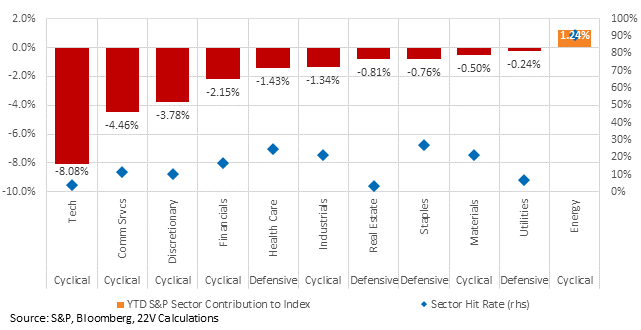
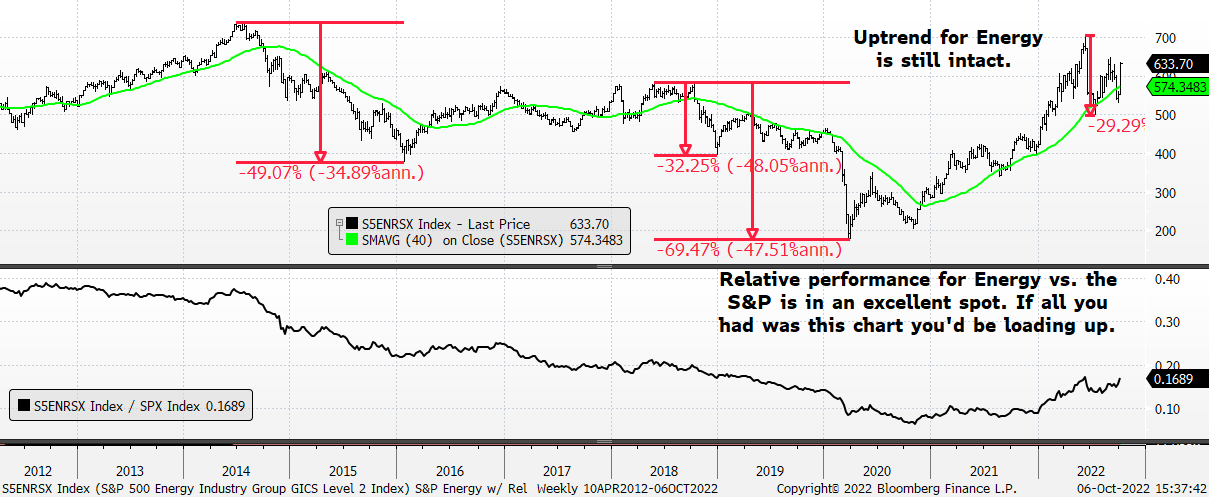
Energy is less than 3% of the S&P. Even after Energy’s extraordinary year, rising nearly 50% YTD, it has only contributed +1.2pp to the overall return of the index. In contrast, Tech’s -28% return has lopped off -8pp. If Energy rallies, it won’t be much help to equities broadly. But if investors are also right about Tech and Health Care, the next two most popular choices for sector leadership and the two biggest sectors, the index will be pulled higher.
Concerning Energy and per John Roque, there’s no denying the continued chutzpah and trend-strength for the S&P Energy Industry Group. However, what is perhaps its most defining, and impressive characteristic is its Relative Strength versus the S&P 500 (lower panel). As the annotation in the lower panel suggests, “if all you had was this chart you’d be loading up.”
John’s technical scores for the constituents of the Energy sector are below.
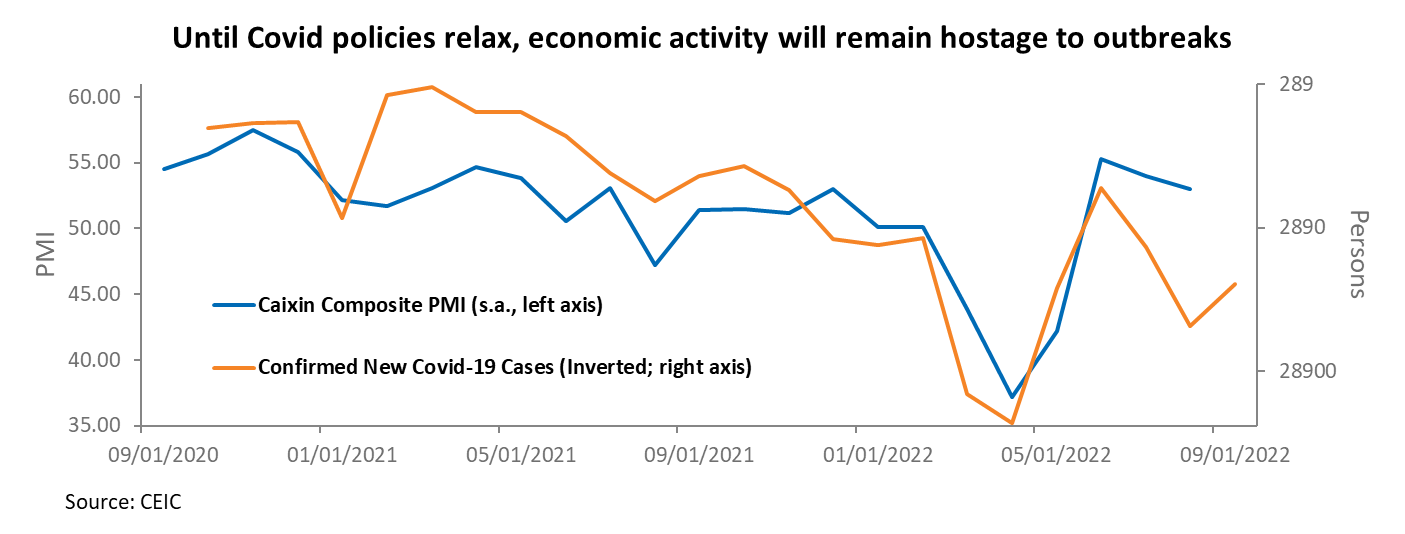
CHINA: These conditions will continue to weigh on the demand side of the economy – especially consumption and services – with the severity of the impact depending on the extent of outbreaks (see chart below). Notwithstanding the hit to global supply chains from Shanghai’s two-month lockdown earlier this year, the rollout of mass-testing should enable local governments to avoid major supply-side disruptions. In short, the net impact will continue to be disinflationary.
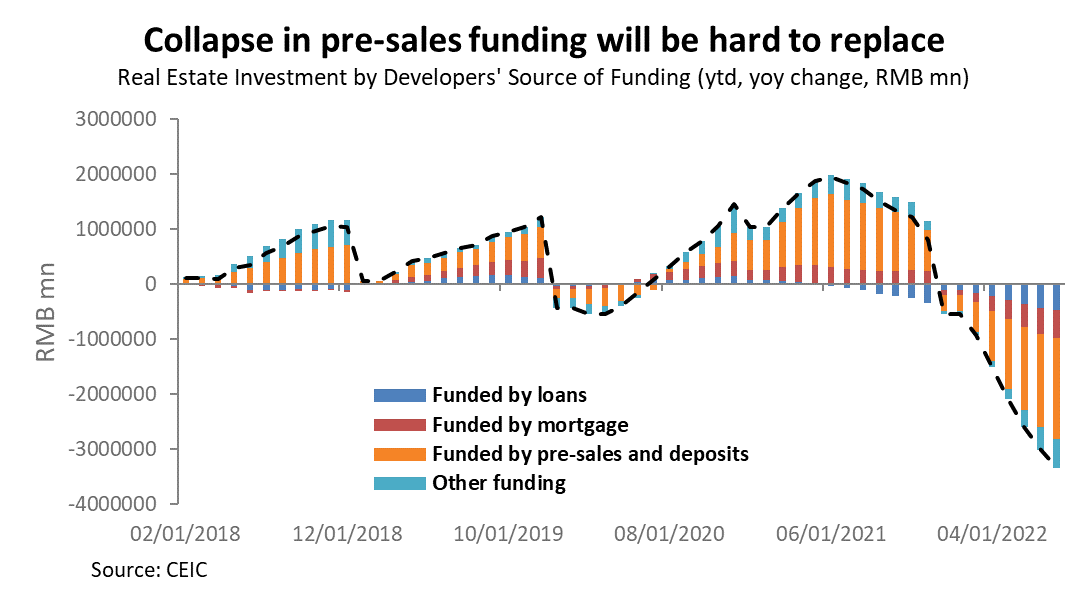
The period from now through March will see additional incremental loosening measures that muddle-through in the hope of a recovery next year. Even after property sales eventually rebound, property investment will lag for several more quarters as developers use sales proceeds to pay back debt before making new investments. When an investment does pick up it will be with a fundamentally different model, with a much larger role for state-owned developers and slower growth, due not only to tighter debt limits but to reduced housing demand from China’s worsening demographics.