SUMMARY: The impact on financial markets was not just about positioning into the numbers and “offsides” positioning being reversed after core CPI came in at 6.3% (6.1% expected). That miss was within the normal range of beats or misses historically. The CPI report miss was broad-based and ugly, which explains the extreme reaction by risk assets. It was much more about the internals showing an acceleration in just about EVERY IMPORTANT core inflation metric.
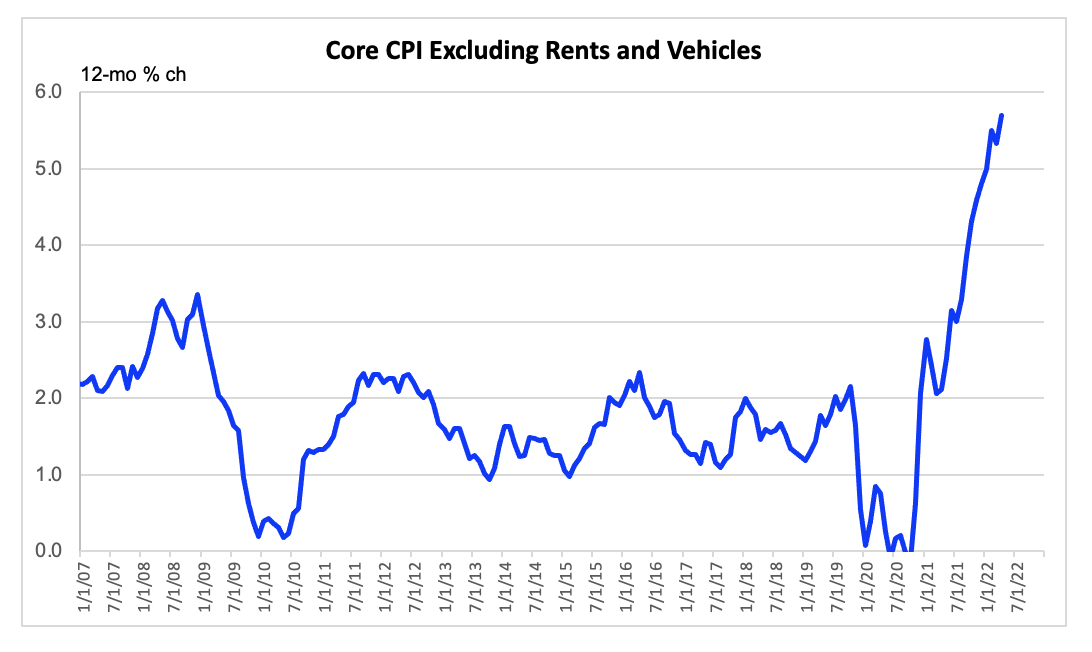
The core CPI ex rents and autos (chart below), an obvious core to calculate given the report, , still looks very strong.

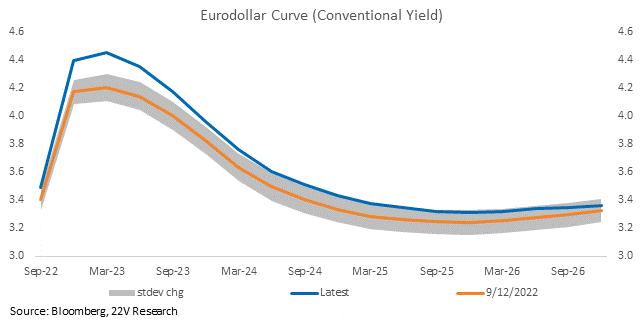
The immediate realization from financial markets is that the labor market appears to have pushed through full employment and demand growth is still too firm. To correct that imbalance, the Fed will have to deliver a prolonged period of below-trend real demand growth to force a meaningful easing of the labor market. The broad-based increase in core CPI increases the urgency for the Fed to slow demand growth (and earnings). The Fed fund futures curve picked up on this immediately shifted meaningfully higher. Terminal rate pricing shows a ~4.3% peak funds rate and 40% odds of 100bp hike next week.
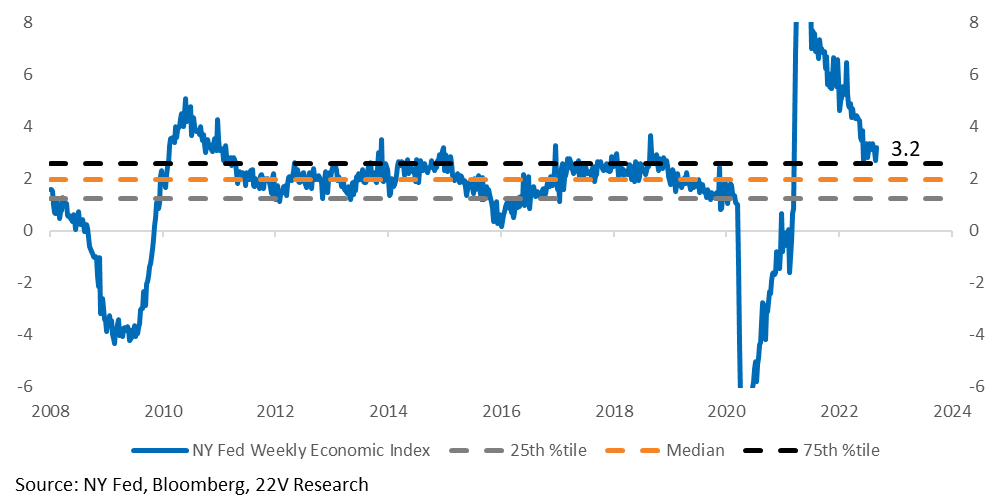
The NY Fed’s Weekly Economic Index (WEI) is indicating underlying demand growth of roughly 3.2%. Well above the Fed’s estimate of 1.8% trend growth. If the WEI stays at roughly these levels, inflation will remain too hot for the Fed. For investors to embrace the “easy disinflation” idea, that we thought was possible and could lead to a sharp 4Q rally (looks very wrong now), they needed some confidence core PCE will fall into a 3-3.5% range in 1Q23, and that demand growth would remain firm through 4Q. That is a much tougher call now and doesn’t seem like something investors can rely on. Unless services spending slows more aggressively. That is not happening yet unfortunately. Back to focusing on stocks that benefit from tighter financial conditions.
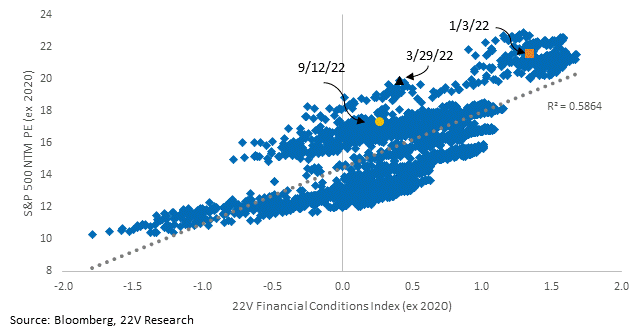
We are still comfortable with the 3800-4200 range. Financial conditions are biased to tighten, but PEs are much lower now vs previous financial conditions tightening periods. And the reason the Fed needs to tighten more is because growth/inflation is too hot, which means earnings should be ok. Investors are likely discounting much weaker EPS, but those negative outcomes are largely priced in (HERE). A much more aggressive Fed does increase the odds of a harder economic landing though.
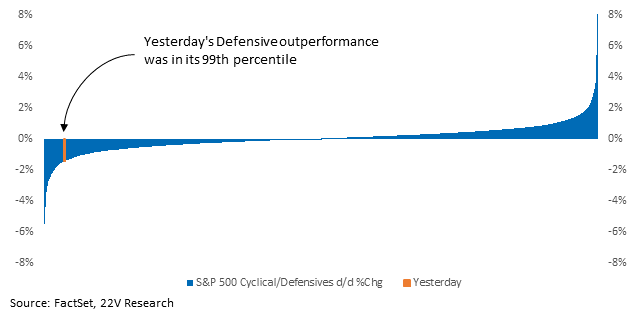
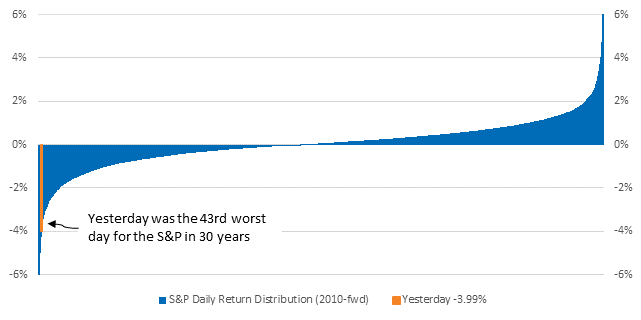
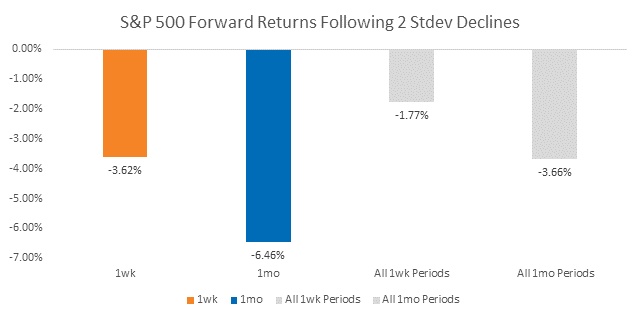
Yesterday was the 43rd worse day in the S&P since 1990. Forward returns are better than normal following large moves, but vol is higher and when the forward return is negative, it’s usually way worse than normal. The move yesterday does not justify an obvious rebound.
Full report below…
MARKET VIEWS: As Gerard pointed out yesterday, the core CPI ex rents and autos (chart below), an obvious core to calculate on a day like today, still looks very strong. This fits with the well discussed view that the CPI report was broad based and ugly. The Bottom line, the impact on financial markets was not just about positioning into the number and that “offsides” positioning being reversed because core CPI came in at 6.3% vs 6.1% expected, which was within the normal range of beats or misses historically. It was much more about the internals showing an acceleration in just about EVERY IMPORTANT core inflation metric.
The immediate realization from financial markets is that the labor market appears to have pushed through full employment and demand growth is still too firm. To correct that imbalance, the Fed will have to deliver a prolonged period of below-trend real demand growth to force a meaningful easing within the labor market. The broad-based increase in core CPI inputs increases the urgency for the Fed to slow demand growth (and earnings). The Fed fund futures curve picked up on this immediately shifted meaningfully higher. Terminal rate pricing shows a 4.3%ish peak fed funds rate and ~40% odds of 100bp hike next week.
As we have been harping on, demand growth is still above trend. The NY Fed’s Weekly Economic Index (WEI) is indicating underlying demand growth of roughly 3.2%. Well above the Fed’s estimate of 1.8% trend growth. If the WEI stays at roughly these levels, inflation will remain too hot for the Fed. For investors to embrace the “easy disinflation” call, they needed some confidence that Core PCE would fall to the roughly 3-3.5% range in 1Q23 and demand growth would still be ok through 4Q. That is a much tougher call now and doesn’t seem like investors can rely on it. Unless the service spending slowdown becomes much more pronounced. That is not happening yet unfortunately.
We are still comfortable with the 3800-4200 range. Financial conditions are biased to tighten, but PE are much lower now vs previous financial conditions tightening periods. And the reason the Fed needs to tighten more because growth / inflation is too hot, which means earnings should be ok. Investors are likely discounting much weaker EPS, but those negative outcomes are largely priced in (HERE). A much more aggressive Fed does increase the odds of a harder economic landing though.
Some Stats: Yesterday was the 43rd worse day in the S&P since 1990. Forward returns are better than normal following large moves, but the vol is high and when the forward return is negative, it’s usually way worse than normal.
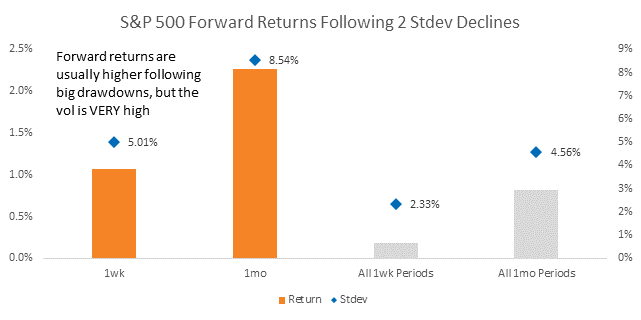
In periods following large drawdowns that the market doesn’t bounce; returns are much weaker than normal.
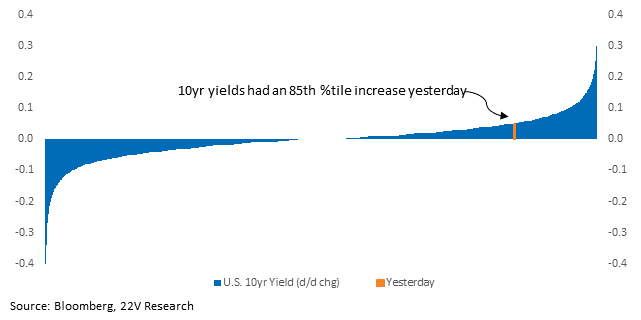
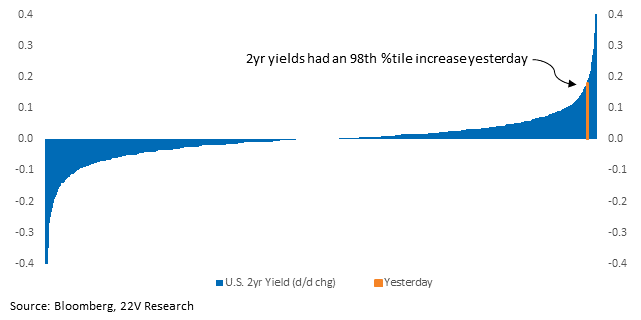
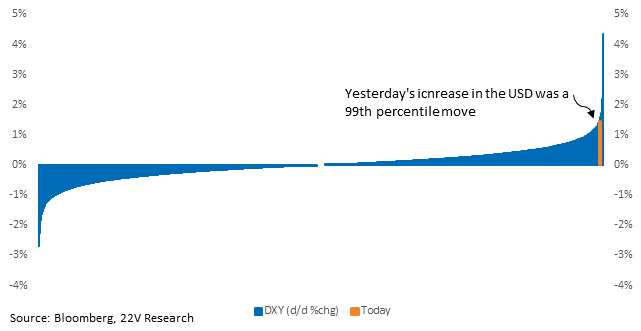
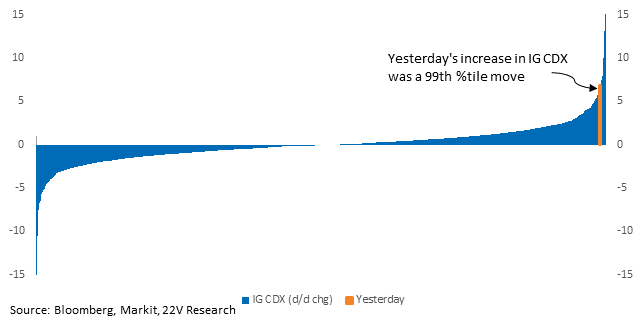
The move in the 10yr yield yesterday was the least dramatic of the indicators we look at. That makes sense, yesterday just increased the urgency for the Fed to slow growth and 10yr yields reflected that possibility, which explains the sharp yield curve flattening. 2yr yields, USD, Stocks, Defensive sectors and Credit spreads all had extreme moves historically.