Don’t Worry About the Savings Rate
- Seemingly almost every month, there are number of worried headlines around a low and/or declining savings rate and how that means that consumptions is likely to slow appreciably in the ambiguous future.
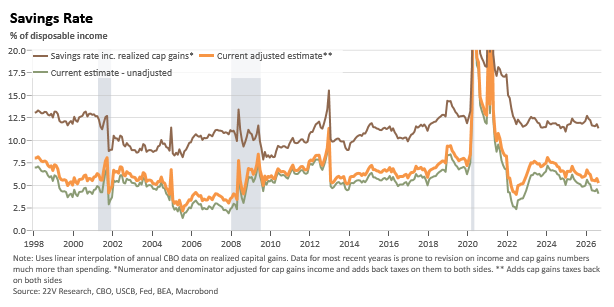
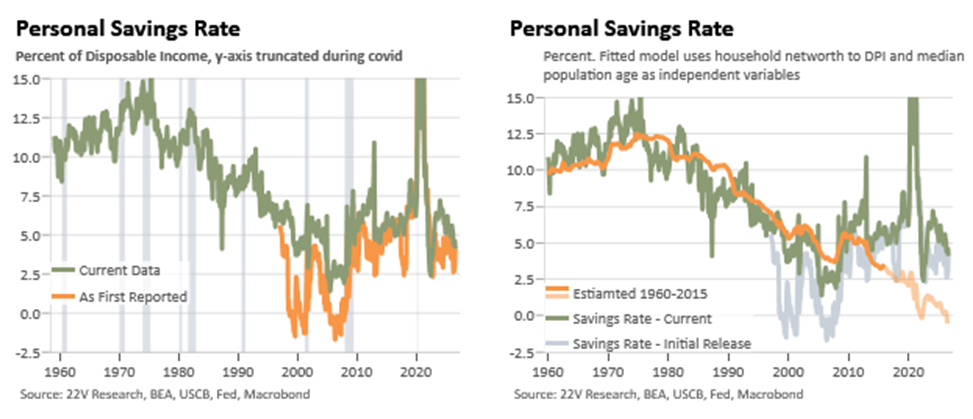
- Recent revisions have pulled the savings rate higher, from 2.8% to 4.2% in Q2, nullifying much of this concern and emphasizing the unreliability of the savings rate as a real-time forecasting tool.
- The observed savings rate suffers from several key flaws for use by policy makers and market participants. It is not a cashflow measure that maps to direct household stresses; it is consistently revised upwards; demographics and net worth would suggest a falling savings rate now, so we’re actually be positively surprised; and its treatments of capital gains and associated taxes are imperfect, especially in an era where cash returns have shifted away dividends to buybacks.
- If there are worries worth having about underlying consumption growth (i.e. ex. tariffs and tax cuts) it will be because current and prospective labor market prospects are deteriorating, credit conditions are tightening, or household balance sheets have weakened; no savings rate required.
- Current, appropriately adjusted, measures of the savings rate suggest that households remain in a fine position consistent with more reliable credit metrics and the private sector financial balance.
For much of the past few years, the savings rate has been a consistent source of downside pessimism and, implicitly in many macro models, persistently negative forecast errors. These views have largely been premised on some version of the idea that the decreasing household savings rate was too low relative to some norm (equivalently framed as spending was too high relative to income) and that this meant that future consumption needed to notably retrench in order to restore the economy to something closer to equilibrium. As a forecasting model, this has notably struggled given the strength and ‘26H1 further reacceleration of the consumer spending data at the same time as improving consumer credit metrics.
Savings rate-based models have been more and less reliable at various points in time, but in the current moment they seem to really be struggling. It is our view that as monitoring tools they should be dispensed to focus on the credit conditions and delinquencies, HH net worth and lending stats, and the private sector financial balance all of which are closer to being cash flow measures and more cleanly capture stress and vulnerability.
The rest of this note explores the weaknesses of the savings rate as it is commonly used and offers a few extensions of it, which largely counter the recent pessimism it has tended to bring out. First, though a few thoughts on what we think of as better measures to focus on.
What to Watch For Instead of the Savings Rate. The savings rate is seen as a helpful summary statistic of how potentially overexposed consumers are and their vulnerability to retrenchment, whether due to needed savings replenishment or overly optimistic embedded assumptions about the future. Typically the savings rate is used to link forecasts of income and labor data with future consumption. Over time, there will be a link between household income and consumption but assuming a specific equilibrium view without taking into account other factors such as demographics, net worth, and household credit conditions seems fraught. However, as the rest of this note will dive into its theoretical utility and simplicity in a modeling context is often swamped by issues with it in reality.
Rather than relying on the savings rate channel, we would focus on other more reliable metrics which capture much of the same insight about potential consumer vulnerabilities in real-time. The simplest and most useful of these are measures of labor market slack and household incomes; there can be wide degrees of dispersion in these measures but they generally show the same directional trends. Other more finances-related measures include: the overall private sector and household financial balances that measures changes in net asset positions and savings flows; the Fed’s senior loan officer opinion survey (SLOOS); household balance sheet, net worth and borrowing data (inc. credit card and mortgage equity withdrawal); credit card and mortgage delinquency stats (bank and card commentary is very helpful here); and broader financial conditions impulses.
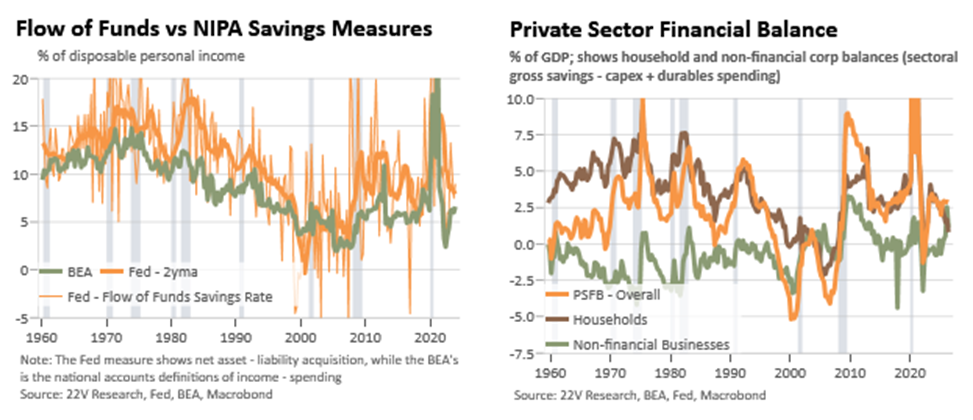
It is Not a Cashflow, Asset Acquisition, or Credit Measure. The savings rate that is reported each month is the difference between the national accounts (GDP, GDI, etc) measures of household consumption and disposable personal income. One of the most obvious flaws with the savings rate is that most observers conflate it with a cashflow related metric that tracks how households actually save their regular income and how constrained they are in meeting regular obligations. Housing is a key example of this as imputed rent cancels out of the savings rate and mortgage interest is deducted like a cash cost, but BEA also deducts about 3% of DPI in non-cash depreciation on owner-occupied homes. A cash-based savings rate would run correspondingly higher over its history, although this gap has been fairly stable over time.
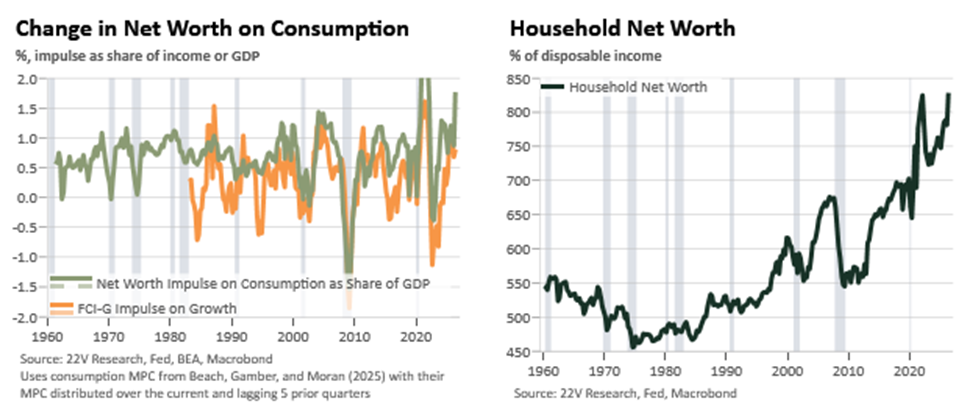
The Fed has similar measures of the savings rate which measures net savings as a function of financial assets acquired less debts taken on in any given period. This measure tends to be more volatile than the BEA’s definition, but it captures the net flow into savings more directly than does the BEA’s measure. Both tell similar secular stories, but the Fed’s has tended to run notably higher on average, particularly in recent years (the Fed’s measure also suffers from ‘reasoning from the residual’ issues as it is a residual of other sectors net savings behavior). The private sector financial balance for the household sector, it expands on the prior measure by including durable goods and their financing, is another related measure has recently been softening although it remains above the 0% threshold that predated the tech bust and GFC. The overall PSFB points to a quite stable and steady set of financial risks. Stability or gradual moves in either direction would not be concerning from these levels, while a sharp move would either suggest retrenchment or potentially unsustainable boom. Household net worth trends are currently very positive as households have been deleveraging for years and their overall balance sheets are as strong as they have ever been; the main non-policy risk to the economy is if corporate earnings decelerations or outright declines pull overall market valuations with them.
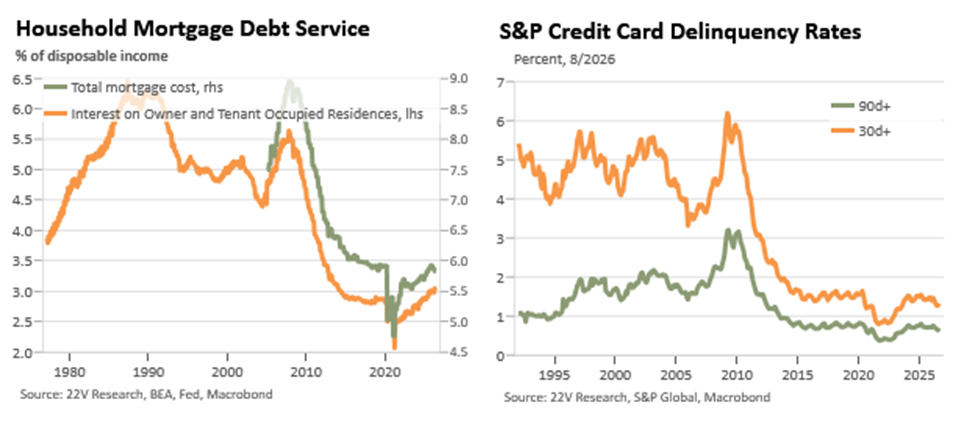
While not directly tied to the savings rate per se, measures of consumer credit delinquency get to the basic question of households’ ability to meet their basic and necessary obligation quite directly. As noted by bank management teams over the past year, consumer delinquencies have been stable or gradually falling despite the war and predating tax refunds this spring (see my ‘25Q4 earnings season wrap-up).
The Savings Rate is Almost Always Revised Up. Over the last 30 years, the savings rate has almost always tended to be revised higher. This is largely the result of increased estimates of income over time. This is particularly true for non-wage income. This effect was credited by the BEA with 2018’s large upward revision to the savings rate due to proprietors non-wage income. The most recent revision higher last week, part of the motivation for this note and flagged by a number of clients, was largely due to increased estimates of interest income. The narrative of a low savings rate over the past few years was largely revised away, even if the current 4-4.5% level is still low by historical standards. Given history, we will largely assume that the data gets revised higher in subsequent updates, further weakening the low-savings narrative.
History Suggests the Current Savings Rate is “Too High.” An aging population would largely be expected to see a lower savings rate as the retirees consumption naturally outweighs their spending habits, in most lifecycle models of consumption. This is particularly true as an increasingly large share of the population moves from recent retirees into their later years when healthcare consumption patterns often spike notably (the roughly 5% of Medicare recipients who die each year account for about 25% of program spending). Increased household net worth should also reduce the desired level of household savings all other things being equal. Crudely fitting the savings rate with the median age of the US population and HH net worth suggests that the savings rate should be close to 0% at the moment.
The surprising point here may just be that the boomer generation has been able to retire with minimal impact on macro savings behavior due to the asset position and strong realized returns over their latter lives (meaning that rising interest and dividend income has offset expected dissaving); these demographic and net worth shifts mean may mean that historic relationships around the savings rate do not currently hold, another important caution in making assumptions based off equilibrium savings assumptions.
Capital Gains Matter. The BEA’s measure of the savings rate has two underlying issues with capital gains taxes, of differing severity. First, and most importantly, the BEA includes capital gains taxes as a tax that counts against disposable personal income but the gains themselves are not counted in income. In recent years this has been over a percentage point of DPI, far from inconsequential when discussing a savings rate around 4-5%. In addition, the shift in corporate behavior from dividends to share buybacks as the primary means of cash flow returns has placed an otherwise uncorrected downward trend in the savings rate since the 1990s.
More debatable, and likely the correct choice, is the exclusion of those realized capital gains from personal income but we should not fully dismiss the signal from this data. Realizations of capital gains tend to run close to roughly 1% of financial and housing assets in recent years, suggesting little cause for a shifting trend beyond the impacts of changes in net worth noted above. Realized gains can also largely be seen as intra-household transfers although that treats households as a fairly monolithic block. Despite being poorly and imprecisely measured in real-time, realized capital gains do finance some of the spending the savings rate already deducts and given their fairly stable recurring nature households ability to draw them down does likely play a role in financial planning decisions.