

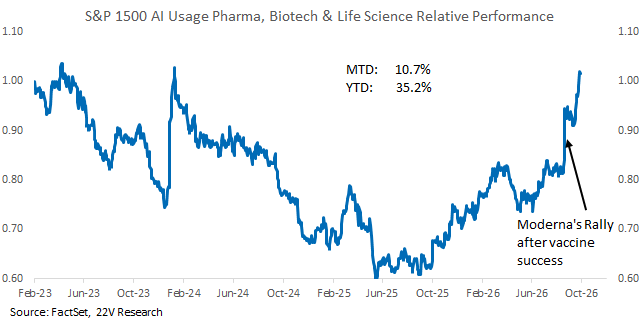
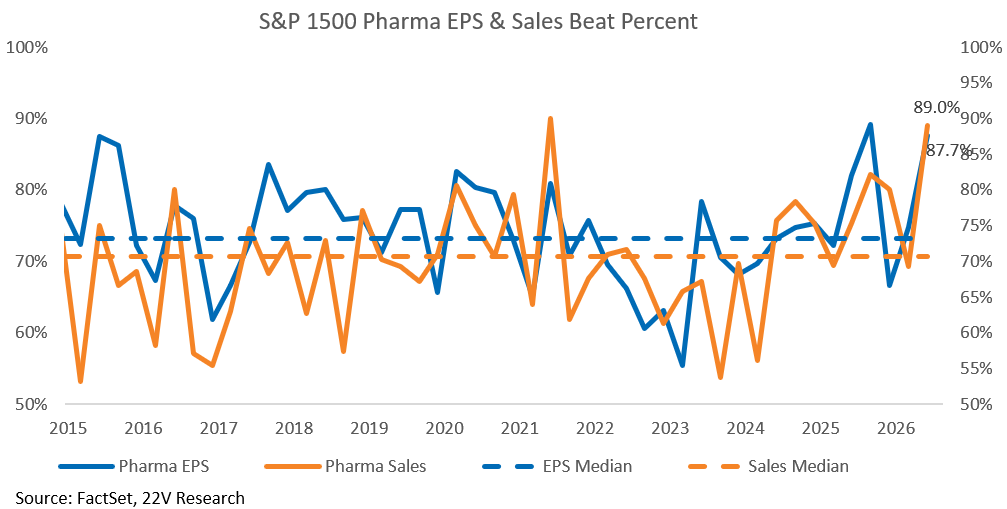
Pharmaceuticals, Biotechnology & Life Sciences (GICS 3520) have surged following Moderna’s vaccine success. The rally has been more than a single name or a single index, driven by broad fundamental strength. In 2Q26, 89% and 88% of S&P 1500 names in the industry group beat sales and EPS estimates, both the second-highest readings since 2010. Nearly 40% delivered EPS beats exceeding 20%. Strong fundamentals have pushed the industry group ERP to its lowest level since 2002, suggesting relative high valuation.
AI users in Pharma & Biotech reported a higher EPS beat rate, but strong results among non-AI names show that earnings strength extends across both baskets. Crucially, AI Users are measured based on earnings call discussions rather than actual adoption. Only 33% of the group discussed AI usage on their latest calls, leaving established adopters such as Eli Lilly and Merck out of the AI basket. Benefits from faster discovery and better early-stage productivity can take years to reach reported earnings, making quarterly commentary an incomplete measure of AI’s role.
Cash use reinforces this distinction: R&D remains the group’s largest allocation, with no aggregate spending reduction yet evident. AI’s economic value may first emerge through better pipeline outcomes rather than lower budgets. Although valuations have already re-rated, we believe the longer-term opportunity remains underappreciated.
On September 29th, Microsoft Research unveiled Quine, an AI research system for the intersection of computation and biology. On the same day, AstraZeneca committed $2 billion to Summit Therapeutics to co-develop its lead cancer antibody, which are only six weeks after Merck and Moderna’s individualized cancer vaccine succeeded in Phase III.
As our Strategy report highlighted (Here), drug development has traditionally been characterized by long timelines, high costs, and low success rates. The early evidence suggests that AI can shorten development timelines and substantially improve early-stage productivity, potentially lowering R&D costs and improving the long-term economics of drug discovery.
A Broad-Based Rally Built on Fundamentals
Our AI Usage Pharma & Biotech basket has outperformed S&P 1500 by 35.2% YTD and 10.7% in September. Moderna’s Phase III success added roughly 8% relative return to the basket on August 19th. However, other names in the basket also rallied on that day, and the basket’s September gain also confirms that its strength extends beyond a single stock. Therefore, Moderna’s surge was more of a catalyst that drew the market’s attention to the group’s potential rather than the sole source of the rally.
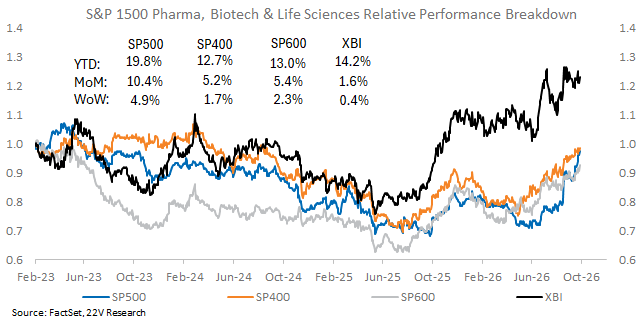
The rally is also broad across market caps. Pharma & Biotech names in large, mid and small caps have all outperformed S&P 1500 on a w/w, m/m and YTD basis. Unlike the consumer groups we covered (Here and Here), where gains in one size segment came at the expense of another, the strength in Pharma & Biotech is broad across all three indices, with large caps leadership partially because of Moderna’s rally and XBI which also holds many smaller biotech names outside the S&P 1500, has gained far less over the past month.
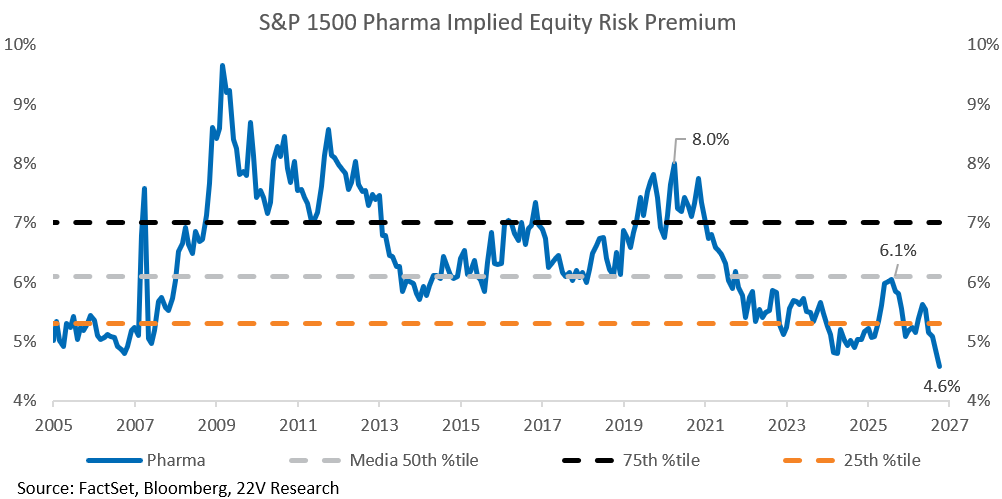
The group is increasingly more expensive since Covid. Its ERP has fallen from 8.0% in March 2020 to 4.6% today, the lowest level since 2002, as investors have steadily rerated the industry group post-Covid. The major interruption came in mid-May 2025, when FDA leadership turnover and expectations of a stricter approval regime sent pharma names sharply lower and pushed the ERP backup to 6.0%. The spike reflected a policy discount rather than an earnings problem. Once the policy overhang eased, prices recovered steadily and the ERP resumed its decline.
Fundamentals have kept pace. In 2Q26, 89% and 88% of S&P 1500 Pharma & Biotech names beat sales and EPS estimates respectively, both the second-highest readings since 2010.
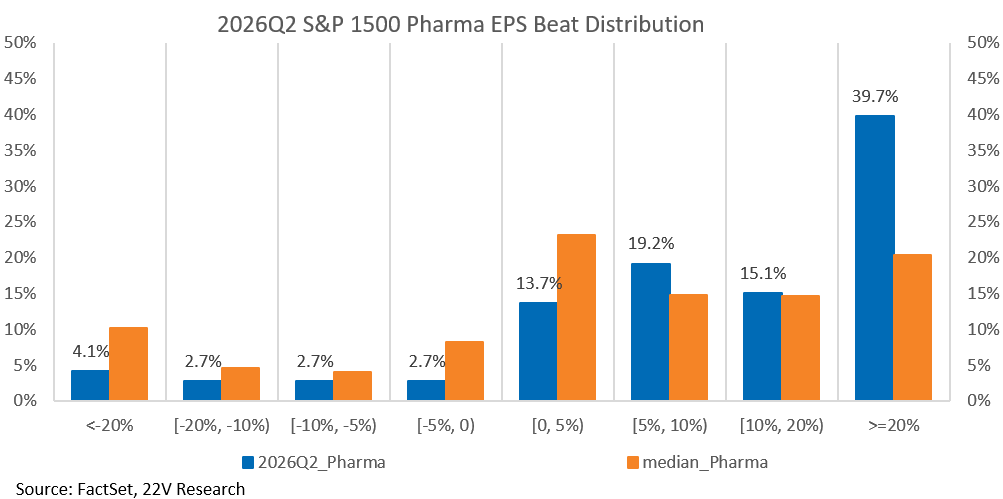
The beats were large as well as frequent. Nearly 40% of companies in the industry group beat EPS by more than 20%, roughly double the historical median, which skews the quarter decisively towards the extreme-beat bucket.
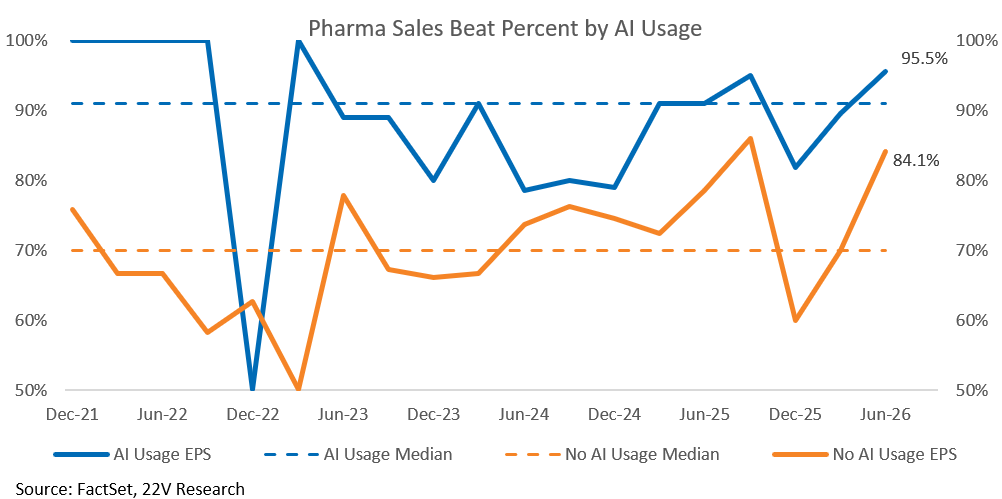
AI and non-AI names both share this strength. AI Usage companies posted a 95.5% EPS beat rate versus 84.1% for non-AI companies. AI users have consistently beaten more often, but non-AI names improved more from 1Q26. The record quarter is therefore a combined effect rather than an AI story, which raises the central question of this report: if AI is as valuable to drug discovery as the evidence suggested, why does it differentiate Pharma & Biotech AI Users so little?
Discussions About AI Usage Dislocated from Actual Adoption
AI Usage derived from earnings calls understates actual adoption in Pharma & Biotech. Only 33% companies in the industry group discussed their use of AI in 2Q26 earnings calls, much lower than 48% of S&P 1500 or most of other industry groups.
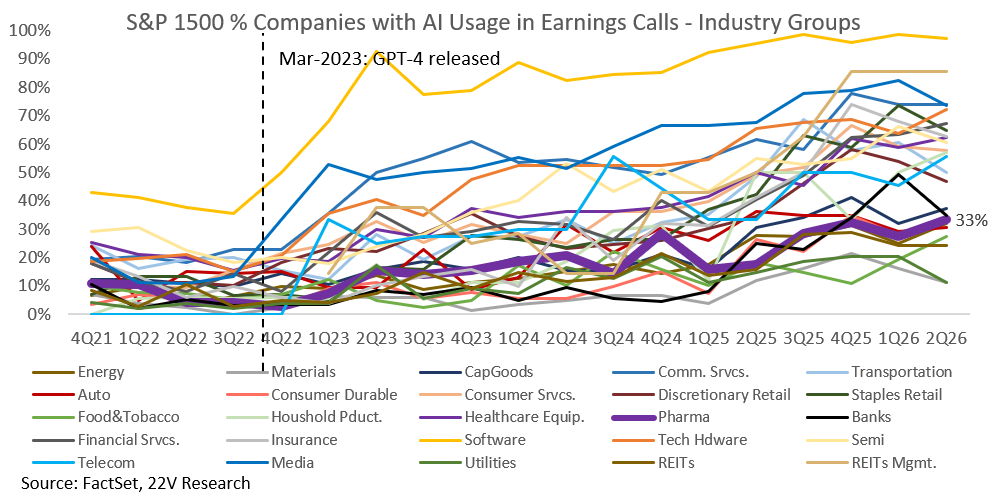
We used an LLM to identify companies in the group whose management teams said on their 2Q26 earnings calls that they currently use AI. The S&P 1500 AI Usage Pharma, Biotech & Life Sciences names derived from their earnings call are listed below. However, not all Pharma companies using AI explicitly talked about their use case. For example, Eli Lilly and Merck, two of the industry’s best-known AI adopters, are absent because neither company mentioned AI on its 2Q26 call.
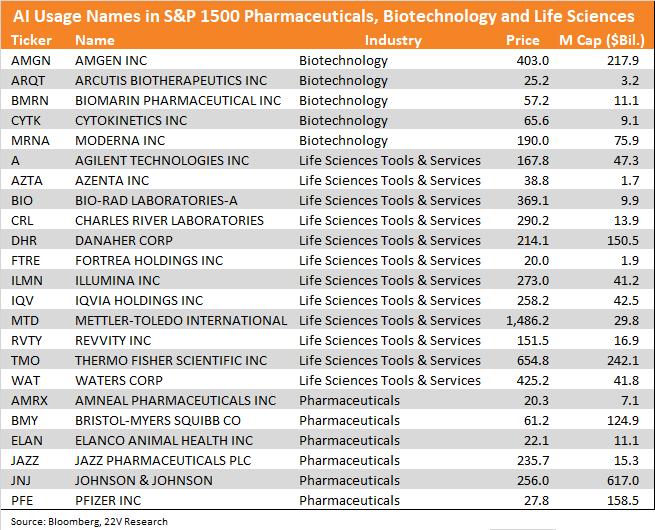
Eli Lilly, one of Pharma’s leading AI adopters, last discussed AI on its 4Q25 call focusing on AI application on new medicines discovery and development. In neither the 1Q26 nor the 2Q26 call did they return to the subject. Lilly is not an isolated case, as more than 1/3 of Pharma & Biotech companies that discussed their AI use on 4Q25 or 1Q26 calls did not do so on 2Q26.
We believe this happens because AI’s payoff in drug development has not yet appeared. Shorter discovery timelines and higher early-stage productivity take years to reach the income statement, so AI rarely comes up unless someone asks about it.
Moderna’s 2Q26 call illustrates the point. Moderna’s Management did not mention AI in its prepared remarks, and the only reference came when a Barclays analyst asked how Moderna selects neo-antigens. The Chief Development Officer replied, “In fact, we’re using artificial intelligence to try [to] develop the next algorithm. I think the key thing will be, when we get an efficacy readout linking our algorithm to efficacy, I think that will be the next important step.” Without that question, Moderna would not have qualified as an AI Usage company, and its answer makes clear that AI’s value will be proven by a trial readout rather than by quarterly earnings.
From this perspective, even investors who recognize how AI benefits companies such as Moderna, and who have watched its vaccine success driving the stock sharply higher, may still underestimate the role AI plays in these companies if they rely on earnings call transcripts alone.
Talking About AI and Spending on It Are Separate Things
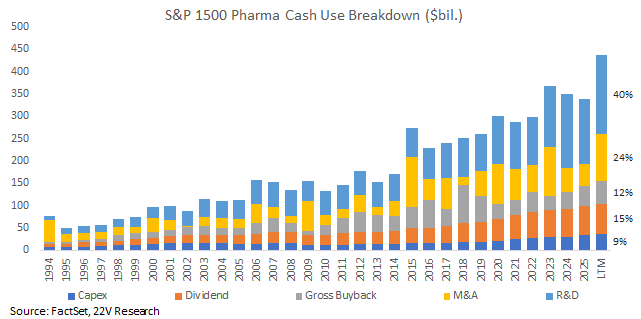
Cash use tells the same story. R&D, which includes acquired pipeline assets, remains the largest use of cash for the industry group at a record $176bn, or 40% of total cash use, and there is no signs that AI is reducing R&D spending.
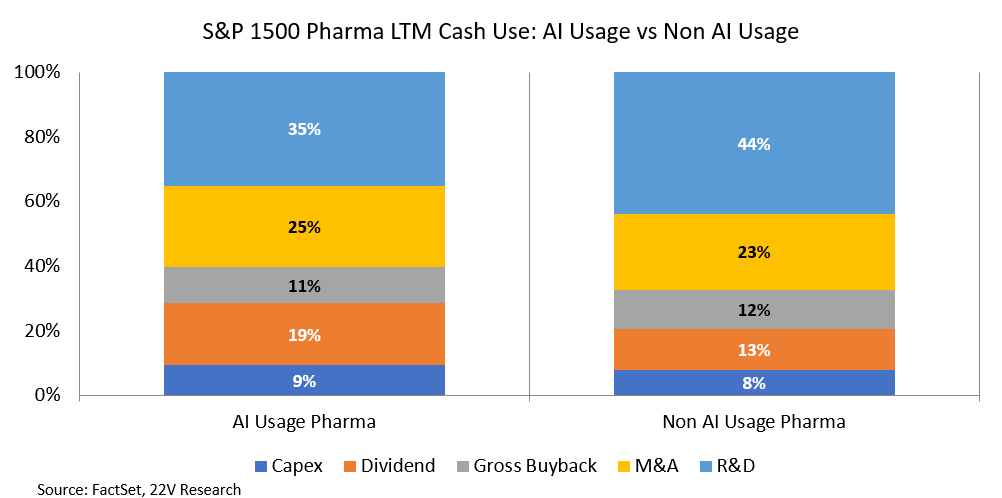
Splitting the group into AI Usage and non-AI Usage baskets shows two different cash-use profiles. R&D accounts for 35% of cash use in the AI Usage basket versus 44% in the non-AI basket, while dividends take 19% versus 13%, because the AI basket holds dividend-heavy companies such as Pfizer, Johnson & Johnson and Amgen. Several of the largest R&D budgets, including those of Eli Lilly and Merck, sit in the non-AI basket this quarter. This makes Pharma & Biotech an outlier among industry groups, because AI’s payoff in drug development arrives through trial readouts rather than quarterly results, so management teams discuss AI less consistently on earnings calls and large R&D spenders can move between baskets from one quarter to the next.
As Jordi Visser argued last year (HERE), AI shifts pharma from labor-intensive to compute-intensive economics, and his Rule of 40 frames the potential rerating. Legacy pharma, with about 5% growth +25% free cash flow margin, scores roughly 30 and falls short. AI-enabled pharma, with 10-12% growth +30-32% margin, scores 42-44. Once major pharma companies sustain scores above 40 for several quarters, growth investors are likely to enter the sector. Until management teams begin to quantify AI’s impact on R&D, we believe the market will remain far from fully pricing AIs benefits to Pharma & Biotech and there is opportunity as discussions catching up with adoption.

