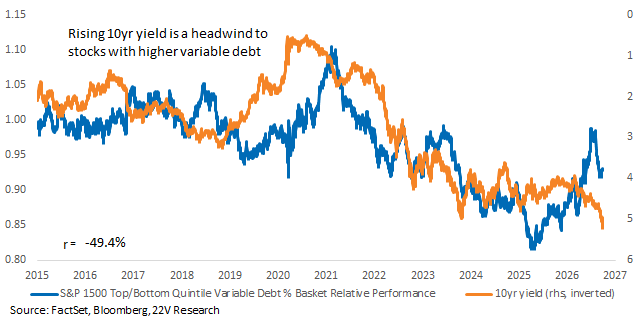
The 10-year Treasury yield has climbed sharply in the second half of the year, alongside a broader rise across the yield curve. Higher real yields and expectations of a tighter Fed path have increased pressure on companies with substantial debt. Those with variable rate borrowing are especially exposed. Historically, stocks with the highest variable debt shares have underperformed those with the lowest shares when the 10-year yield rises.
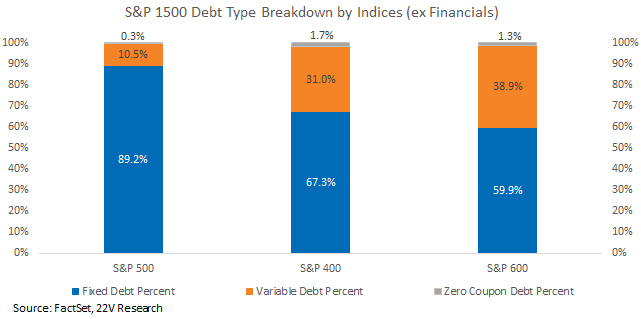
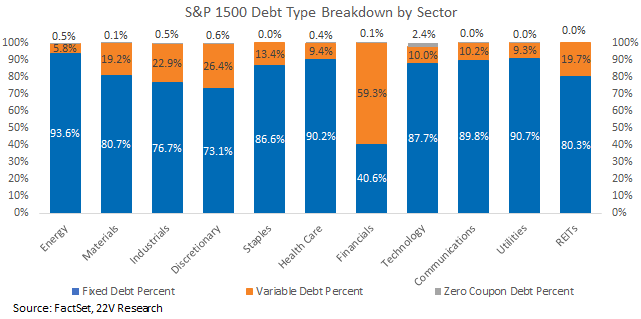
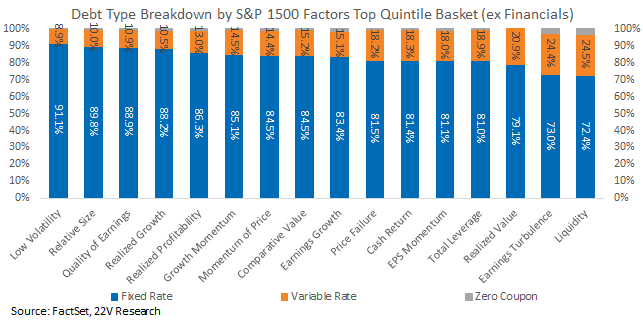
The exposure is uneven. Excluding Financials, variable rate debt represents 38.9% of small cap debt, compared with 10.5% for large caps, a potential contributor to small cap weakness. Consumer Discretionary and Industrials also have relatively high exposure. Technology’s aggregate variable debt share is below that of the S&P 1500, though higher yields can still affect Tech valuations. At the factor level, Low Volatility stocks have less variable debt exposure, while Liquidity and Earnings Turbulence stocks have more. Recent AI driven strength may have masked this risk for some risk-on names.
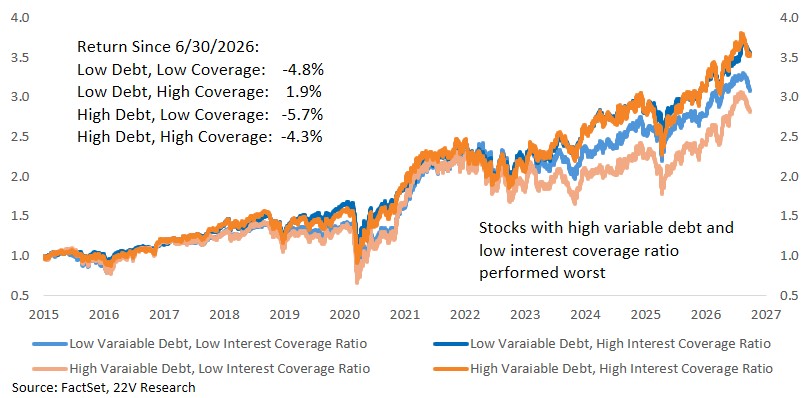
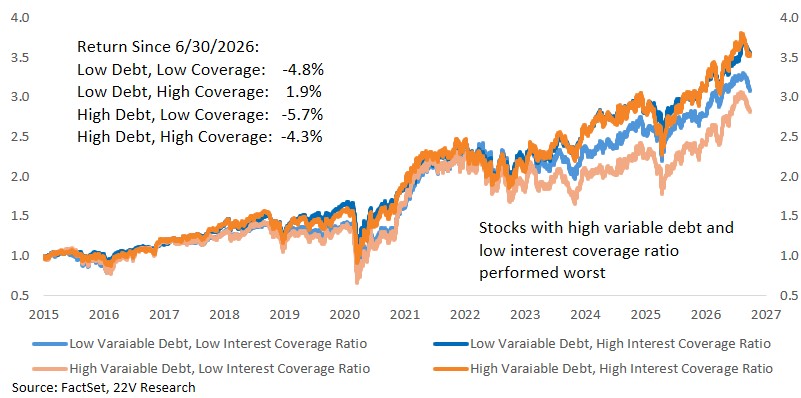
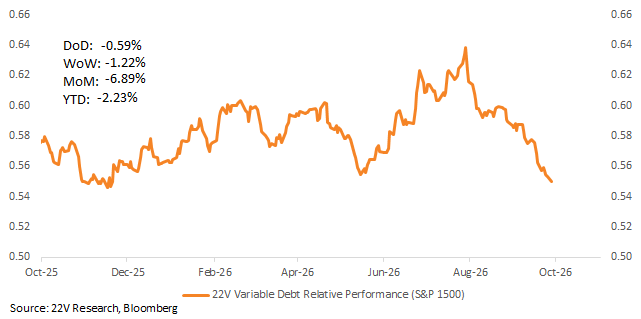
Since July, the combination of high variable debt and low interest coverage has underperformed all other groups. Companies with low variable debt and stronger coverage have fared best and generated positive returns. Our MS22VARD swap tracks the more exposed group and has declined from its late July peak, which is a short executable trade in the current rising yield backdrop. The current 256 names can be found on Bloomberg or by asking us.
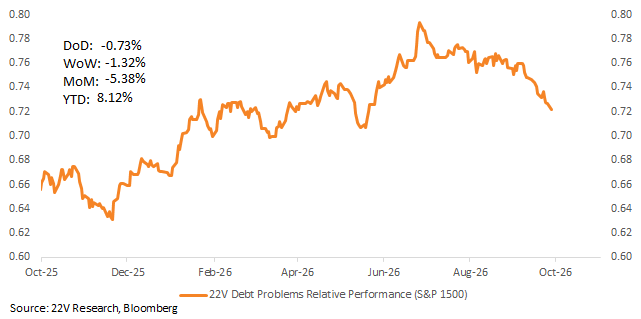
In addition, the broader MS22DEBT debt risk swap has also weakened since late June, reinforcing the need to distinguish debt burden from a company’s capacity to service it.
Rising Yields Put Variable Rate Borrowers Under Pressure: 10yr yields have climbed sharpy higher in 2H26, driven by faster growth and expectations of Fed rate hikes. Higher debt names are vulnerable in a rising yield backdrop as interest expense and squeezed cash flows weigh on earnings expectations. While debt type matters, companies facing more variable debt are unable to lock in low rates, leaving a rising rate backdrop worse for them. Historically, there has been a negative correlation between 10yr yield and the variable debt factor relative performance.
Smaller caps have greater exposure to rising borrowing costs. Excluding Financials, variable rate debt accounts for 38.9% of total small cap debt but only 10.5% for large caps. That is also a factor weighing on the underperformance of small caps post the Fed rate hike (HERE).
On sectors, Discretionary and Industrials currently lead the variable rate percentage of total debts, excluding Financials. Though investors are concerned about Hyperscale’s rising debt, on an aggregate basis variable debt is lower among hyperscalers than in the overall S&P 1500 Tech sector. However, Tech does has the highest equity duration (HERE).
Low Volatility names have lower variable debt, while Risk-on names including Liquidity and Earnings Turbulence have more variable debt exposure. Though Risk-on factors outperformed recently supported by AI trade, rising yield can bring pressure on the factor, especially the Risk-on names that are less tied to AI and Momentum factors.
Under a backdrop of rising rates, the names with high debt burdens and low earnings to cover debt servicing are even more risky. Breaking down S&P 1500 names by their variable debt percent and interest coverage ratio. High variable debt names with low interest coverage ratio underperformed all other groups since July, while the reversed group performed the best and gain even as rates rise.
Our tradable swap MS22VARD consists of S&P 1500 ex Financials names falling in top half of variable debt percent and bottom half of low interest coverage ratio basket. The basket peaked in late July and deteriorated significantly in the recent rising rate backdrop. Currently 256 names are falling in the basket, and the constituents can be found on Bloomberg or by asking us.
In addition, the debt risk swap MS22DEBT has also moved lower from its peak since late June, which consists of S&P 1500 stocks ex Financials, Utilities and REITs that have high debt risk or cash-flow weakness. A stock qualifies if it meets at least one of the following: interest coverage ratio below 0, debt ratio exceeding 1, interest coverage below 2 and deteriorating, operating cash flow volatility negative or exceeding 1 or debt ratio increasing. The basket is also facing debt risk in the current backdrop.