Weekly – The overarching theme is the same. The economic speed limit constraint favors Price Momentum, EPS Momentum, AI Buildout names, High AI Usage Service companies (Software) at the expense of consumer or non-AI Cyclicals. As a reminder, the economic speed limit is the maximum rate real GDP can expand without driving core inflation above the Federal Reserve’s 2% target. The current economic speed limit is roughly 2% because trend productivity growth is ~2% and the labor force contribution to GDP growth is close to zero (HERE).
As Gerard succinctly put it, when economic growth is running above the 2% speed limit, and “the economy is at full employment, inflation is running above target, and the fiscal authority is dumping a ton of demand and “safe” assets into the economy, then the capital markets are going to figure out a way to deliver some restraint.”
As usual our main themes are highlighted in bold followed by a mark to market.
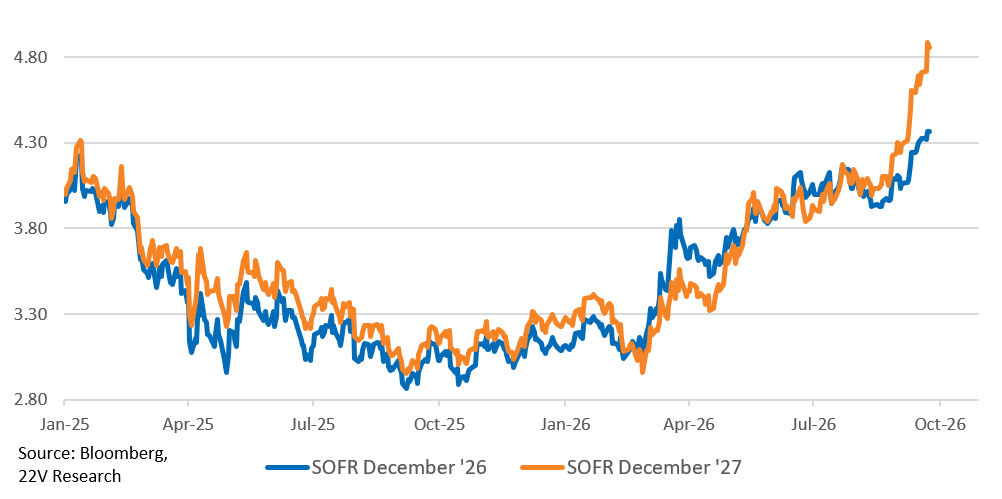
Theme – The implication of the speed limit being a binding constraint on economic growth, and the Fed confirming that constraint, is that economic and labor market strength show up through a more restrictive Fed path OR higher 10year yields. Not higher equity prices. Marking To Market – On Wednesday the S&P US PMI beats on both services (58.7 vs 55.8 expected), manufacturing (57.0 vs 53.7 expected) were 90th percentile+ and strong PMIs were a global phenomenon (Eurozone aggregate services 53 vs 51.4 expected, manufacturing 52.7 vs 52.6 expected). 10yr yields registered a 98th%tile dod move following the PMI data. The market internal regime was classified as Broad sell-off. That is consistent with economically sensitive factors underperforming (Value) and small caps, retail and transports underperforming.
The sum of investment and consumption growth is still tracking close 5% in 3Q alone! We moved further ABOVE the economic speed limit last week and bond yields acted accordingly (higher) and Non-AI related Cyclicals underperformed.
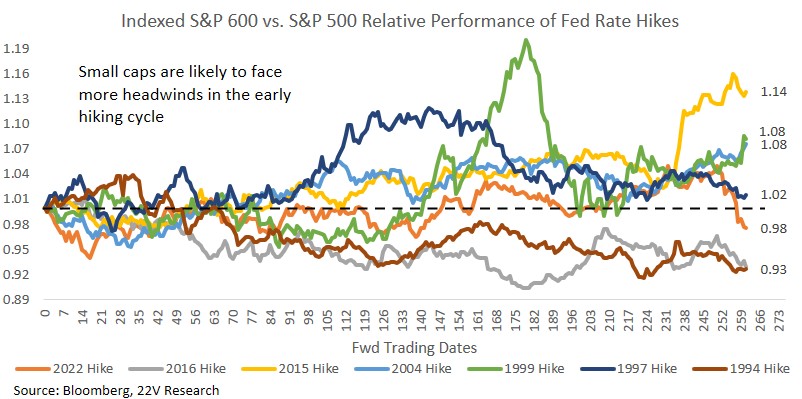
Our Longer Term call is that 10yr yields around current levels WILL deliver a mild economic slowdown and the speed limit will be respected the easier way. That mild slowdown will increase the odds that the economic cycle extends and eventually be positive for equities in general but specifically for small caps, retail stocks, transports and industrials. Historically small caps performance has improved about 3 months following the first fed hike (HERE).
Gerard puts the underlying trend in real personal consumption expenditure growth at about 2%, by eyeballing a trend line through the level of ex-auto real personal consumption expenditure growth. The speed limit would become much less of a binding constraint if real spending growth headed toward 2%. Our call essentially rests on further deterioration in housing and auto data and some downshift in consumer and corporate behavior spending behavior related to the recent increase in 10yr yields. We are not going to get a slowdown from the investment side (AI Capex), it needs to happen from the consumer side.
Timing, Tactical Thoughts and Risks – Early 2027 should be a more interesting time to be long small caps, retail stocks, transports and industrials. Some slowing in economic growth, particularly consumer spending, should be evident by that time. And roughly 3 months following the first mid-cycle rate hike has supported small caps (details below) and riskier factors historically.
FYI – We are open to making the call to be long small caps and more economically sensitive sectors earlier, but it would take unusually dovish data relative to baseline expectations to make that call. We would think about dovish hedges now. We will have more this week.
The risk is economic growth does not slow enough to respect the economic speed limit (HERE), even with the current level of 10yr yields. In this scenario, the Fed shifts to “doing what it takes” to lower inflation (more hikes). 10yr yields move significantly higher and recession probabilities increase. We don’t think this is the modal path, but a lower unemployment rate (below 4%) with still well above 2% Real GDP growth and above 3% core PCE inflation would increase those odds.
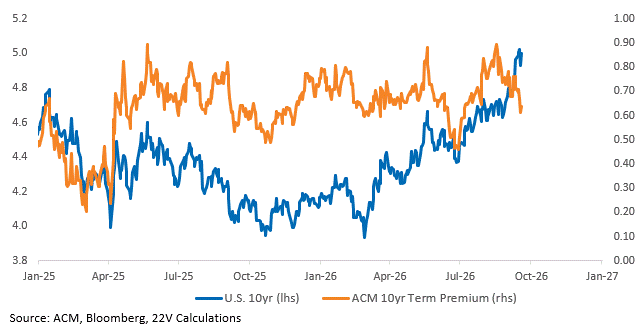
Theme – We are still constructive on equities over the cycle as EPS growth is unusually strong and inflation is not so far away from the Fed’s target that demand growth needs to be significantly reduced. Marking To Market – 10 yr UST Yields moved above 5% last week, but the VIX finished the week at 14 and credit spreads remained tight. The 10yr term premium – the “uncertainty risk” embedded in 10yr yields – has fallen over the last few months. i.e. the uncertainty premium in 10yr yields has moved LOWER and the 10yr yield increased, signaling strong real economic growth is the driver of 10yr yields.
Consistent with our framework. While real economic growth is the driver of 10yr yields, not upside inflation risk, FROM HERE, equities are unlikely to move meaningfully lower. FYI – Strong real economic growth is also consistent with positive correlation between 10yr yields and oil prices starting to weaken.
Here is the problem for market and risk assets, despite very strong economic growth and earnings. The Fed and or 10yr yields will keep pushing to a place that accomplishes the goal of slowing economic growth and inflation. The fed funds rate is a blunt tool, and something could break along the way. That RISK of something breaking should limit market gains
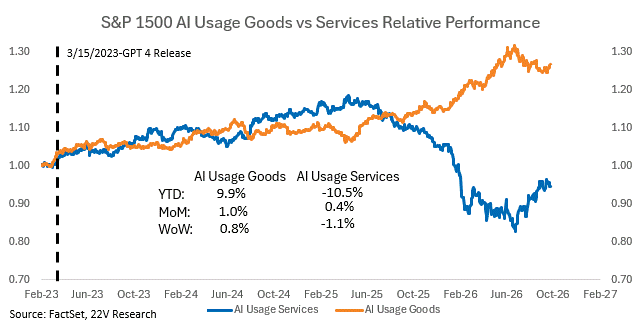
Theme – AI capex holding up as the rest of the economy slows some favors the AI buildout names, EPS Momentum, Price Momentum and GARP on a relative basis. Or companies that are less cyclical and using AI to increase margins/profits (software). Marking To Market – Price momentum was the best performing long short factor last week. The correlation between high AI goods and high AI usage services (software), which has been deeply negative, has improved. We wrongly expected the correlation to improve over a month ago. Our view remains that rather than a zero-sum trade where buildout beneficiaries win at the expense of disrupted service companies, both baskets reinforce and propel each other through a virtuous feedback loop. Margins and Earnings for both baskets are increasing as other areas of the market (non AI related Cyclicals) struggle.
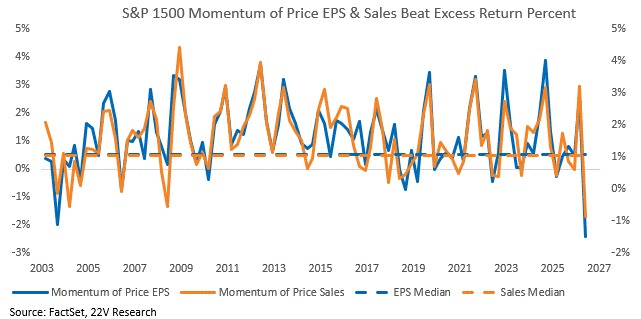
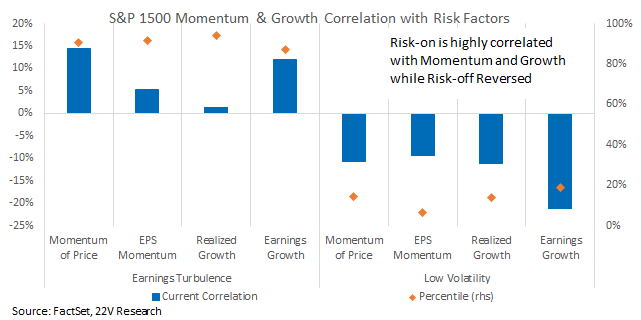
Marking to Market Investable Themes – Risk-on Factors have outperformed Risk-off Factors (MS22RISK on Bloomberg) since we went long on August 4th. Risk-on factors are still outperforming risk-off. Despite the market internals being risk-off. The stocks in risk-on factors are highly exposure to the Price Momentum and risk-off factors are highly exposed to the low Vol factors. In 2Q, high Price Momentum names had a record high EPS beat rate (85.2%) and a record low median excess return for beats (-2.4%). The median excess return was UNSUALLY poor. That is highly unlikely to repeat. We remain long the MS22RISK swap. Contact us for details.
Longer Term – It’s counterintuitive, but a NON-RECESSIONARY increase in the unemployment rate would be CONSTRUCTIVE for equities. The unemployment rate increased in 2025 while S&P 500 multiples expanded. The unemployment rate is moving lower in 2026 and PEs are contracting. FYI, if the unemployment rate were to increase, the speed limit for economic growth would increase. Gerard and I cover this more in a video HERE.
Charts and indicators below…
CURRENT BACKDROP: The Speed limit on economic growth is a constraining factor. Strong real economic growth is still the primary driver of 10yr yields and the increase in fed rate hike expectations.
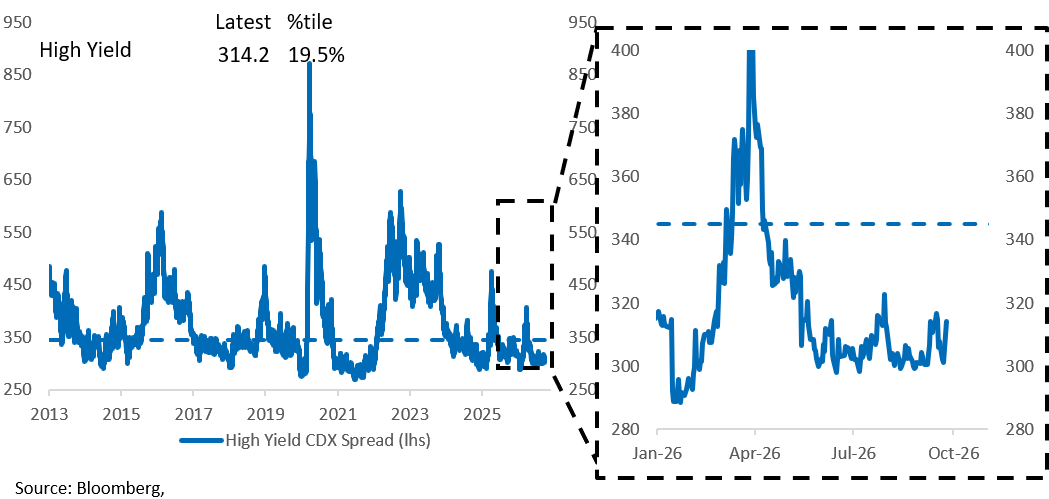
High yield CDS spreads remain tight. The market is not pricing in a high probability of a recession.
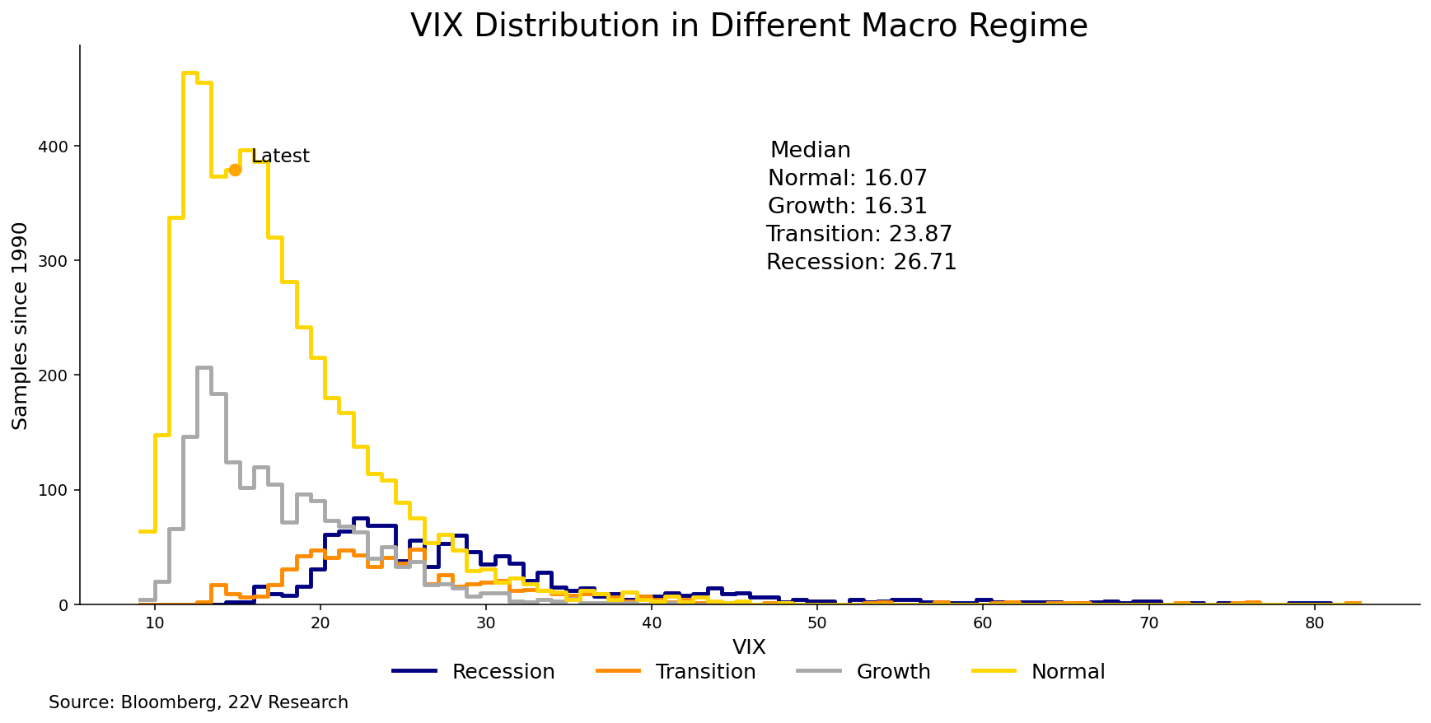
The VIX at 14 is what you would expect in a normal economic expansion. If the normal economic expansion was at risk, the VIX would be significantly higher. 10yr yields could get to a point that leads to a much higher VIX. It just hasn’t happened yet.
10yr term premium has declined significantly as 10yr yields stay near recent highs. Suggesting less uncertainty in 10yr government bonds, but a still relatively firm economic growth outlook.
MOMENTUM UPDATE: In 2Q, high Price Momentum names had a record high EPS beat rate (85.2%) and a record low median excess return for beats (-2.4%). The median excess return was UNSUALLY poor. That is highly unlikely to repeat.
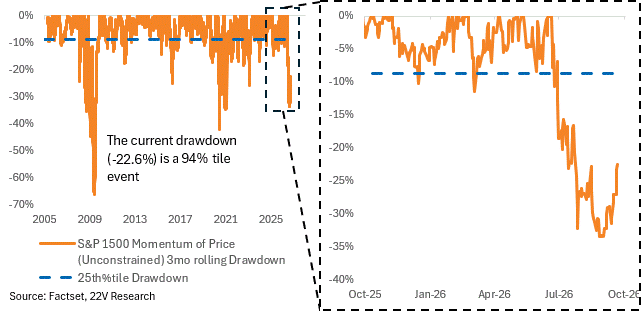
The current Momentum drawdown is a 94th percentile drawdown, exceeded only by the GFC and COVID.
Momentum and Growth factors have unusually large exposure to AI beneficiaries. Momentum and Growth factors have extreme overlap with Risk-on factors, WHICH WE ARE LONG. We are long AI winners, Momentum and Growth factors.
Related, as 22V Data & Infrastructure Dauvin Peterson’s pointed out in a report last Friday (HERE), across a curated universe of 81 AI capex-exposed companies spanning 12 market segments next-Twelve-Months (NTM) EV/EBITDA multiples compressed by an average of 26.1% from their peak levels earlier in the year. Earnings growth over the same period increased. FY2 EBITDA consensus estimates rose by an average of 12.3% (with NTM EBITDA up 20.8%) and that valuation is more attractive relative to history. The 81-company group trades at an average NTM EV/EBITDA of 14.9x, which is 1.14x their pre-2026 historical average (13.4x between 2022 and 2025).
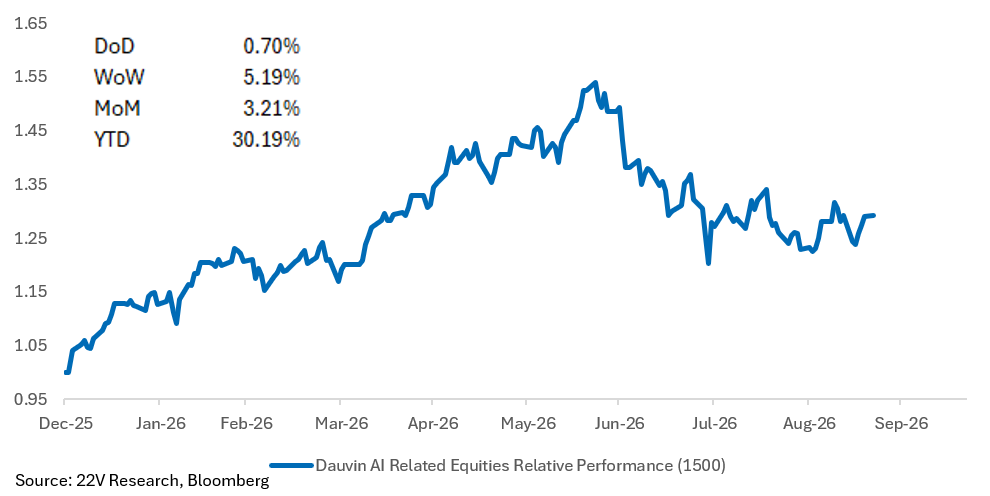
AI UPDATE: Our view remains that rather than a zero-sum trade, both AI Buildout and service baskets will reinforce and propel each other through a virtuous feedback loop. Margins and earnings for both baskets are increasing as other areas of the market (non-AI related Cyclicals) struggle. The short-term rolling correlation between high AI Usage services and AI Buildout beneficiaries has turned positive.
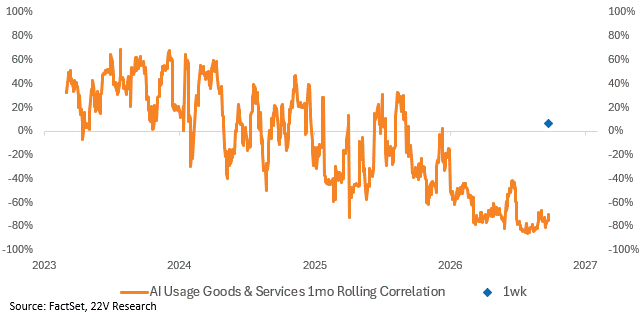
As growth slows, 1) investors will reward strong eps growth and cash return, which is a tailwind for AI Services that have implemented AI, and 2) activity and investment in the AI buildout will continue to outpace non-AI cyclicals. As Dauvin Peterson, head of 22V Data Infrastructure/Commodities research has been noting (most recently HERE), compute shortage remains one of the most powerful (and investable) themes.
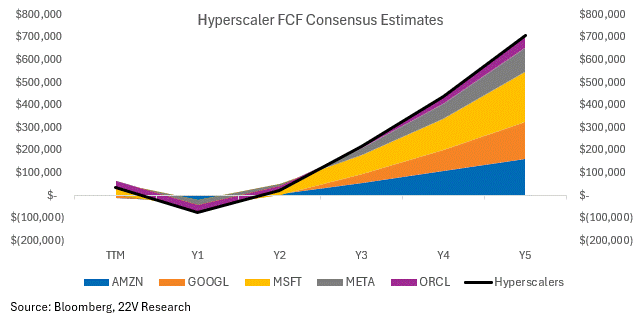
Hyperscalers (AMZN, GOOGL, MSFT, META, ORCL) have been some of the best performers within the AI stack recently. Uncertainty over the ROIC of the AI Buildout commands a higher risk premium, but consensus estimates still indicate strong fundamentals.
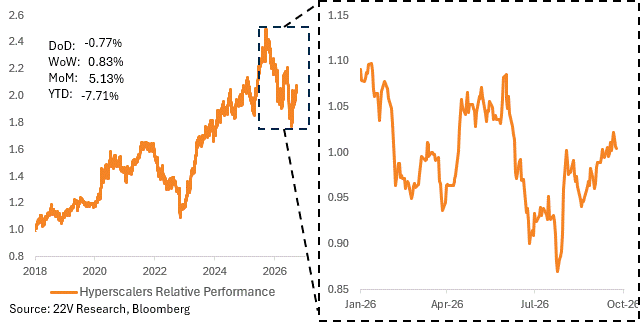
FCF is expected to turn positive for the group by Y2, growing rapidly from there. We aren’t experts on whether consensus estimates will be right or not. Our point is that Hyperscalers are a difficult short when consensus estimates are for a good return on incremental invested capital from the AI buildout.
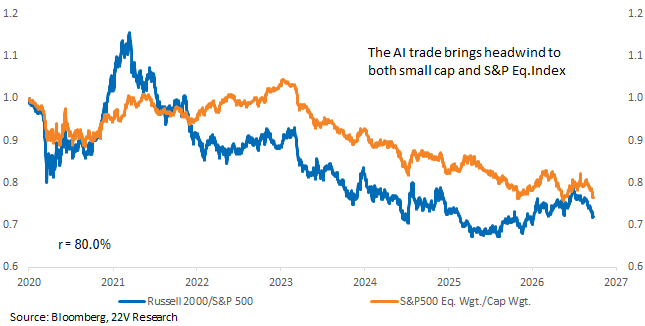
SMALL CAPS: Small caps have continued to underperform large caps, continuing their trend lower since August. This weakness has coincided with a further deterioration in S&P 500 equal-weight relative to cap-weight performance, reflecting continued concentration in the largest names. The two relative-performance series have historically been highly correlated, suggesting that continued mega-cap/AI leadership could remain a headwind for small caps in the near term.
Small caps reversed in the first three months post the hike but tend to rebound longer term. Near term return for small caps remain weak, while longer term macro headwind should fade and the driver for its performance turns back to its fundamentals. John Roque, 22V Technical Analyst, also scores small cap weak currently, confirming the macro/market headwinds.
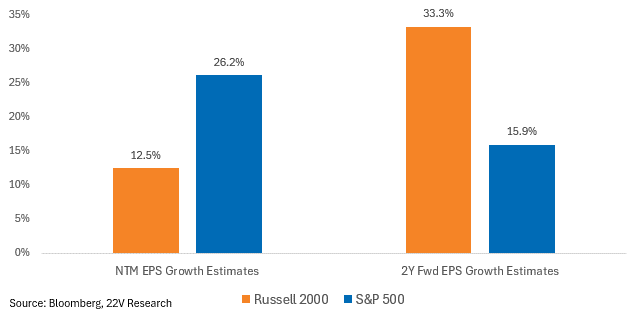
There’s an opportunity once inflation cools. Large caps are expected to grow earnings ~2x the rate of small caps over the next twelve months, but consensus estimates show that reversing in Y2. Net net, small cap 2 year EPS CAGR (+22.4%) is greater than large caps (+20.9%).
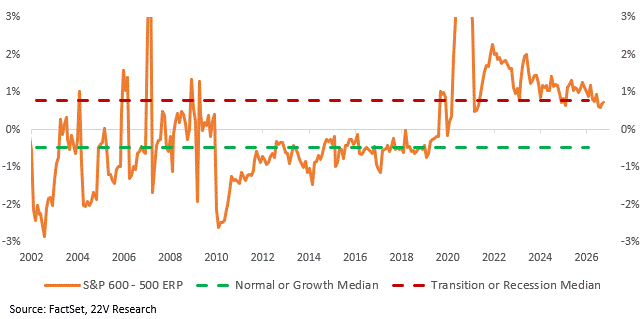
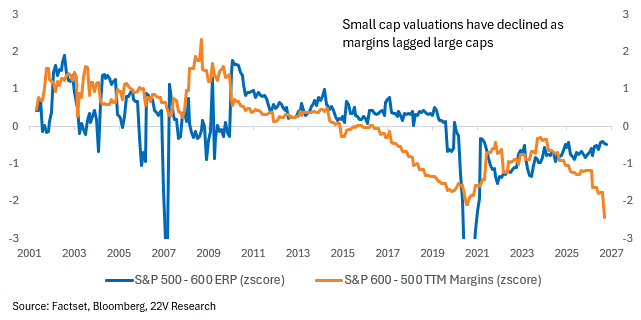
Small vs large cap valuations move in regimes. Targeting a pre-COVID valuation spread has not worked. The valuation spread is partly a function of margins. Net net, small caps need better margins relative to large caps for a durable rerating. This year, the margin spread has widened by another 1.7pp, in favor of large caps.
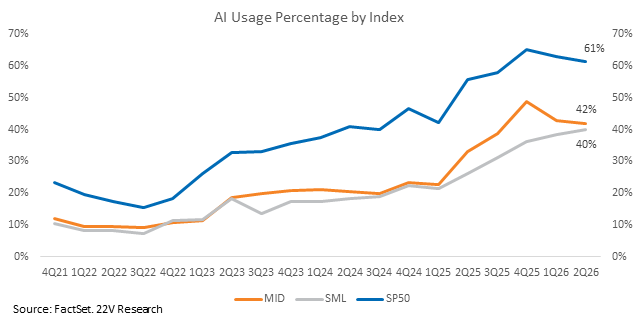
Last quarter, small cap AI usage narrowed the gap to large cap AI usage. That’s the good news. The bad news is that implementing AI has not had the same impact on small caps so far.