Back Banks

Waller’s reaction function and the implications for a steeper yield curve/regional rebound

Published on September 4, 2026

∙ Download the PDF Report

By

Bill Hebel

Brian Herlihy

  • In a speech yesterday, Fed governor Chris Waller laid out what is arguably a more dovish message focused on the current trend in inflation (as he views it) moving back towards 2%. While far from giving an all clear sign, he did flag that the August inflation data (next Friday’s CPI) will be a key lynchpin in his thinking as to whether or not policy needs to be more restrictive. He even went so far as to define his own reaction function to incoming data. While it feels a little funny to be focused on an individual Fed governor’s reaction function rather than the Fed Chairman’s himself, his commentary is being taken as an indicator for the core of the committee who remain on the fence regarding whether or not to hike in September. Waller did mention in the Q&A that a 3-month rate of 2.8% would be good enough to hold. A 0.3% MoM reading next week would imply 2.8% for the 3-month average which seems to suggest that we would need to see a MoM CPI # above 0.3% to elicit a hike at the September meeting. While leaving a number of caveats, the statement “I would be inclined to support holding the target for the federal funds rate at its current setting” we believe says it all.
  • Relative to recent bank performance, we believe the impact has the potential to be meaningful. Just to level set, the idea of running the economy hot/easier financial conditions had been accruing to bank performance over the last few months. From 6/1 through 8/18, the KRE was up 9.6% and outperformed the S&P 500 by ~850bps. Commensurate with the move, the 2-10 spread peaked at ~53bps prior to the Treasury Secretary’s intervention at the long end of the curve. From 8/18 through today, the 2-10 spread dropped from ~53bps to a low of ~37bps last Friday and is back to ~42bps today. The KRE is down ~2.6% underperforming the S&P by ~330bps over that same period.
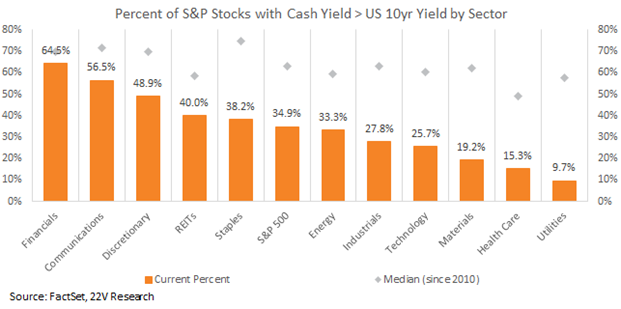
  • So what’s the pitch for the group from here? From our perspective, bank stocks work best when good underlying fundamentals are laid on top of a supportive macro backdrop. We’ve been arguing the bottoms-up supportive case (solid loan growth and fees, benign credit, robust capital return) for some time. Our Quant Team’s recent report (here) also highlighted the attractive cash return yield of the financials sector. The cash return distribution is broad based with 64.5% of S&P Financials posting a total return yield above the 10Y Treasury.
  • We would argue that our regional banks in particular screen well from a total payout ratio perspective with most in our coverage screening north of 75% total payout when considering buybacks and dividends.
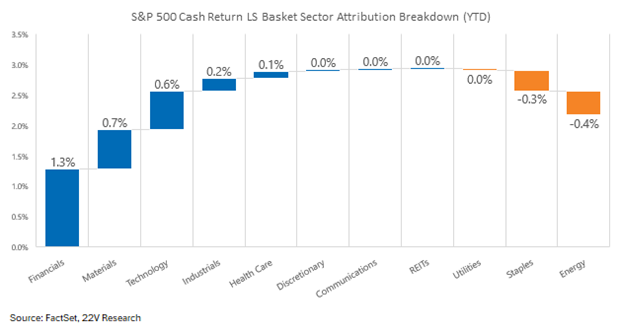
  • Even more interesting has been the Team’s highlighting of the cash return factor as a driver of performance. The Cash Return factor constructed using yield, payout ratio and growth has been the best performer within the S&P this year, gaining 13.8% YTD.
  • From a macro perspective, a reacceleration of the easier financial conditions/steeper curve we think could help the near term performance of the banks after this recent pullback. From a short term momentum perspective, the KRE registered a short term oversold reading on 9/1 as measured by the 14-day RSI (see below). Given that the short term consolidation occurred above an upwardly sloping 200 day moving average, we believe it reinforces the KRE’s constructive trend.
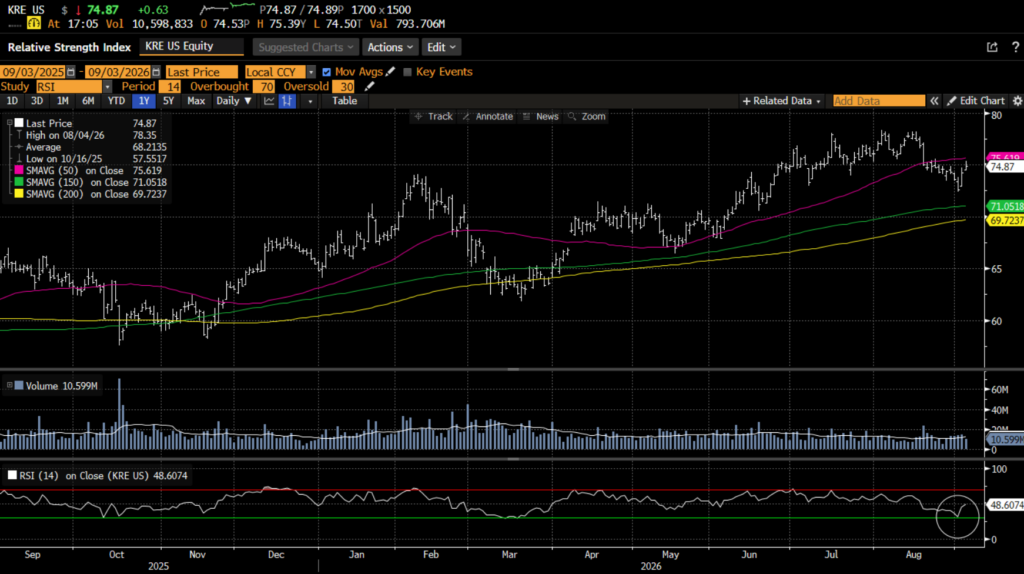
Source: Bloomberg

  • Within the banks, we also noticed a discernible trend from pre and post 8/18 with the capital markets names having lagged the regionals pre-8/18 only to outperform post given more concern for the spread lenders due to a flattening curve relative to the capex buildout beneficiaries which have predominantly been the capital markets related names.
  • From our coverage, we would reiterate the Sector Outperform on Fifth Third (FITB) which has been down an above average 4% as being poised for a catch-up trade here. While investors had to digest a bit of the vagaries of the 3Q/4Q compares due to the Labor Day conversion expense saves being more loaded into 4Q (which is logical), FITB’s 2H’26 estimates in their totality were essentially unchanged. We continue to like the name here and while in line with consensus for 2H’26, we remain ~1.3% ahead for FY’27 on PTPP/share. Importantly, our estimates still do not include any rate hikes for this year or next. With FITB tilted slightly asset sensitive (NII +0.42% in an up 100bps scenario), we believe that if the Fed were to raise short term rates, FITB’s NII would benefit at least as much as advertised as their assumptions on betas have tended to be conservative in the past.
  • On the flip side, within the capital markets exposed names, Sector Underperform rated Wells Fargo (WFC) is up 2% since 8/18 as money rotated away from the regionals. We believe that if the curve re-steepens due to easier financial conditions, core regionals like Fifth Third could close the recent gap that has opened up at the expense of Wells Fargo and the broader capital markets sensitive names.

Model Updates

  • As part of a some model housekeeping, we’re also updating estimates for Citizens Financial (CFG), Fifth Third (FITB) & Regions Financial (RF).
    • CFG – We raise our FY’26 & FY’27 estimates from $5.24/$6.44 to $5.32/$6.51. On a PTPP basis, we’re ~1% ahead for 2H’26 and essentially in line w/consensus for FY’27. While our revenue estimates are largely similar to consensus in FY’27, we assume 4% expense growth (vs. 5% in FY’26) while consensus assumes 3.7%. Our target comes up $1 to $75 which is ~11.5x our new FY’27 estimate.
    • FITB – Our FY’26 estimate of $4.13 remains intact while our FY’27 estimate rises to $5.09 from $5.04. On a PTPP basis, we’re 1.3% ahead for FY’27. Our FITB target also rises $1 to $61 or 12x our new FY’27 estimate.
    • RF – We raise our FY’26 & FY’27 estimates from $2.58/$2.83 to $2.66/$2.86. The majority of the delta in our ’26 estimate comes from a lower provision. On a PTPP basis, we’re essentially in line for 2H’26 along with FY’27. Our target remains $31.


Current Rating Distribution

Coverage Universe Percent
Sector Outperform 31.25
Sector Perform 50
Sector Underperform 18.75

DISCLOSURES AND DISCLAIMERS

Analyst Certification

The analyst, 22V Research Group, primarily responsible for the preparation of this research report attests to the following: (1) that the views and opinions rendered in this research report reflect his or her personal views about the subject companies or issuers; and (2) that no part of the research analyst’s compensation was, is, or will be directly related to the specific recommendations or views in this research report.

Analyst Certifications and Independence of Research.

Each of the 22V Research analysts whose names appear on the front page of this report hereby certify that all the views expressed in this Report accurately reflect our personal views about any and all of the subject securities or issuers and that no part of our compensation was, is, or will be, directly or indirectly, related to the specific recommendations or views of in this Report.

22V Research (the “Company”) is an independent research provider. The Company is not a member of the FINRA or the SIPC and is not a registered broker dealer or investment adviser. 22V Research has no other regulated or unregulated business activities which conflict with its provision of independent research.

22V Research, LLC is a professional services and independent publication organization. 22V Research, LLC is not a securities broker-dealer, not a member of the Financial Industry Regulatory Authority (FINRA), not a registered investment advisor (RIA) and not a member of SIPC.

Securities transactions, when offered, are offered by 22V Securities, LLC through LPS Capital, LLC. Certain employees of 22V Securities, LLC are dually registered as securities representatives of LPS Capital, LLC or Analyst Hub Securities, LLC. 22V Securities, LPS Capital and Analyst Hub Securities are members FINRA, SIPC.

https://brokercheck.finra.org/

Current Ratings Definition.

SECTOR OUTPERFORM: An “outperform” rating anticipates the company will outperform the S&P Regional Banking Index (peer group).

SECTOR PERFORM: A “market perform” rating anticipates the company will perform in line with the S&P Regional Banking Index (peer group).

SECTOR UNDERPERFORM: An “underperform” rating anticipates the company will underperform the S&P Regional Banking Index (peer group).

Limitation Of Research And Information.

This Report has been prepared for distribution to only qualified institutional or professional clients of 22V Research Group. The contents of this Report represent the views, opinions, and analyses of its authors. The information contained herein does not constitute financial, legal, tax or any other advice. All third-party data presented herein were obtained from publicly available sources which are believed to be reliable; however, the Company makes no warranty, express or implied, concerning the accuracy or completeness of such information. In no event shall the Company be responsible or liable for the correctness of, or update to, any such material or for any damage or lost opportunities resulting from use of this data. Nothing contained in this Report or any distribution by the Company should be construed as any offer to sell, or any solicitation of an offer to buy, any security or investment. Any research or other material received should not be construed as individualized investment advice. Investment decisions should be made as part of an overall portfolio strategy and you should consult with a professional financial advisor, legal and tax advisor prior to making any investment decision. 22V Research Group shall not be liable for any direct or indirect, incidental or consequential loss or damage (including loss of profits, revenue or goodwill) arising from any investment decisions based on information or research obtained from 22V Research Group.

Reproduction And Distribution Strictly Prohibited.

No user of this Report may reproduce, modify, copy, distribute, sell, resell, transmit, transfer, license, assign or publish the Report itself or any information contained therein. Notwithstanding the foregoing, clients with access to working models are permitted to alter or modify the information contained therein, provided that it is solely for such client’s own use. This Report is not intended to be available or distributed for any purpose that would be deemed unlawful or otherwise prohibited by any local, state, national or international laws or regulations or would otherwise subject the Company to registration or regulation of any kind within such jurisdiction.

Copyrights, Trademarks, Intellectual Property.

22V Research Group, and any logos or marks included in this Report are proprietary materials. The use of such terms and logos and marks without the express written consent of 22V Research Group is strictly prohibited. The copyright in the pages or in the screens of the Report, and in the information and material therein, is proprietary material owned by 22V Research Group unless otherwise indicated. The unauthorized use of any material on this Report may violate numerous statutes, regulations and laws, including, but not limited to, copyright, trademark, trade secret or patent laws.