DAILY STRATEGY: Yesterday’s CPI reading was on the dovish side, at least on a first pass. The Market Price Only (MPO) version of Core PCE, which removes financial service prices, was 0.18% (HERE). September rate hike odds have declined to 36% from 47% before the CPI release.
FYI on MPO focus for Core PCE. Financial services prices are HIGHLY likely to contribute to a higher Core PCE number. If PPI today indicates a higher Core PCE number based on financial service prices, IGNORE the reading. A new PCE methodology is being introduced in September that will revise the financial service data away.
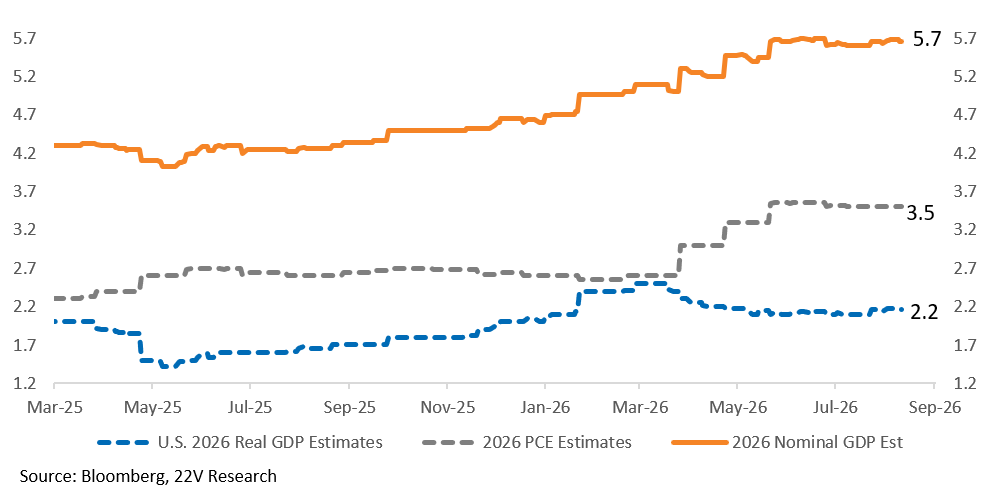
The obvious question was why 10y yields did not move meaningfully lower on dovish data. In short, nominal GDP growth is still running close to 5.7%. As long as nominal growth remains that strong, there is no obvious reason for 10-year yields to move much lower. The way to think about yesterday’s inflation data (and the most recent slightly dovish payroll report) is that it limits UPSIDE tail risk for 10yr yields. The odds of 5% or above on 10yr yields is now lower. We have high conviction that the yield curve is biased to steepen*. That informs our long Banks call.
A decline in 10yr yields to 4.3% or below would require weaker economic data. 10yr yields around the current level and driven by strong demand growth, supports Risk-On Factors (High Earnings Risk), fundamental factors (Earnings Momentum, GARP, Growth Momentum) and Cyclical sectors. All have significantly outperformed over the past week.
We Favor Early Cyclicals (Retail, Banks, Transports), the broad AI complex and Biotech/Healthcare Equipment (details in the table below). Deeper Cyclicals, like Industrials, have some near-term valuation headwinds. Despite what would normally be a positive backdrop. For background (See Quant Report for details HERE), Industrials have delivered one of the strongest earnings seasons of any sector, are levered to the massive AI buildout, and the macro environment supports them. Investors are applying a stricter standard to Industrials than other groups. Industrials posted and EPS beat rate of 86.7%, the third highest among all sectors and near the top of its range since 2016.
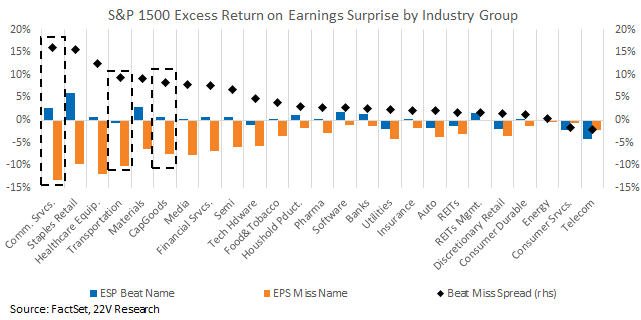
Yet Industrials have been the least rewarded sector this earnings season. Misses were punished more severely than in any other S&P 1500 sector and relative to its own historical pattern. Industrial beats generated only modestly positive excess returns, producing the widest and most negative beat-miss reaction spread among the 11 GICS sectors.
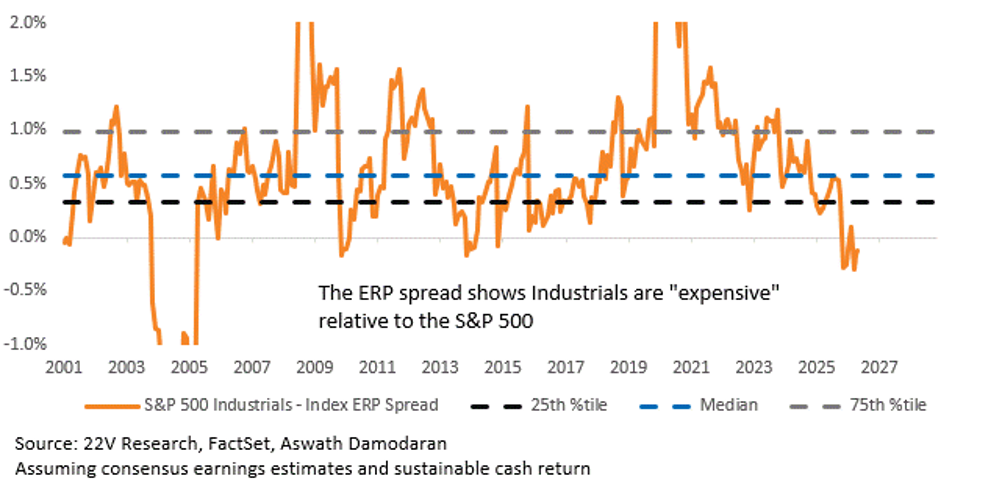
The Problem It Seems – The Industrials index ERP sits at its 93rd percentile relative to both the S&P 500 and the ERP spread – investors are paying a lot for growth. FYI – The most recent data indicates that Industrial sector EPS growth expectations have actually come down. One catalyst for better Industrials performance would be upward revisions to NTM estimates given the strength of 2Q results. Investors probably need to see those revisions.
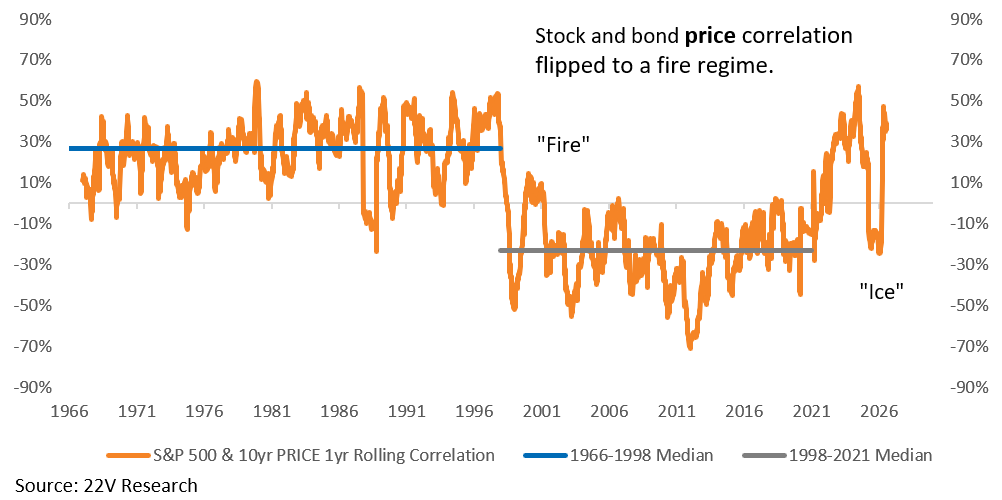
*Background – Yield-curve steepening remains our longer-term direction of travel (favors banks). There are two major structural forces behind that view. First, the expected path of federal debt-to-GDP continues to steepen. Markets need a higher expected excess return to absorb an accelerating supply of duration, pushing term premiums higher and biasing the curve steeper. Second, stock and bond returns are positively correlated (yields rise when stocks fall and vice versa) so adding duration no longer provides the same diversification benefit and instead adds portfolio risk.
The major force that offsets the yield curve steepening trend is Fed tightening. A Fed tightening campaign, that leads to lower economic growth expectations in the future, would flattens curves, but typically for a brief period. Flattener trades would be counter cyclical trading opportunities. Not playing for a trend.
Charts…
Nominal GDP growth is still running close to 5.7%, so there is little reason for 10-year yields to collapse.
Industrial industry groups have had unusually poor excess return spread.
Industrials sector ERP sits at its 93rd percentile relative to both the S&P 500 and the ERP spread – investors are paying a lot for growth. The YTD change in the ERP, if it is running ahead of better earnings growth, was pricing in an additional 3pp on the EPS CAGR over the next two years. The most recent data, however, indicates that EPS growth expectations have actually come down. One catalyst for better Industrials performance would be upward revisions to NTM estimates given the strength of 2Q results.
In a bull steepener, the strongest sector performers tend to be Health Care Equipment and Pharma, Biotech & Life Sciences, while Semiconductors, Commercial & Professional Services, and Retailing tend to be the largest underperformers.
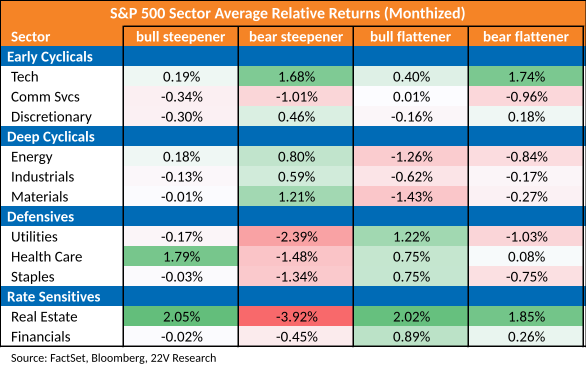
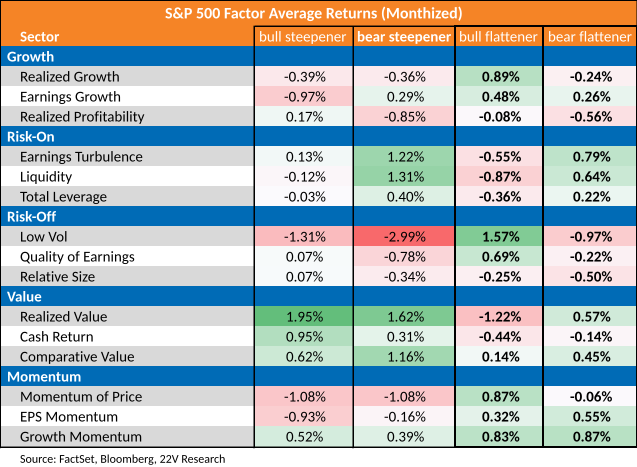
From a factor perspective, Value typically outperforms during a bull steepener, while Low Volatility and Momentum tend to lag. Within Momentum, however, EPS Momentum tends to outperform Price Momentum. We have a tradeable swap to express this view through Morgan Stanley on Bloomberg—the MS22EVPM Index. Risk-on also tends to outperform risk-off during bull steepening regimes, which can be traded through MS22RISK Index on Bloomberg.
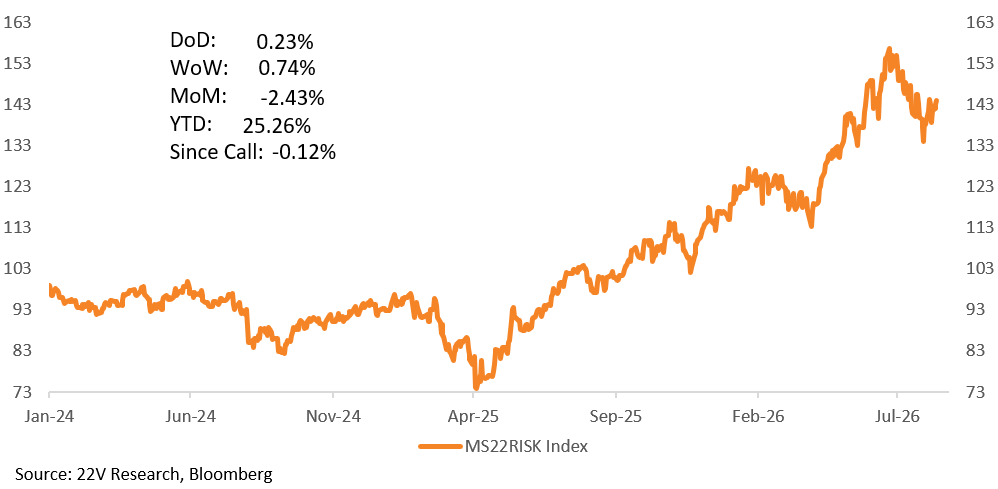
MS22RISK is up 0.74% this week and approximately 25% year-to-date, consistent with the broader risk-on dynamic.
Stock and bond prices have flipped to a positive correlation, reducing the diversification benefit of owning both assets. As that diversification benefit declines, investors should demand a higher expected return for duration.