Back Portfolio Strategy

Fundamentals are Supporting AI Buildout Names

Published on July 31, 2026

∙ Download the PDF Report

By

Dennis DeBusschere

Kevin Brocks

Sophia Wang

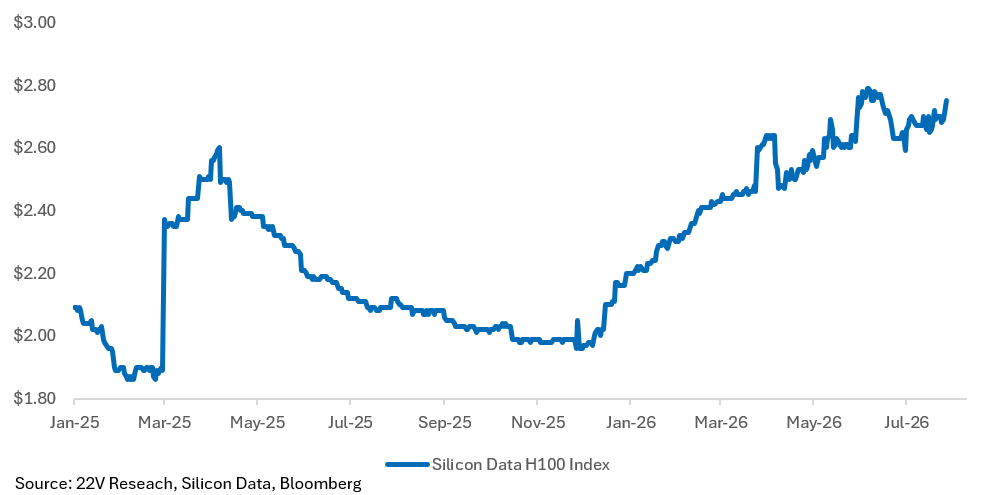
DAILY STRATEGY: Earnings reports from GOOG, META, MSFT and AMZN have reduced some ROIC risk fears. The ROIC risk reduction is related to the strong compute demand comments (confirmed by H100 rental prices. See below). The firm AI capex estimates support the AI buildout beneficiaries. Bottom line – fundamentals are supporting AI buildout names. However, that was also true last week. The new information is some levered holders of AI Capex Beneficiaries being washed out and South Korean authorities signaling direct investments into SK AI stocks.

Out shorter term Momentum factor suggestions have been wrong. We suggested increasing exposure 3 weeks ago only to give up on that idea Monday. The Momentum factor seems to have clearer short-term support. We are not saying chase today, just marking to market. We like the AI Build Beneficiaries and Momentum longer term. But volatility in the AI Capex Beneficiaries and Price Momentum factor needs to come down for investors to get more comfortable in Alpha generation. We think that will happen over time as the normal economic expansion continues.

See the charts below…

WEEKLY AI Update: We are constructive on Service companies that use AI. Open source models are gaining popularity and are less of a threat to the application layer than frontier labs training on their data (see HERE). Then using that data to put many service companies out of business. This last point is most important to software companies, but they are not the only companies impacted by AI disruption fears (See Insurance cos and Payment cos performance in 1Q26).

The AI Service basket is not just Software. It’s a mix of Media, Software, IT, Insurance, Health Care Services, and Logistics providers. A downloadable excel of the constituents can be found HERE.

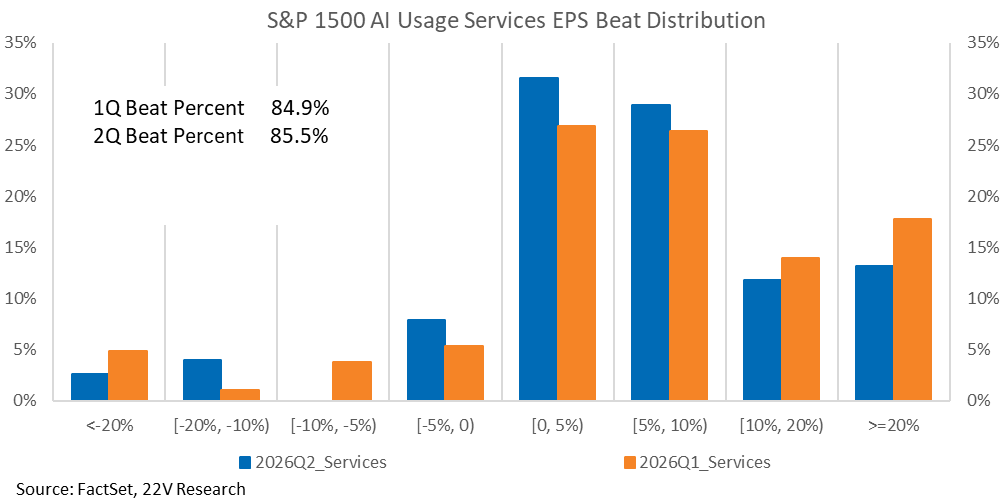
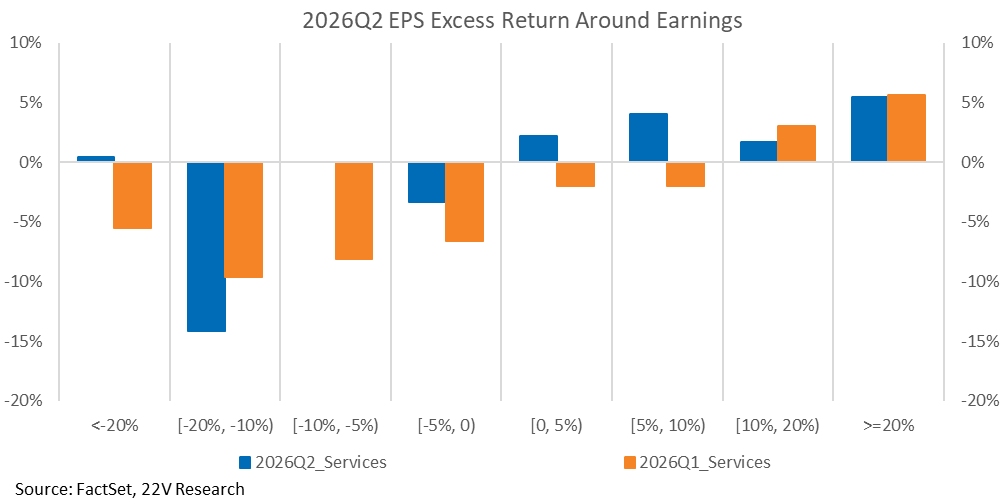
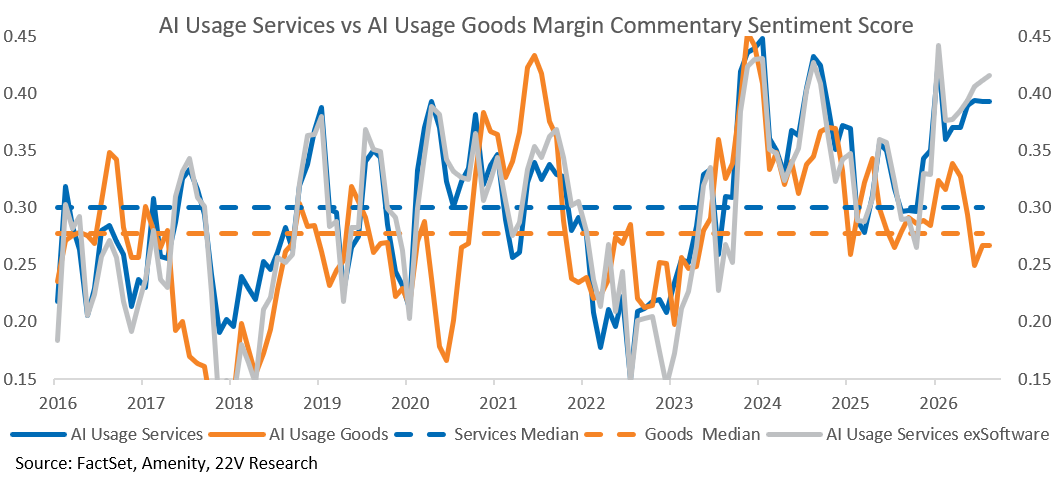
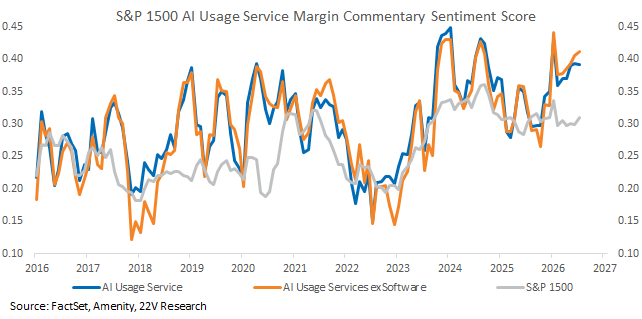
The Facts Seem to Support Better Performance Going Forward – High AI usage services are beating EPS estimates at nearly the same rate as last quarter (85.5% vs. 84.9%). This quarter, though, beats are more concentrated in the 0–10% range, and all beat sizes have generated positive average relative performance. Last quarter, by contrast, only beats of 10% or more were rewarded. Further, margin sentiment for the AI service basket has accelerated. That is consistent with margin expansion across the index. AI service companies, with and without Software names included have unusually high margins.

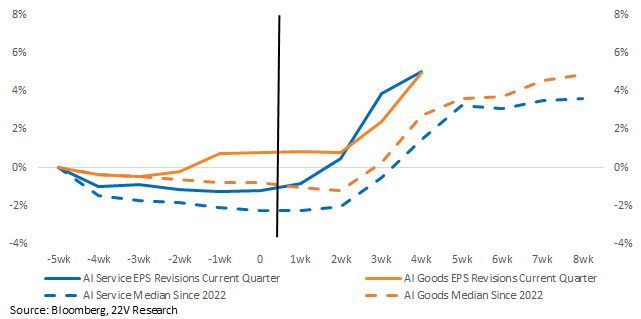
Going forward we would expect AI Goods (which includes semis and the broader AI buildout names) and the AI services basket to both outperform if AI is improving profitability for all companies. The current trends of increasing margins across market caps and strong compute demand support that view (HERE). Both Momentum and Software names outperformed yesterday. Both AI Service and AI Goods EPS revisions are BOTH stronger than normal.

We have both Services and Goods available as tradeable swaps through Morgan Stanley: MS22AISV Index and MS22AIGD Index on Bloomberg, respectively.

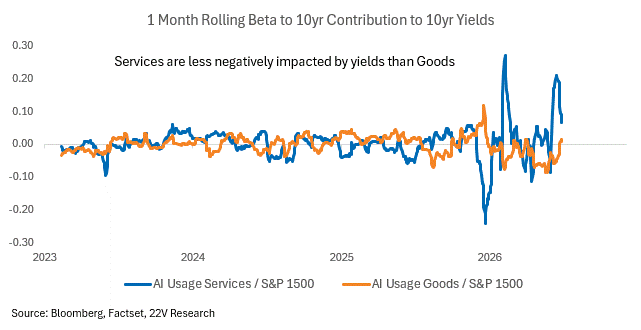
FYI – AI Service names are less sensitive to higher rates. Post the FOMC meeting, our view is 10yr yield volatility is going up. Tightening or easing of financial conditions is more likely to come through the long end of the yield curve vs the Fed funds rate. Current economic trends suggest more upside vs downside risk to 10yr vol (see Peter Willaims HERE and the Video we did with Peter HERE on this subject).

Charts and details…

The H100 rental index (ticker SDH100RT) is a daily benchmark tracking the average hourly spot price and contract costs of renting an NVIDIA H100 GPU. It standardizes prices across neo-clouds, hyperscalers, and private platforms.
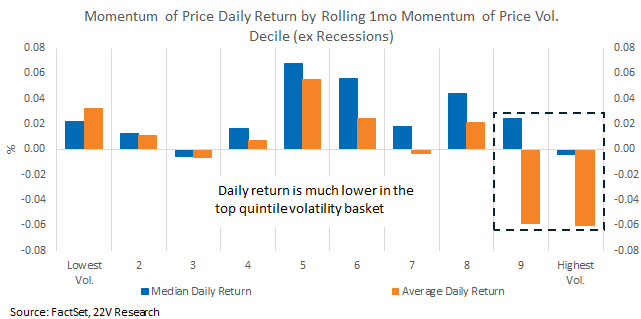
Breaking down 1mo volatility into deciles for historical non-recessionary periods, the top quintile group has the worst Price Mo daily return, especially during sharp plunges. Current 1mo volatility remains at historical 97th percentile, which needs to drop below the 90th percentile, roughly the level around 0.012 to imply a more stabilized Price Mo outlook.
A graph of a number of blue and orange bars

Description automatically generated

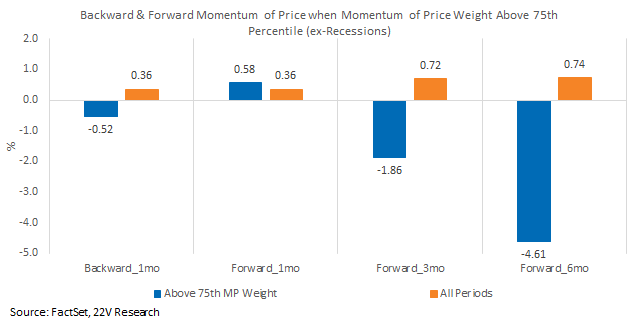
In addition, the concentration of Price Mo names also suggests risk, though less strongly tied to return changes as volatility. Currently, the weight of high Price Mo names within the S&P 50 has dropped to its 76th percentile.
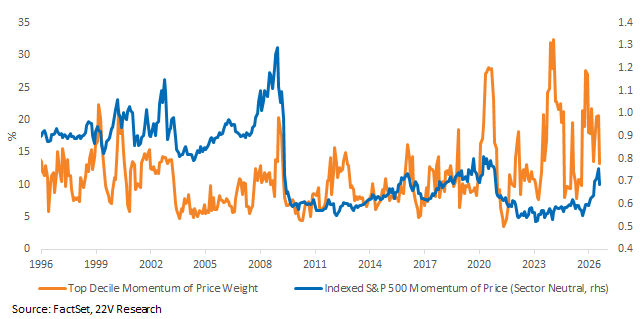
When S&P 500 Momentum weight becomes very large, there is a clear risk for its forward return, especially for forward 3 month and 6 months periods. As concentration sharply dropped, the risk has fallen from its extreme level.
A graph of a graph with blue and orange squares

Description automatically generated

Service companies that are using AI have a similar EPS beat rate compared to last quarter (85.5% vs 84.9%), but fewer large beats. Beats are more concentrated in the 0-10% cohort. All beats have resulted in positive average relative performance. Last quarter only beats of 10% or greater were positively rewarded on average.
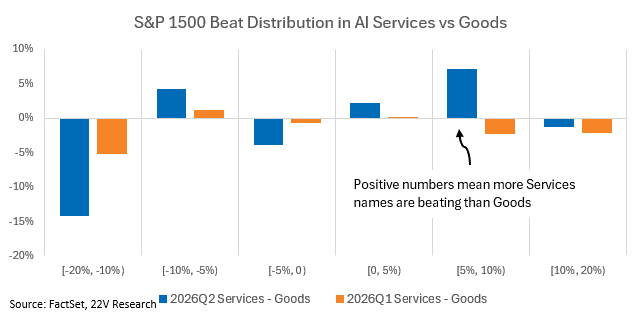
AI Services are beating earnings at a higher clip than AI Goods. The chart below is the spread between the Service and Goods beat rates in each cohort. This quarter is much better for Services than last was.
AI Service and AI Goods revisions are BOTH stronger than normal.
The margin story seems to favor AI Services for now too. Implementing AI is an advantage, and investors are getting more concerned about the buildout. FYI, ultimately, both baskets can work together if AI proves to be a profitability enhancer.
A graph of a service

AI-generated content may be incorrect.

DISCLOSURES AND DISCLAIMERS

Analyst Certification

The analyst, 22V Research Group, primarily responsible for the preparation of this research report attests to the following: (1) that the views and opinions rendered in this research report reflect his or her personal views about the subject companies or issuers; and (2) that no part of the research analyst’s compensation was, is, or will be directly related to the specific recommendations or views in this research report.

Analyst Certifications and Independence of Research.

Each of the 22V Research analysts whose names appear on the front page of this report hereby certify that all the views expressed in this Report accurately reflect our personal views about any and all of the subject securities or issuers and that no part of our compensation was, is, or will be, directly or indirectly, related to the specific recommendations or views of in this Report.

22V Research (the “Company”) is an independent research provider. The Company is not a member of the FINRA or the SIPC and is not a registered broker dealer or investment adviser. 22V Research has no other regulated or unregulated business activities which conflict with its provision of independent research.

22V Research, LLC is a professional services and independent publication organization. 22V Research, LLC is not a securities broker-dealer, not a member of the Financial Industry Regulatory Authority (FINRA), not a registered investment advisor (RIA) and not a member of SIPC.

Securities transactions, when offered, are offered by 22V Securities, LLC through LPS Capital, LLC. Certain employees of 22V Securities, LLC are dually registered as securities representatives of LPS Capital, LLC or Analyst Hub Securities, LLC. 22V Securities, LPS Capital and Analyst Hub Securities are members FINRA, SIPC.

https://brokercheck.finra.org/

Current Ratings Definition.

SECTOR OUTPERFORM: An “outperform” rating anticipates the company will outperform the S&P Regional Banking Index (peer group).

SECTOR PERFORM: A “market perform” rating anticipates the company will perform in line with the S&P Regional Banking Index (peer group).

SECTOR UNDERPERFORM: An “underperform” rating anticipates the company will underperform the S&P Regional Banking Index (peer group).

Limitation Of Research And Information.

This Report has been prepared for distribution to only qualified institutional or professional clients of 22V Research Group. The contents of this Report represent the views, opinions, and analyses of its authors. The information contained herein does not constitute financial, legal, tax or any other advice. All third-party data presented herein were obtained from publicly available sources which are believed to be reliable; however, the Company makes no warranty, express or implied, concerning the accuracy or completeness of such information. In no event shall the Company be responsible or liable for the correctness of, or update to, any such material or for any damage or lost opportunities resulting from use of this data. Nothing contained in this Report or any distribution by the Company should be construed as any offer to sell, or any solicitation of an offer to buy, any security or investment. Any research or other material received should not be construed as individualized investment advice. Investment decisions should be made as part of an overall portfolio strategy and you should consult with a professional financial advisor, legal and tax advisor prior to making any investment decision. 22V Research Group shall not be liable for any direct or indirect, incidental or consequential loss or damage (including loss of profits, revenue or goodwill) arising from any investment decisions based on information or research obtained from 22V Research Group.

Reproduction And Distribution Strictly Prohibited.

No user of this Report may reproduce, modify, copy, distribute, sell, resell, transmit, transfer, license, assign or publish the Report itself or any information contained therein. Notwithstanding the foregoing, clients with access to working models are permitted to alter or modify the information contained therein, provided that it is solely for such client’s own use. This Report is not intended to be available or distributed for any purpose that would be deemed unlawful or otherwise prohibited by any local, state, national or international laws or regulations or would otherwise subject the Company to registration or regulation of any kind within such jurisdiction.

Copyrights, Trademarks, Intellectual Property.

22V Research Group, and any logos or marks included in this Report are proprietary materials. The use of such terms and logos and marks without the express written consent of 22V Research Group is strictly prohibited. The copyright in the pages or in the screens of the Report, and in the information and material therein, is proprietary material owned by 22V Research Group unless otherwise indicated. The unauthorized use of any material on this Report may violate numerous statutes, regulations and laws, including, but not limited to, copyright, trademark, trade secret or patent laws.