Weekly – Per the new format, we mark to market our main themes each week. Themes are bolded and market to market follows.
Theoretical Inflation Debates are MUCH Less Useful Now. Follow The Data on Rate Hike Odds & the Fed’s Reaction Function – Marking to Market – Investors are pricing in 38% odds of a Fed rate hike this week (10% on 7/15) and 72% odds of a 25bp hike by September (40% on 7/15). The reason for increased rate hike odds is the resumption of the energy shock. So far, this theme is playing out. Investors are not focused on where the energy supply shocks COULD LEAD. i.e. the real income and confidence hits that ultimately could create the need for Fed cuts.
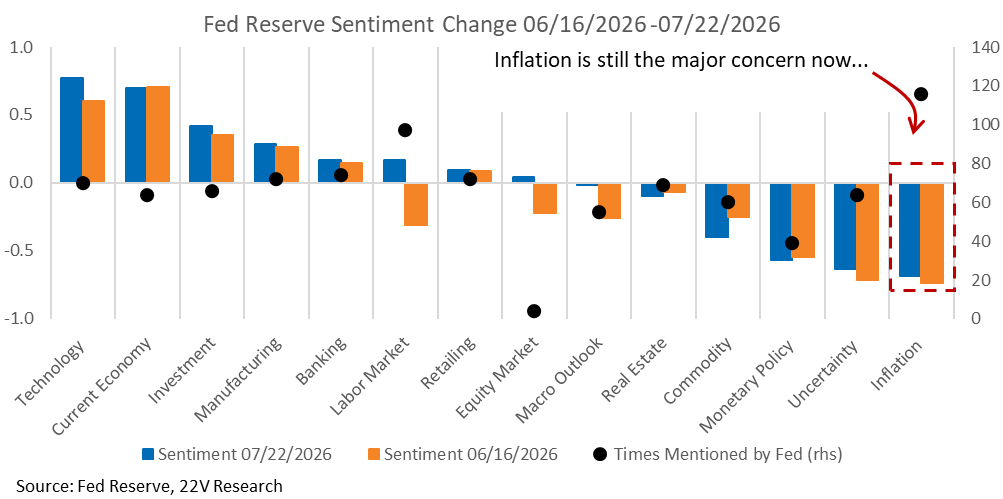
The 22V Fed sentiment model (HERE), which reads and objectively scores all Fed communications, shows that since Warsh’s first meeting in June, FOMC members (including Warsh) have become more concerned about inflation and more constructive on the labor market. Fed Governor Waller, who was until recently considered dovish, specifically focused on persistent supply shocks as a reason to raise rates. He explained that “If big shocks lead firms to increase the frequency of price changes, the Phillips curve steepens, which changes how monetary policy actions are transmitted to inflation and the real economy”
All the above helps explain sensitivity of fed funds’ futures to oil prices – there’s less tolerance for the passthrough to core inflation from oil.
New Theme – Our Bottom Line on Fed Hikes and Impact on Markets, Sectors & Factors – Peter Williams base case is that the FOMC’s next move will be a hike. If there are only one or two hikes, the impact on financial conditions will be modest and Fundamental factor and risk assets will face minimal headwinds. Consistent with a normal economic expansion, long Momentum, Growth, and Risk-on factors, continues to work. From here, industry groups within Technology, Discretionary, Financials, Transports (Trucking in particular, HERE) are most interesting. We remain short Defensives like Staples, Pharma, and Non-AI Utilities and REITS. The Low Vol and Quality factors remain less attractive.
The question is, will economic growth stay so strong that 4+ hikes, rather than one or two, are needed to cool inflation? If 4+ hikes get priced, that would be bad for risk assets. It would be in the direction of the Fed willing to crush economic growth to lower core inflation. +4 hikes being priced would be associated with a tighter labor market data (unemployment rate declines) and a bounce back in CPI/PPI data, that implies 0.3% MoM In Core PCE in August.
Data That Support Our Normal Economic & Market Regime Base Case: Marking to Market – Outside of the Energy shock increasing the threat to the normal economic regime, so far so good on the DATA. In a normal economic expansion, the largest driver of index returns is improving corporate fundamentals, specifically sales growth, while margin expansion provides additional support and PE expansion is a minor influence.
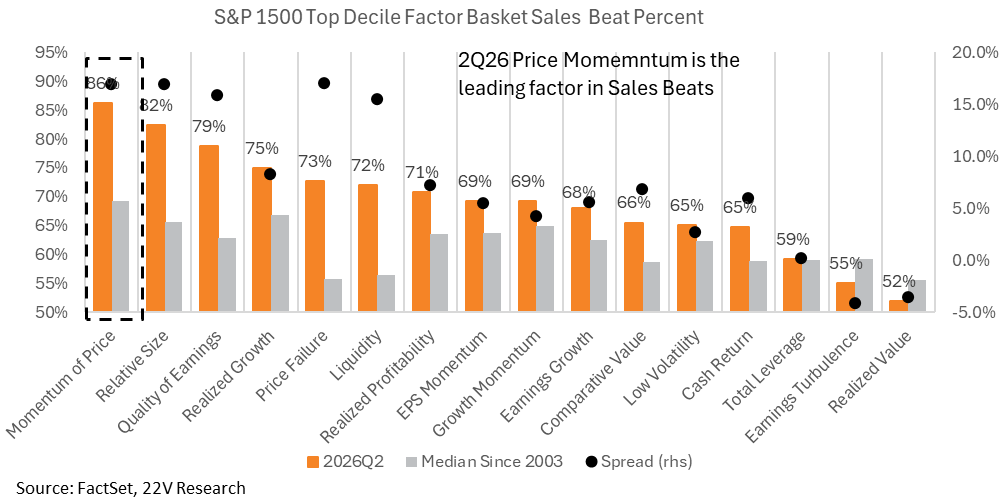
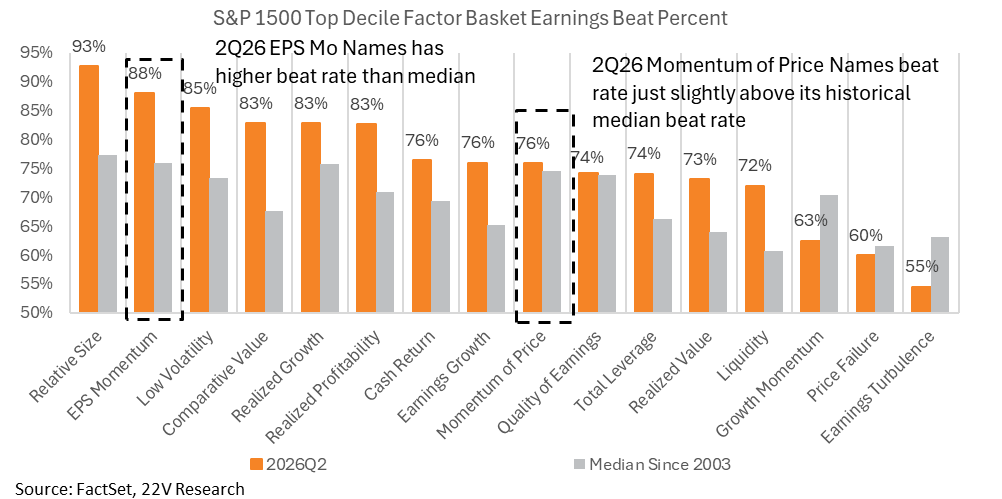
For just about all factors, sales and revenue surprises are running well ahead of expectations in 2Q26 EPS season. Momentum of Price is so by far the leading factor on 2Q26 Sales beat percentage. It is also one of the factors with the highest spread relative to its own median, which means that in 2Q26 the MoP Sales beat percentage leads not only in absolute terms but also relative to other factors and to its own history. The EPS beat percentage of Momentum of Price names is less exciting than the Sales figure. On EPS specifically, the Earnings Momentum factor beat percentage is so far running at 88% vs 75% historically (charts below). All factors are running ahead of EPS and Sales beats.
More Asymmetric Downside Risk for Markets (Introduced 6/28): Marking to Market – Lower frequency macro data have not supported our worries about increased asymmetric risk. Higher 10yr yields and oil prices are reasons risk is elevated now. Core PCE should come in around 0.2% this Thursday and the labor market is still not an obvious source of inflation pressure. Wage growth is moderate, and productivity growth is ~2%. Implying a decline in core services inflation, from unusually high levels now, over time.
Bottom Line – There is only so much of an increase in Fed rate hike odds, 10yr Yields, and oil prices investors will accept. A move above 4.7% on the US 10yr yield, a level Peter Williams views as more obviously restrictive for economic growth, and $100 oil would likely lead to a risk-off move. Markets have decent upside, especially non-AI related cyclicals, if the energy shock fades quickly.
Our call is for a benign slowing of economic growth to the ~2% or below range. That would be consistent with 10yr yields in the 4.2-4.5% range. That supports duration sensitive equities (Tech, Discretionary, Banks, Consumer) and Fundamental factors. Marking to Market – As Peter Williams pointed out (HERE), there may simply be too much nominal spending for inflation to durably be able to return to target; Gerard’s read of the GDP data YTD points in a similar direction. Easy financial conditions, improving willingness to and demand for bank lending, and continued consumer deleveraging all point in similar direction. Growth needs to slow, particularly consumer spending, in the back half of 2026. Johson Redbook Weekly Retail finally rolled over some last week. From 12% WoW to 8%. That is a start, but the long-term median, which is what we likely need to be more comfortable that economic growth is not too hot, is 4.5%.
Non-AI related Cyclicals should continue to Outperform: Marking to Market – Returns for Non-AI related Cyclicals (Banks, Retail, Airlines and Homebuilders. Homebuilders portion is more of a trade) suffered last week. 10yr yields in the 4.5% range and a reduction in the energy shocks are needed for these to work.
AI Idio is Supportive Based on Demand for AI tools Being Robust Longer Term – Marking to Market – Price Momentum outperformed WOW. As Dauvin Peterson, head of 22V Data Infrastructure/Commodities research, highlighted (HERE), “Prior statements reaffirmed for 2027 capex (a significant increase) without additional detail and 2026 capex was raised 8% at the mid-point to $195–205B. To that end, Google’s earnings last week supported the Price Momentum basket. Our expectation is that the rest of the Hyperscalers reports reinforce the $1.1T in AI capex in 2027 that investors we surveyed think is necessary to support AI Capex Beneficiaries.
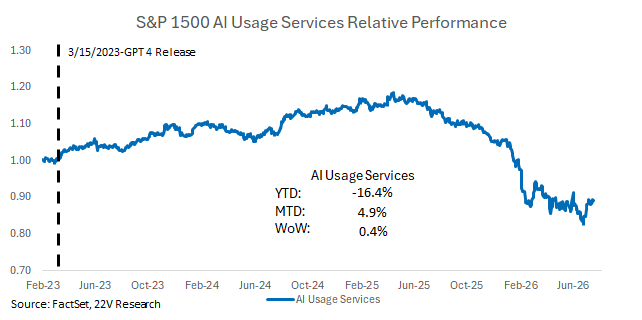
The direction of travel seems like “open weight models” vs closed. The pushback against the frontier AI labs attempts to kill the competition in the name of safety is intense. See CEO of NVDA Jenson Huang letter here. In theory, services companies using AI tools to expand margins/productivity are interesting to look at now. They have less risk of being put out of business by the frontier labs in an open source world. Our high AI usage service basket has stopped underperforming over the past 3 months (chart on page 4). This seems like a good place to source ideas now.
Charts related to the comments above are below…
ECONOMIC REGIME: Momentum of Price is so by far the leading factor on 2Q26 Sales beat percentage. It is also one of the factors with the highest spread relative to its own median, which means that in 2Q26 the MoP Sales beat percentage leads not only in absolute terms but also relative to other factors and to its own history. On the top line, the high expectations embedded in Momentum of Price names have so far been justified by the Sales Beat Percentage.
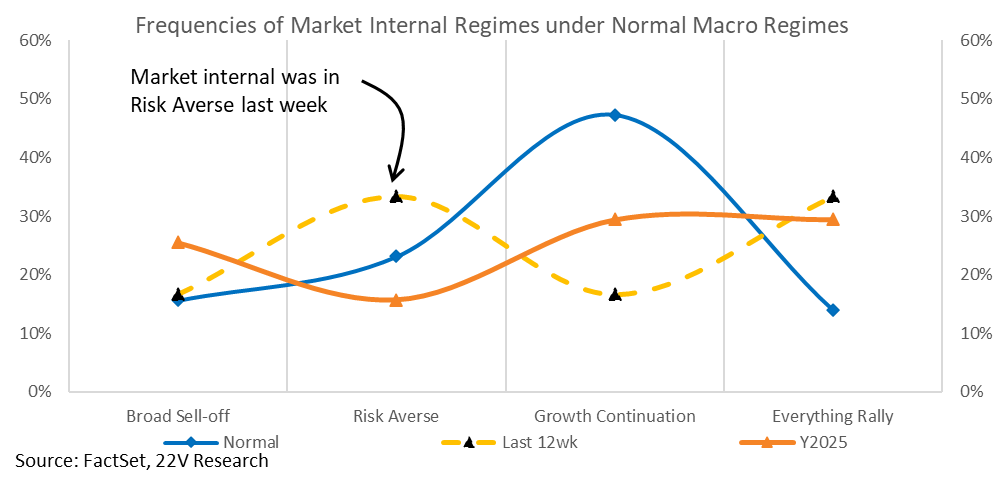
The two most prevalent market internal regimes have been Risk Averse and Everything Rallies over the last 12 weeks. If we are going to get a shift back to an Everything Rally regime (Momentum would be a leader) fundamentals are likely to be a major driver. Our call for the back half of 2026 is for a benign slowing in economic growth (real growth slowing to 2% or below) that comes with less inflation risk.
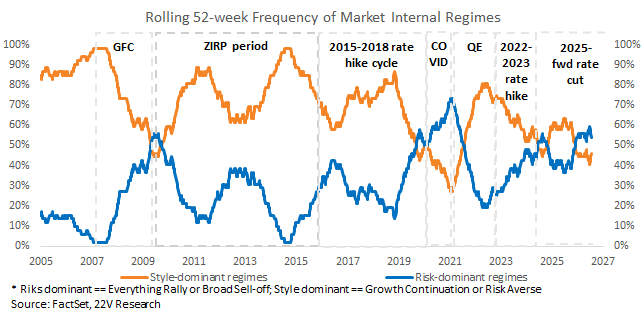
The rolling 52-week frequency of Risk-dominated regimes – Everything Rally + Broad Selloff – has risen to the 89th historical percentile. That is unusual. While Style-dominated regimes – Growth Continuation + Risk Averse – have fallen to its 10th percentile. We expect Style-dominated regimes to become more prevalent, consistent with the historically higher frequency of Growth Continuation during Normal macro environments.
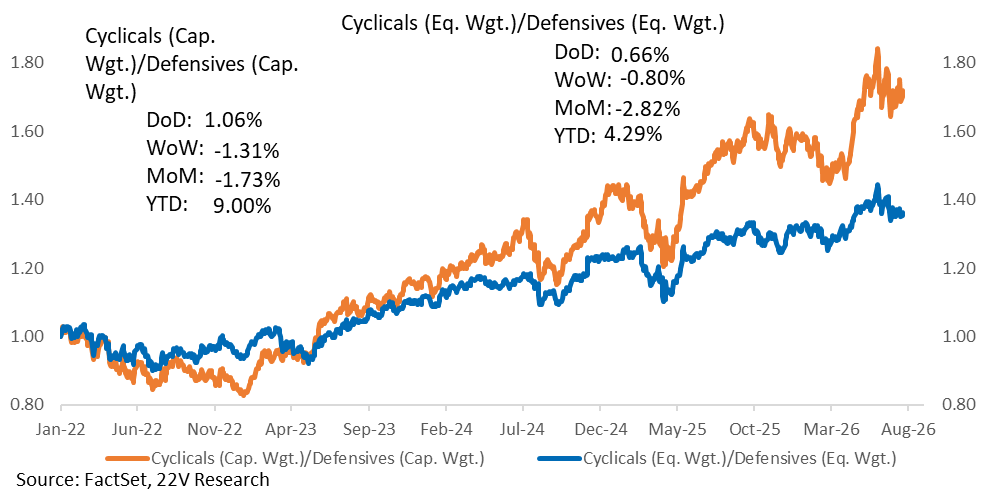
Lower inflation risk (core inflation readings stay below 0.21% MoM going forward) and easing AI EPS concerns would favor a Growth Continuation rotation. Supporting Momentum, Growth, and Risk-on factors, and industry groups within Technology and Discretionary. After the recent MoM correction, long Cyclicals in aggregate vs Defensives (Staples, Pharma and Non AI Utilities and REITS) would make sense.
Conversely, tighter financial conditions (Strait of Hormuz closure is the main near-term asymmetric risk to our call) or disappointing AI earnings would raise the probability of Risk Averse leadership, benefiting Value and defensive exposures and Financials industry groups.
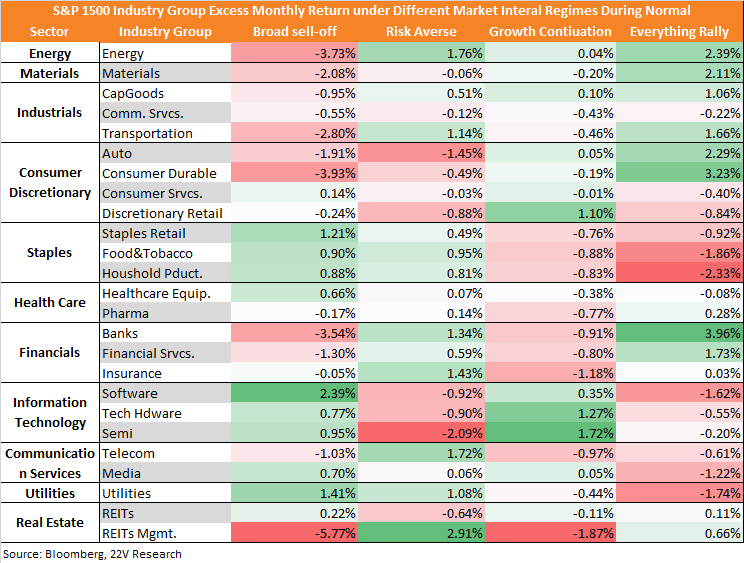
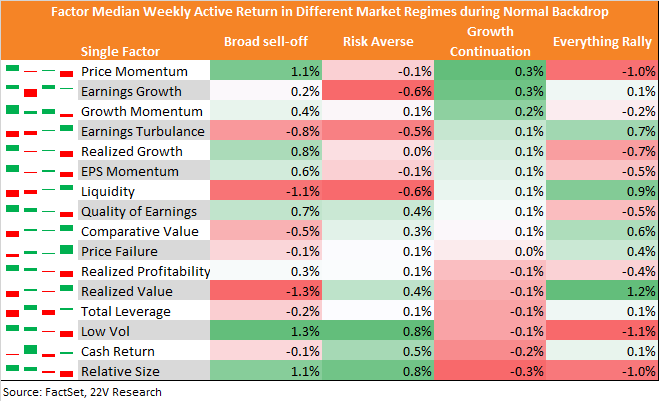
Factors that would work in a Growth Continuation market.
FED SENTIMENT: Our Fed sentiment model, which reads and objectively scores all Fed communications, shows that since Warsh’s first FOMC in June, FOMC members (including Warsh) have become more concerned about inflation and more constructive on the labor market. This helps explain fed funds’ futures sensitivity to oil prices – there’s less tolerance for the passthrough to core inflation from oil. Just as Waller indicated last week.
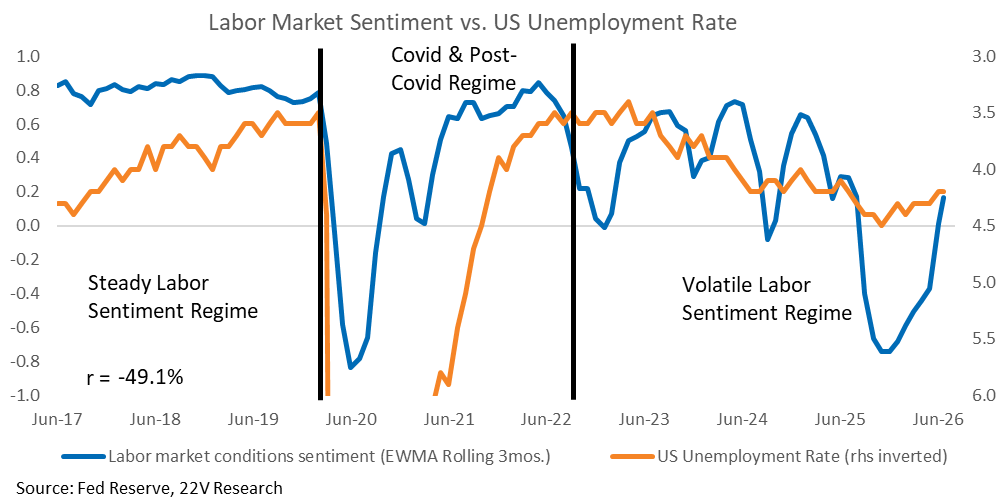
The Fed’s labor market sentiment has “caught up” to hard data.
AI Services – Our AI Services basket stabilized, relative, over the last three months, and earnings could result in idio supporting these companies. In other words, AI Services could be longs even without the risk of financial conditions tightening. During earnings, we would focus on the Service companies that are implementing AI and have above average margin sentiment. They are more likely to deliver EPS beats.
AI ROI INTO EARNINGS: AI ROI will be in focus, along with the other Hyperscaler capex plans, this earnings season. NTM margin estimates are much higher for AI users across most sectors (not just Tech). That should be given the benefit of the doubt.
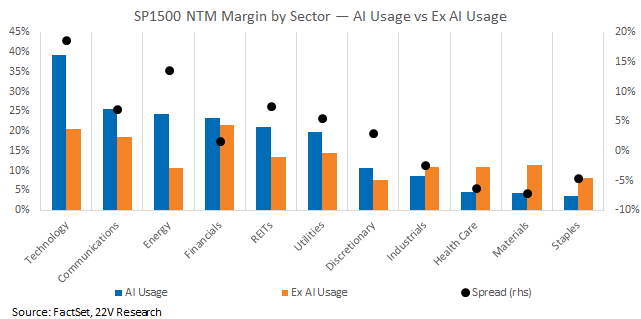
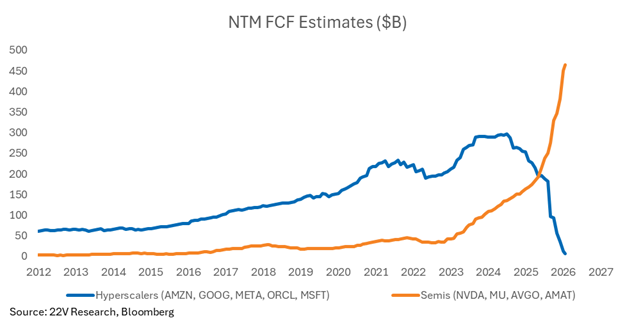
The practical implication of margin expansion related to AI tools, assuming that continues, is high demand for AI tools and increased odds of a high ROI for Hyperscalers AI capex investments. I.e. the Cash flows to Semis as an example (the other side of GOOG capex) will continue.
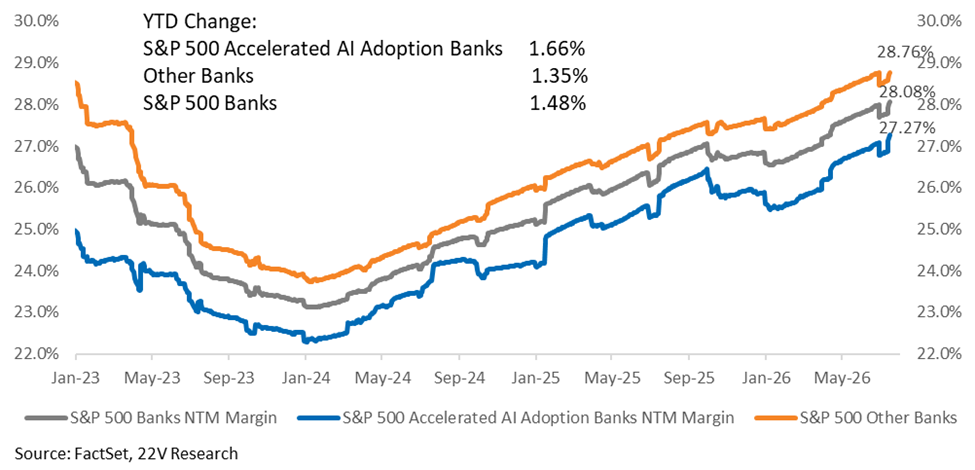
BANKS MARGINS: Margins are trending higher across Bank, but names with higher AI adoption have seen margins improve more rapidly than those of other Banks this year. The strong margin trend is another sign that AI is moving from strategic narrative to operational reality.
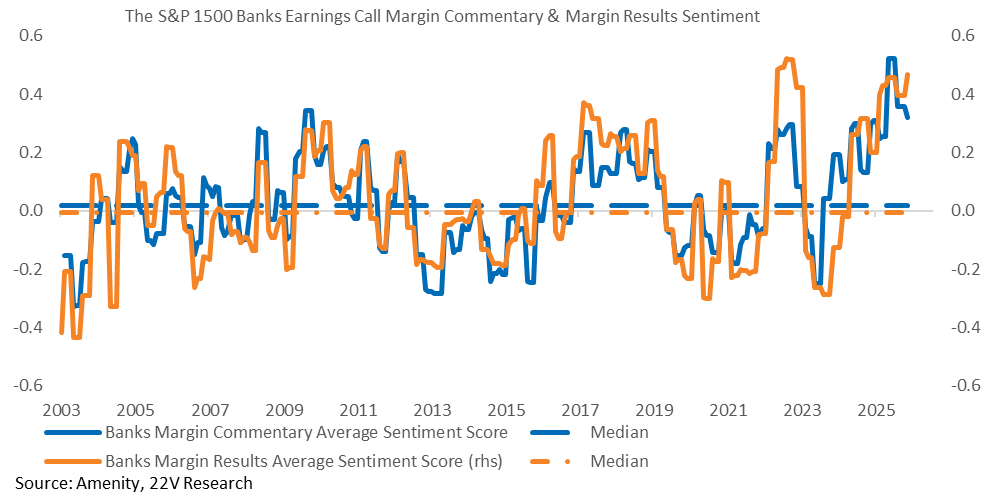
Currently, margin sentiment expressed by Bank management is supportive, reflecting strong bank confidence in current operating margins and the near-term outlook. While forward looking Margin Commentary Sentiment ticked down from its recent high, it remains above any level seen prior to 2025. Margin Results Sentiment ticked up, reaching its highest level since 2023.
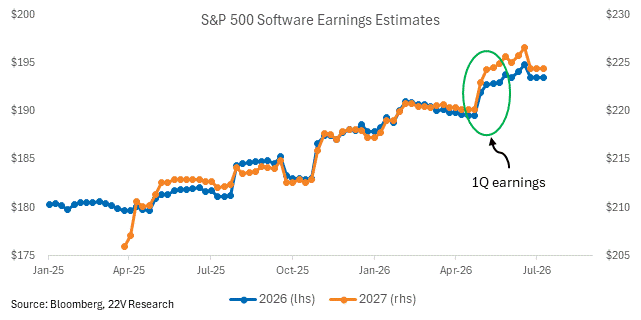
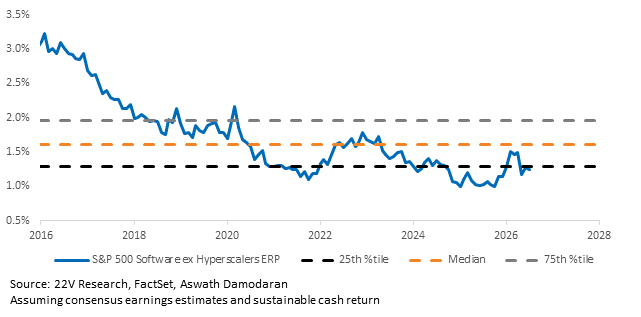
SOFTWARE FAIR VALUE (FULL REPORT HERE): S&P 500 Software ex Hyperscalers are not a compelling long. Valuations are not discounting a particularly unusual hit to earnings and/or cash flow. If some software companies demonstrate effective use cases of AI themselves (using open source models) or moats against AI, there is some upside to the index. That makes it a less compelling short at these levels heading into earnings.
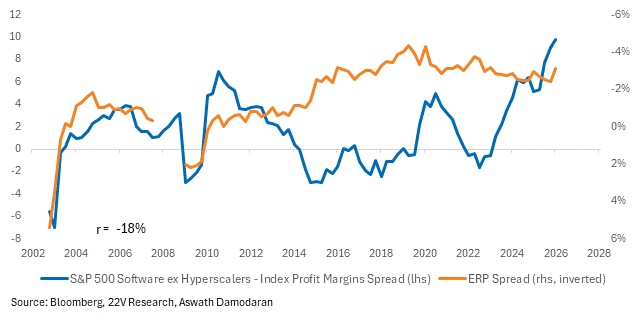
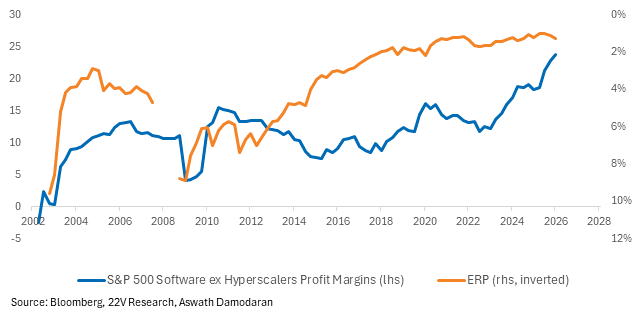
This chart of the S&P 500 Software, ex Hyperscalers equity risk premium (ERP) gives historical context for the move higher in the ERP (consistent with a lower PE).
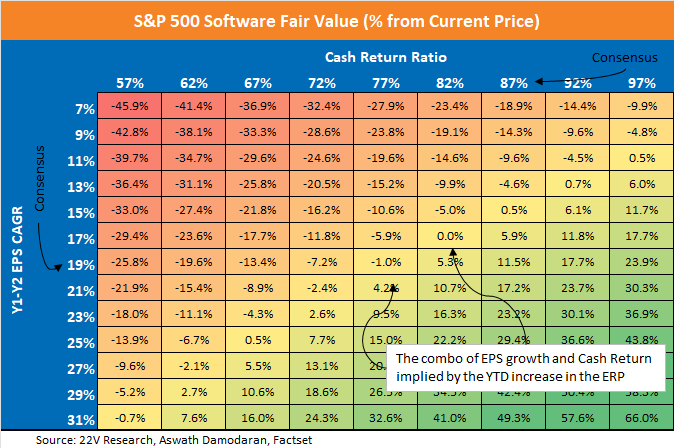
The table below maps out the plausible combinations of earnings growth and cash return. To do this, we set the ERP back to what it was at the start of the year, and back into which combos of EPS and cash return lead to fair value at the current index level. That would be the logic if the increase in the ERP is simply moving ahead of consensus eps and cash return estimates.
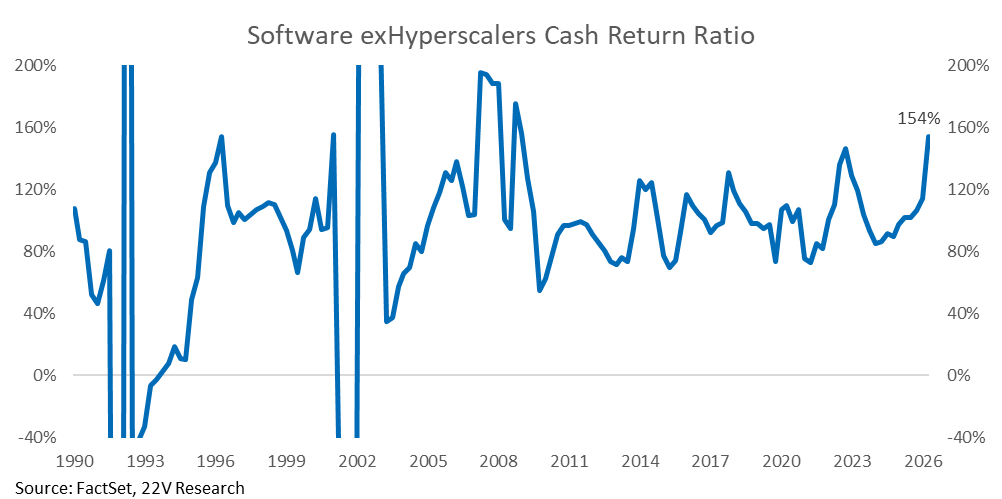
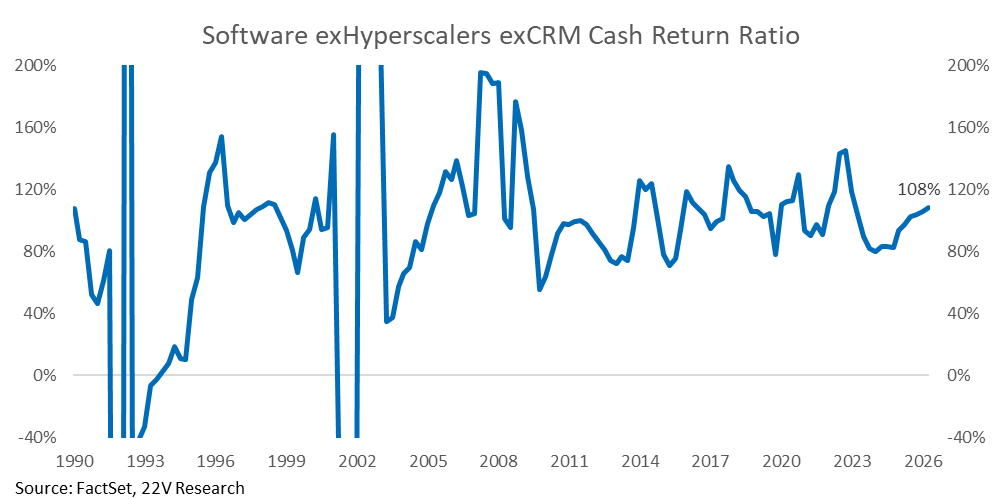
Cash return as a percent of net income rebounded to 154% in 1Q. Most of that rebound was driven by CRM’s $50B buyback, but cash return rebound ex-CRM too. CRM is down -15% since announcing its $50B buyback. Investors are concerned the operating cash flow being used to fund buybacks is at risk. If Software moats are drying up permanently, cash returns should be more permanently impaired relative to history. 1Q helped limit downside scenarios, stabilizing the group, but it didn’t answer questions about sustainability.
Software has gotten more “expensive” as margins have improved since the GFC. If Software margins come under pressure, the ERP will increase, and vice versa.