Weekly – Per the new format, we mark to market our main themes each week. Themes are bolded and market to market follows. This is a big inflation data week.
New Theme (introduced 6/28) – More Asymmetric Downside Risk for Markets: Marking to Market – If core PCE tracks closer to 0.25% – 0.3% going forward, there is meaningful risk of financial conditions tightening and markets coming under pressure. We did not get any incremental data last week, but CPI/PPI is this week and will be a swing factor in how we and investors view the outlook for risk factors in 2H26.
Asymmetric risk was a major topic of conversation during our meetings in London. It seems like investors have internalized this risk, which helps explain why conviction levels in our three group event surveys (40 investors) were low. To be fair, the surveys lean slightly bullish. 7,737 was the year-end average for the S&P 500, but the 10yr call was 4.46%, Brent was $76 and BTC was $62K (London groups were VERY bullish on BTC when we visited last in January). Like us, investors are data watching.
Our call is for a benign slowing of economic growth from 3% to ~2% or below. That would be consistent with 10yr yields in the 4.2-4.5% range and support duration sensitive equities (Tech, Discretionary, Banks, Consumer) and Fundamental Factors.
Marking to Market – Our Conviction in this theme IS LOW NOW, but CPI/PPI data is this week. Our benign slowdown call could have high beta to the CPI/PPI data going forward.
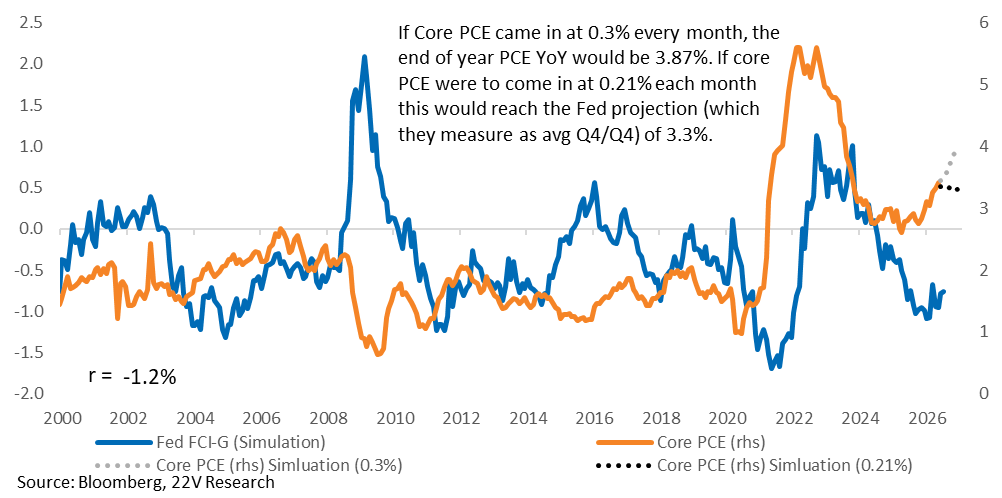
Background – The FOMC minutes reinforced why our conviction is lowered. As Peter Williams pointed out, almost all participants noted that should inflation “remain elevated” policy tightening would “likely be warranted.” This scenario assumed a stable, rather than a retightening, labor market. It also suggests hotter than expected GDP growth and a sub-4.2% urate are not preconditions for tightening. The median forecast at 3.3% for core PCE in 2026 is either not hiking or hiking once, while the extra 20bps to 3.5% aligns with 2-3x hikes this year. The gap between the median and the 2-3x hike contingent is quite fine. If Core PCE comes in at 0.3% MoM for 2H26, vs the 0.21% to hit the Fed’s forecast, Core PCE would be 3.9% (3.87%).
The economic strength in June, particularly consumer data, suggests upside vs downside risk to the CPI/PPI data. Predicting CPI/PPI and what that implies for Core PCE inflation is VERY tough in normal times. Various supply shocks and surprising economic strength make it even harder to predict now. Hence our lowered conviction into CPI/PPI prints.
What is Being Priced Longer Term – A benign slowing in economic growth and inflation is being priced, which is consistent with the 22V base case for 2H26. Concerns over a prolonged Fed tightening cycle have increased, helping contribute to the unusual volatility in the Price Momentum factor. But investors are not discounting the Fed explicitly attempting to slow demand growth by tightening financial conditions. If this was being priced, risk assets would be significantly lower.
Data That Support Our Base Case – Our macro regime model continues to classify the current environment as a Normal expansion (HERE), with both macro and market conditions well within their historical ranges. This backdrop favors fundamental factors (Value, Earnings Momentum, GARP) which have all benefited. The VIX ended last week at 15 and Moody’s BAA-AAA spreads are near their tightest level in more than four decades. It is unusual to see sustained sharp credit spread widening during Normal expansions periods. Healthy corporate fundamentals, and low recession risk continue to support a constructive outlook for equities despite elevated near-term inflation uncertainty.
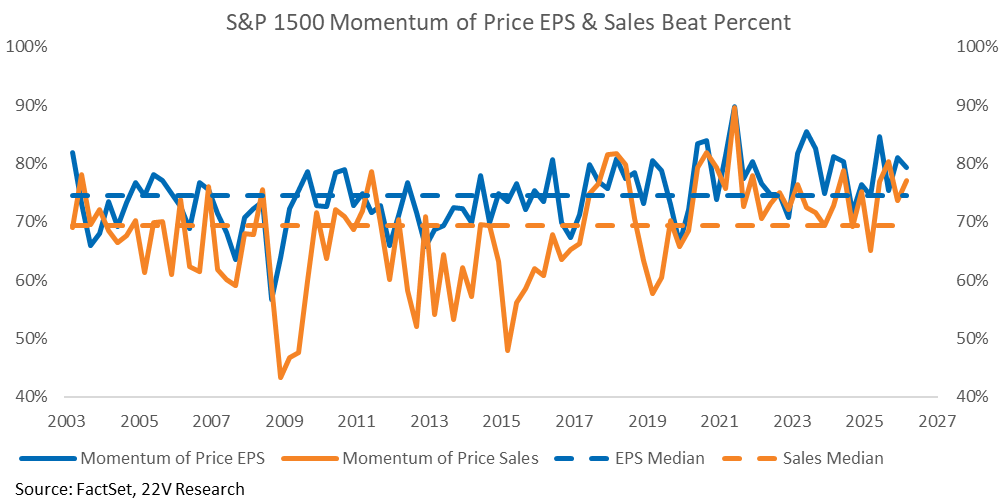
Under the current Normal expansion, sales and margins should continue to expand during the upcoming 2Q reporting season, and economic trends favor stronger than expected for revenue and EPS readings. We remain long AI capex beneficiaries (Price Momentum), longer term and non-AI related Cyclicals, like Retail stocks, Regional Banks, Airlines, Transports and Homebuilders.
FYI – In our last Weekly (6/28) we noted that the last ~4 weeks of outperformance of Non-AI related Cyclicals should continue. That hasn’t happened. It’s been more mixed for the Non-AI related Cyclicals as 10yr yields increased from 4.37% to 4.56% and Strait Of Hormuz uncertainty increased. The 10yr yield at 4.5%, for the right reasons (more below), is not a problem for Non-AI related Cyclicals.
Nuance To the Above – Peter Williams estimates 10yr fair value is moving toward 4.5% (from 4.5% being the high end of the range). This estimate is based on the rebound of demand indicators, not Iran. How internals react to the 10yr depends on reasons for the move. Peter’s updated views are based on a higher neutral rate + a mild degree of restrictiveness. The practical implication is that the 4.5% 10yr yield line in the sand (4.5% or above has led to Defensive Sectors and Low Vol factors outperforming post Covid) should increase over time as the market digests a higher neutral rate. Strong productivity growth would be associated with a higher neutral rate.
If we are correct, 4.7% or above on 10yr yields is likely to be more restrictive for economic growth, and lead to risk-off factors leading, vs the 4.5% level.
Risk – If the 10yr yield moves well above 4.5% because CPI/PPI data is hotter than expected, that would be a problem for our long Cyclical Sectors and Fundamental factors (Value, EPS Momentum, Growth Momentum, GARP) calls.
Theoretical Inflation Debates Are MUCH less Useful Now. Follow The Data – Marking to Market – The FOMC minutes reinforced our view. Some investors have noted that the prospects of disinflation, in the future, could lead the Fed to hold off on rate hikes. We strongly disagree. As the minutes highlighted (HERE), AI related investments are serving as an upside source of pressure on rates and inflation “due to strong AI-related demand.” AI is also playing a role in easing financial conditions. Even the optimists noted that “those investments would likely increase the growth of productivity and of potential output in the coming years. These participants remarked, however, that considerable uncertainty remained regarding both the timing and magnitude of potential productivity gains, which were expected to lag the ongoing boost of AI adoption on demand.” Bottom line, if the Core PCE inflation data points to well above 3.3% for 2026, expect a hike. Consistent with Fed Chair Warsh attempting to maintain price stability credibility.
AI Idio Is Supportive Based on Demand for AI tools Being Robust Longer Term – Marking to Market – Momentum and high Earnings Vol have had a string of very strong earnings seasons. IF inflation is benign, then idio will matter more during earnings season. There could be a fundamentally-driven rebound in performance. Also, the focus for us is value creation. The current level of margin sentiment suggests an INCREASE in margins in 2Q26 (AI value creation). Unless margin sentiment or actual margins decline, it will be difficult to be short Price Momentum and AI demand beneficiaries longer-term.
Charts related to the comments above are below…
INDICATORS:
NORMAL ECONOMIC REGIME: The Quant team’s economic regime classification model is still classifying the current environment as a normal economic expansion (HERE). One of the practical implications is avoiding base rate neglect. Nearby recession odds remain very low and strong fundamental trends are driving market gains.
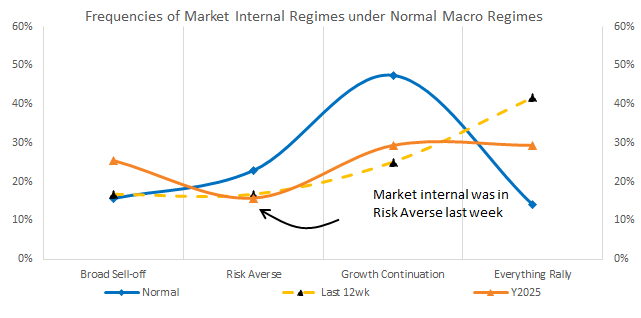
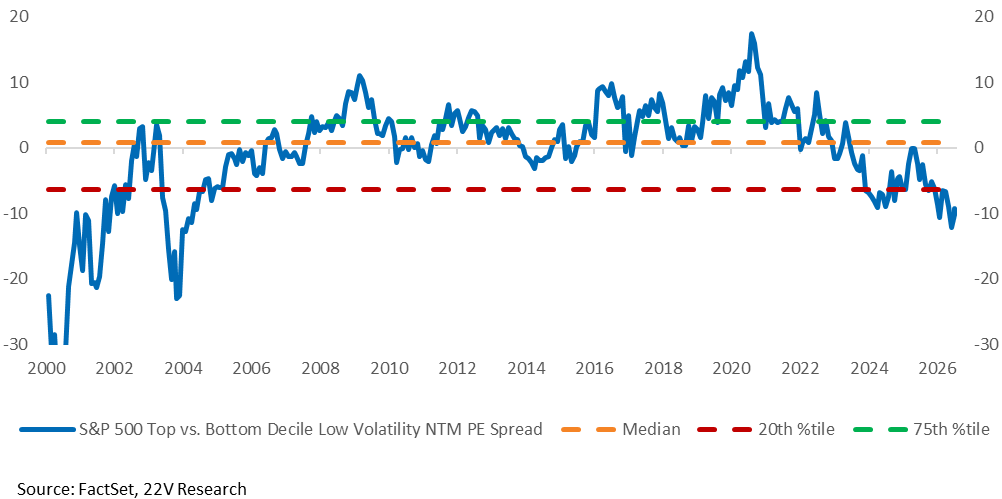
Asymmetric downside risk is higher, but we would not go long risk-off factors or Defensive sectors (Staples, non-AI Utilities), despite their relatively “cheap” valuations and the possibility that financial conditions tighten. given a stable economic expansion and a fundamentals-driven market, the burden of proof is on the risks to the cycle playing out (inflation runs hot for many months).
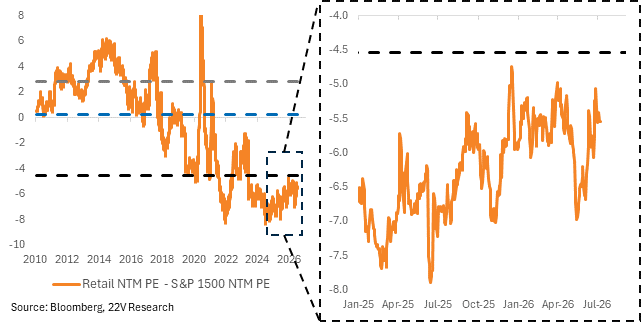
There is more asymmetric upside in the non-AI cyclicals that have lagged AI cyclicals YTD (Banks, Retail, Homebuilders, Transports) and fundamental factors (Earnings Momentum vs Price Momentum).
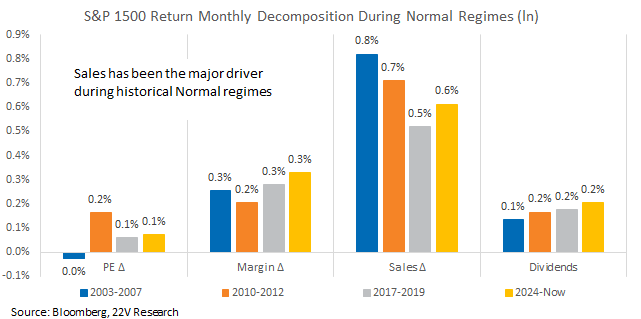
The driver of index gains during Normal expansions has been improving corporate fundamentals, particularly sales growth, while margin expansion provided additional support. That is in line with strong earnings expectation this year. Consensus puts S&P EPS for CY26 at $343, +25% y/y.
YIELDS: Higher yields driven by stronger inflation remain the key headwind for markets, making next week’s CPI and PPI critical. We don’t expect higher than expected inflation readings in part because the labor market does not appear to be an inflationary impulse (HERE). Measures of slack have not tightened meaningfully (HERE). But we need to follow the data.
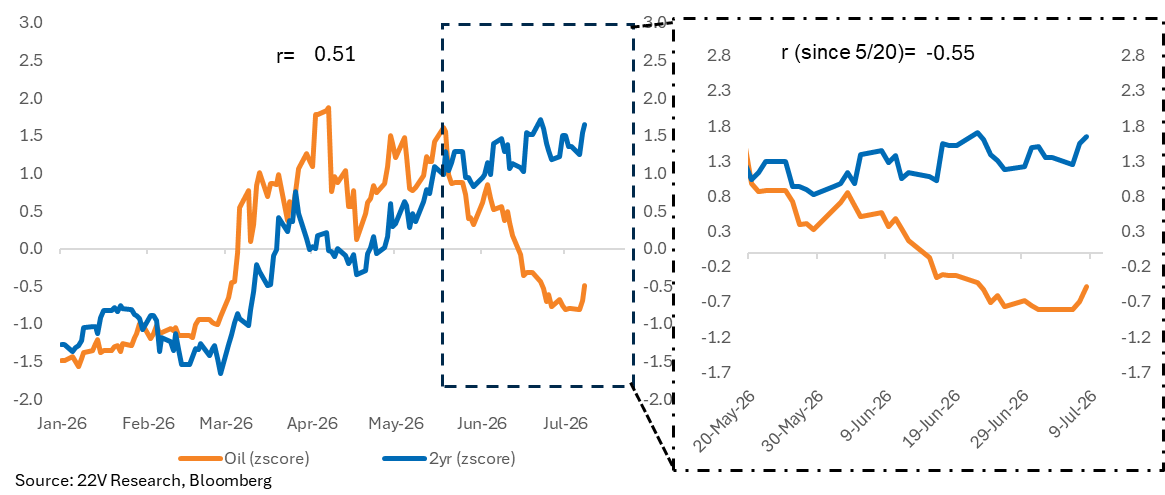
Peter Williams estimates 10yr fair value is moving toward 4.5% (from 4.5% being the high end of the range). This estimate is based on the rebound of demand indicators, not Iran. Peter raised his estimated based on a higher neutral rate + a mild degree of restrictiveness. Yields had diverged from oil as nominal demand seems to have bounced. There is more upward pressure on yields now than during the last round of increased Iran tensions.
IF CPI and PPI releases next week imply >0.3% core PCE, yields are biased higher and there is downside risk to indices, Cyclicals, and risk-on factors (pure Momentum, high Earnings Vol, high Debt Risk, Unprofitable names). IF CPI and PPI imply <0.3% CPCE, it will reinforce our notion of a higher neutral rate, and there is upside to those factors even at current 10yr yield levels.
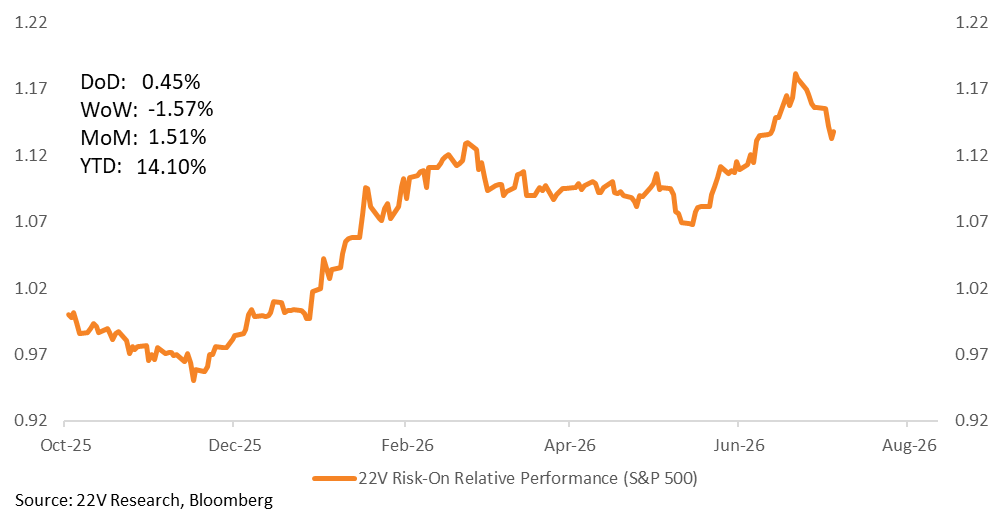
Momentum and high Earnings Vol have had a string of very strong earnings seasons. IF inflation is benign, then idio will matter more during earnings season. There could be a fundamentally-driven rebound in performance.
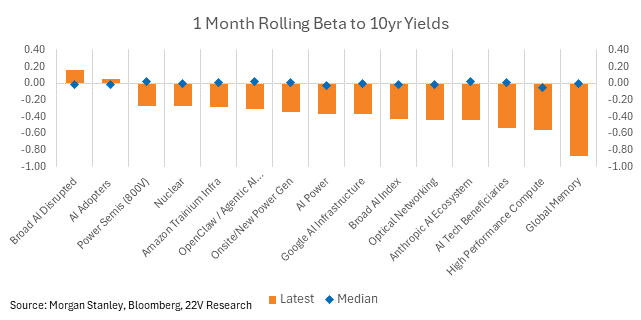
The internals of the AI theme are becoming increasingly rate sensitive too, largely tracking Momentum exposure. IF higher yields are associated with higher inflation, there is a larger headwind to AI baskets than usual.
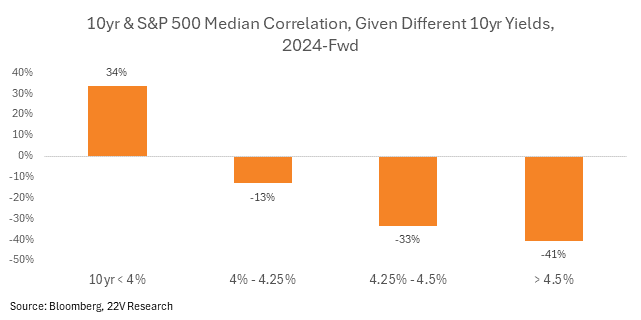
S&P FAIR VALUE & 10YR: The S&P 500 is increasingly negatively correlated to 10yr yields after yields increase over 4.5%. We suspect higher yields won’t be a medium-term headwind given they are moving higher partly to reflect a higher rate of neutral, rather than restrictive policy.
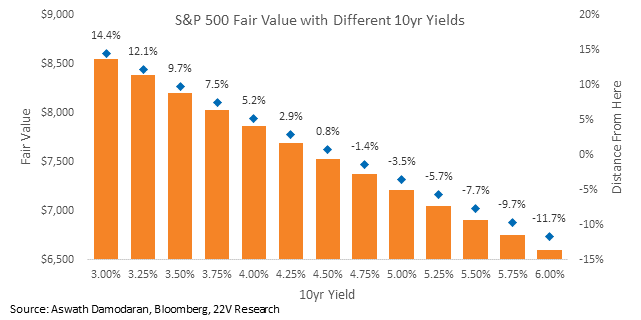
S&P 500 Fair Value based on different 10yr yields is below. Higher yields are a headwind via a higher discount rate and a lower cash return ratio. More earnings must be retained to grow earnings at the risk-free rate. The headwind is small in magnitude; the 10yr yield moving from 4.25 to 4.5% shaves -2pp from Fair Value. That is inconsequential compared to earnings growth.
MOMENTUM DRAWDOWN: We have been focusing on hedging Price Momentum over short-term horizons, given the vol in Price Mo because of the risk financial conditions need to tighten. Price Momentum’s drawdown, at -19% (S&P 1500, unconstrained), is a 93rd percentile drawdown.
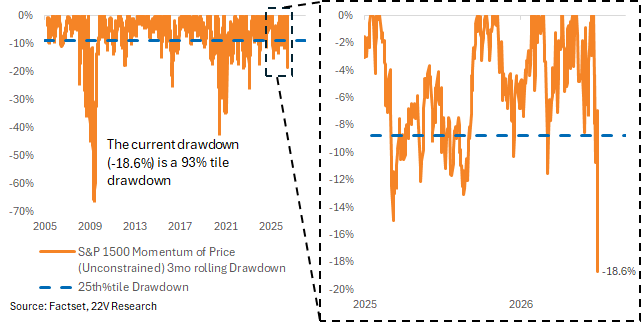
The forward returns of Momentum after similar drawdowns are still lower than normal, even after removing recessions from the sample. Hedging is still a point of emphasis.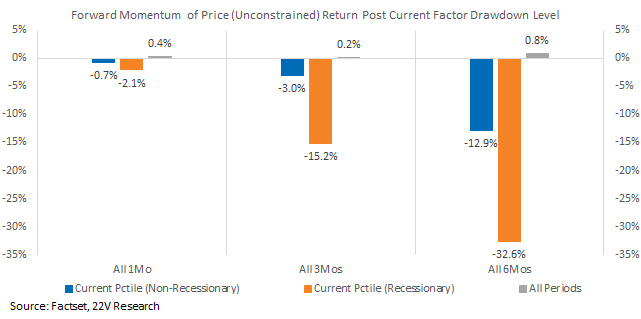
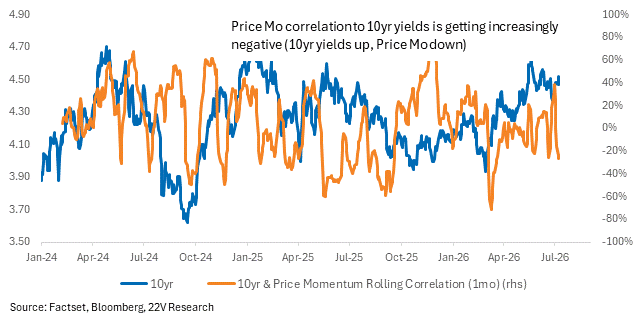
Price Momentum correlation to 10yr yields is increasingly negative (10yr yields up, Price Mo down). As such, hedging remains in focus.
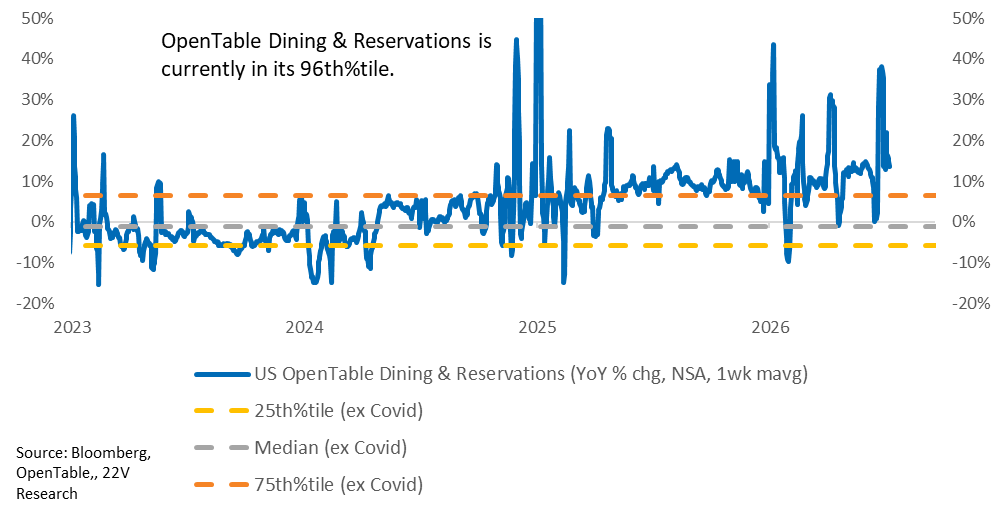
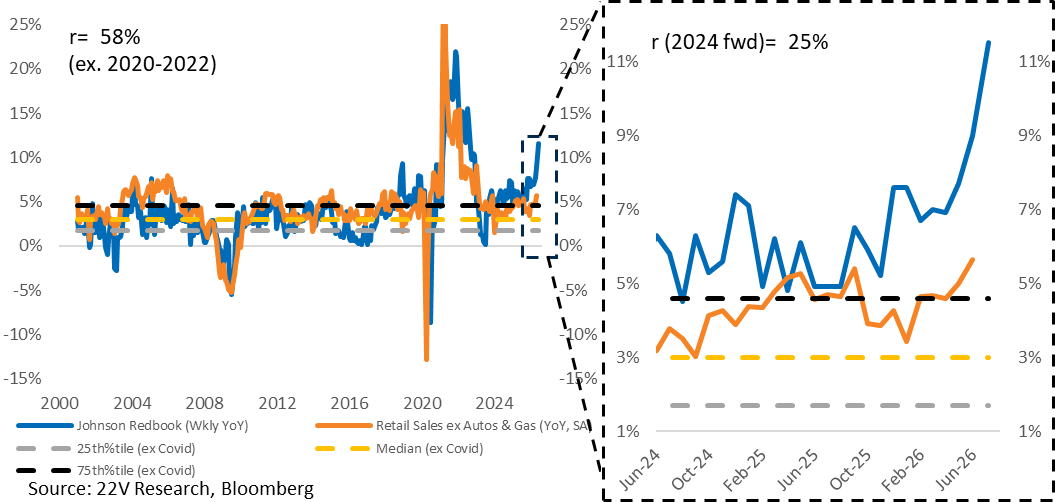
CONSUMER DATA: High frequency indicators of demand are inflecting higher. OpenTable dining reservations are trending higher.
Redbook same store sales are now at 11.5% YoY.
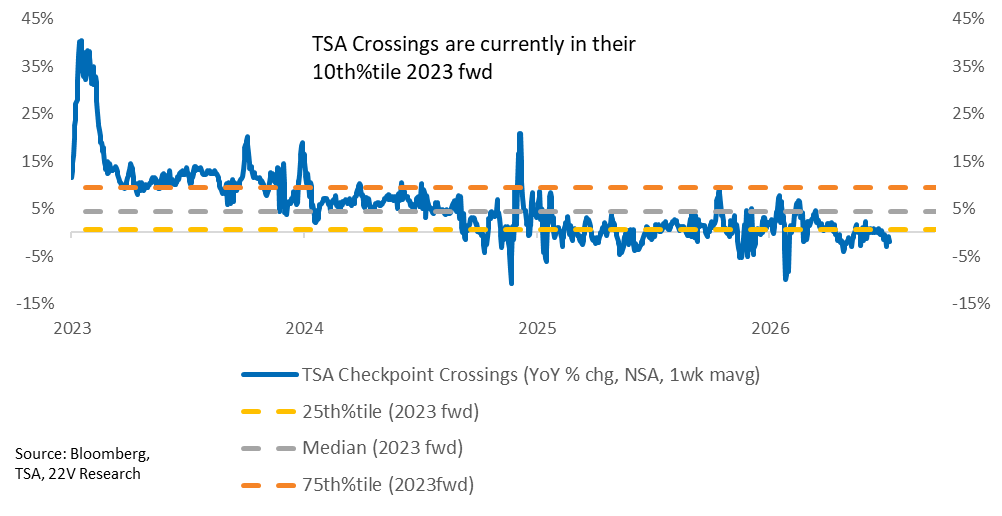
TSA checkpoints crossings are flat YoY despite higher ticket costs and Spirit Airlines going out of business. FYI, Airlines are talking about how they aren’t lowering prices because demand has been so surprisingly strong (HERE).
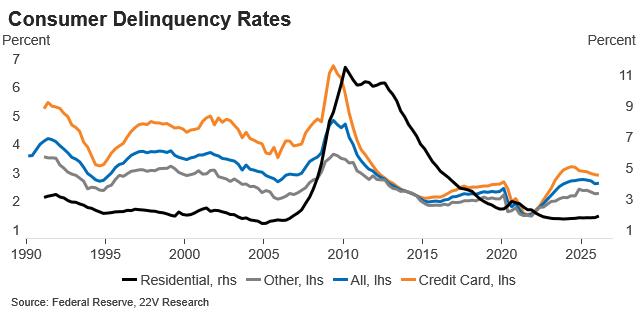
Consumer balance sheets look great, delinquencies are flat-to-down, and nominal income growth is solid-to-strong.