Back Economics

Sticking with view that slack increased somewhat

Published on July 2, 2026

Download the PDF Report

By

Gerard MacDonell

There is a slight tension between my overall macro view and my take on the implications of today’s employment report. For example, my take on the inflation situation is much closer to Mary Daly’s than to, say, Kevin Warsh’s. Daly says that inflation should moderate but that there is some uncertainty around that take, I assume in part, because inflation is high — and for reasons we do not fully understand. We ought not dismiss data we do not fully understand. Indeed, such data are the most incremental. And what we know is that inflation has recently been accelerating, for reasons that cannot be related just to tariffs or to the Iran conflict.

There is little question that the job gains part of the employment report were weak. I tend to pay less attention to the distribution of the job losses than others do, in part because I am never quite clear which sector we are supposed to view as the “good” or “important” one. If the data show that the labor income proxy missed, then the job weakness was not likely in low wage sectors, or at least that did not dominate.

Nice tight story, too bad it’s wrong
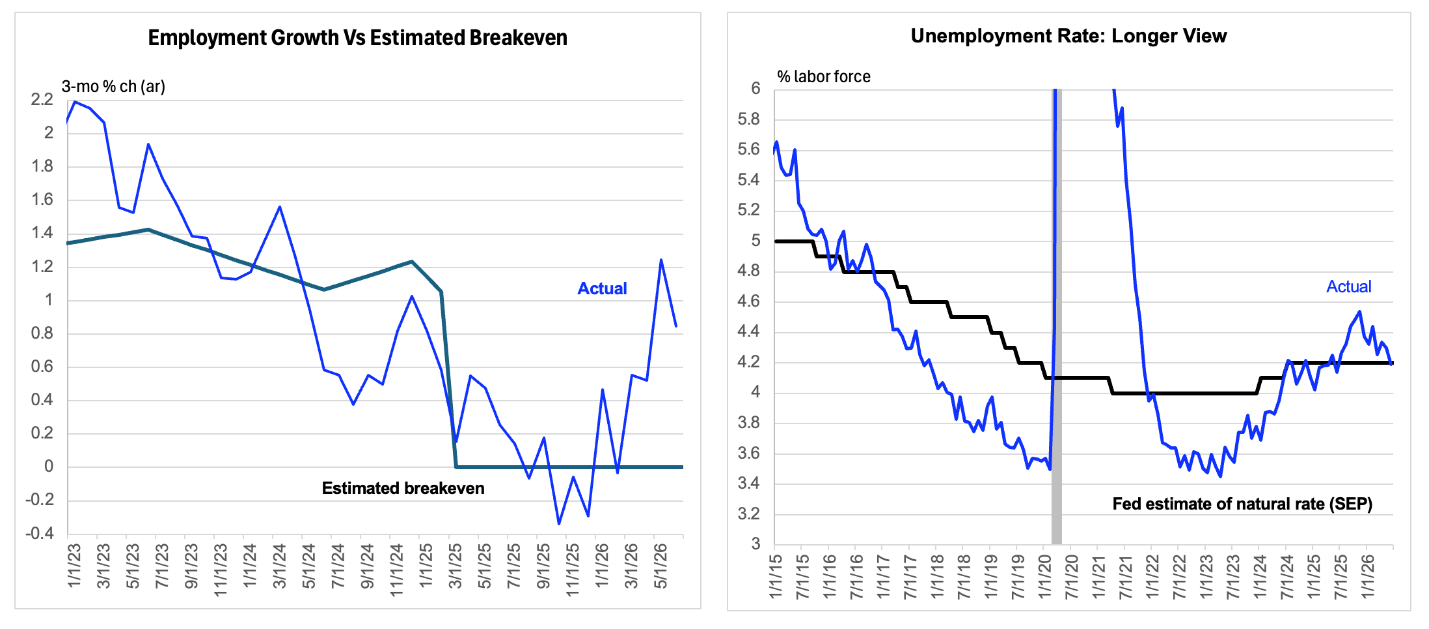
Source: Federal Reserve Bank of St. Louis (FRED), Federal Reserve, FH calculations and inferences from Wendy Edelberg’s work
Labor market data are actual to June 2026.

What is more debatable and controversial this morning is how to think about the combination of the decline in the unemployment rate and employment/population ratio. The decline in the employment/population ratio was much steeper than the decline in the unemployment rate, so even if we think the unemployment rate is the better measure (which I don’t, especially at short horizons), then the net net would probably be that the labor market eased, against an expectation of a slight tightening, before rounding.

Let’s start with the relatively hawkish interpretation. In recent months overall employment growth has been meaningfully positive in an environment in which the estimated breakeven employment growth rate has been around zero, although with some hair on that estimate. And accordingly, the unemployment rate has been dutifully declining. If we step back and take these trends over a year window, we see the following. The unemployment rate is roughly unchanged with establishment employment growth running at 0.3%. That would tend to confirm that the breakeven has fallen a lot, although we can argue about 30 bps. And in June in isolation, the unemployment rate did fall 11 basis points, which is actually more tightening than would be expected if both the employment breakeven growth rate were zero and actual employment growth were precisely measured. So, that is the labor market tightened perspective. And it is quite coherent, if I may say! 😉

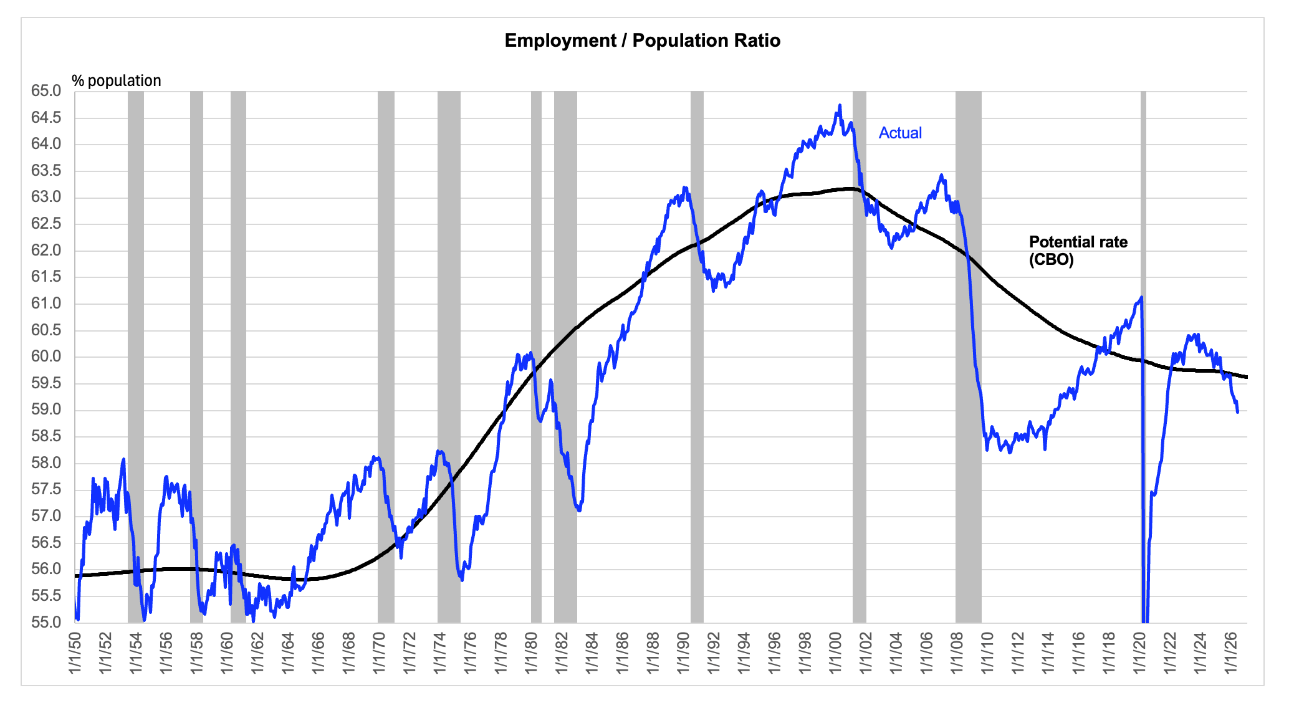
The problem with this nice tight story is the labor market tightening is being driven entirely by the labor force participation rate collapsing. Sometimes, the collapse is in one age cohort that we might want to dismiss. And sometimes it is in another, as this month, which we might also want to dismiss. But what we cannot dismiss is this straight line decline in the employment population ratio. During June the trend continued with the e/pop dropping 0.36%, not percentage points. Even if half this decline is structural, reflecting early retirement or whatever, we still wind up with a huge decline of the cyclical component of the participation rate, which by definition means the labor market eased, subject only to the cyclical share assumption being correct. So, on the balance of the evidence, I do with ease. Separately, with positive employment growth the labor market is supposed to tighten.

Even if this is only half cyclical, it still trumps lower UR
A graph showing the growth of population

AI-generated content may be incorrect.
Source: Federal Reserve Bank of St. Louis (FRED), CBO, NBER, FH calculations
Labor market data are actual to June 2026.

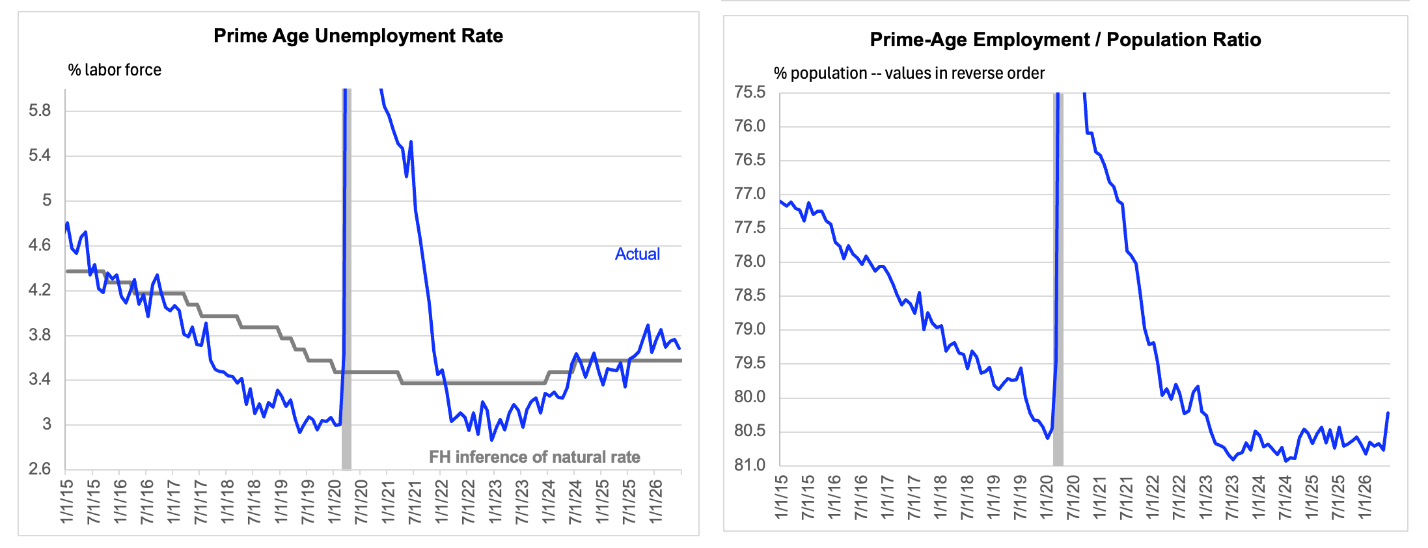
Some folks like to focus on developments in the prime age slice, both because these workers matter more for being relatively-high wage/productivity and because short run swings here are less likely to be noise. I am sympathetic with that take, while sticking as always to the mosaic approach which emphasizes the importance of being less wrong. This month, the employment / population ratio among prime age fell twice as steeply (in %, not ppt) terms) as the overall. So for those leaning particularly heavily on this slice, the development on the month was even more extreme. These data are volatile month to month, so it is easily conceivable that there is some noise here in the level and / or that this softening actually occurred a bit earlier and is just being picked up now. But it seems pretty obvious that the mean of the probability distribution describing our sense of tight / loose in the labor market moves toward the looser side in the wake of these data. It does not overturn the basic macro story, but on jobs day it might be good to start with the incremental new news. I guess Mr. Market figured this out pretty quickly.

Concentrated in the part folks are less inclined to dismiss

Note that employment / population ratio is shown on reverse scale
A close-up of a graph

AI-generated content may be incorrect.
Source: Federal Reserve Bank of St. Louis, Federal Reserve (for basis of crudely estimated natural rate), NBER, FH calculations
Labor market data are actual to June 2026.

My point is not that the expansion is at risk. Prospective growth is determined more from the speed limit than from the demand side. And evidence of increased slack does not imply a weaker speed limit. This is more about the incremental news for rates.


DISCLOSURES AND DISCLAIMERS

Analyst Certification

The analyst, 22V Research Group, primarily responsible for the preparation of this research report attests to the following: (1) that the views and opinions rendered in this research report reflect his or her personal views about the subject companies or issuers; and (2) that no part of the research analyst’s compensation was, is, or will be directly related to the specific recommendations or views in this research report.

Analyst Certifications and Independence of Research.

Each of the 22V Research analysts whose names appear on the front page of this report hereby certify that all the views expressed in this Report accurately reflect our personal views about any and all of the subject securities or issuers and that no part of our compensation was, is, or will be, directly or indirectly, related to the specific recommendations or views of in this Report.

22V Research (the “Company”) is an independent research provider. The Company is not a member of the FINRA or the SIPC and is not a registered broker dealer or investment adviser. 22V Research has no other regulated or unregulated business activities which conflict with its provision of independent research.

22V Research, LLC is a professional services and independent publication organization. 22V Research, LLC is not a securities broker-dealer, not a member of the Financial Industry Regulatory Authority (FINRA), not a registered investment advisor (RIA) and not a member of SIPC.

Securities transactions, when offered, are offered by 22V Securities, LLC through LPS Capital, LLC. Certain employees of 22V Securities, LLC are dually registered as securities representatives of LPS Capital, LLC or Analyst Hub Securities, LLC. 22V Securities, LPS Capital and Analyst Hub Securities are members FINRA, SIPC.

https://brokercheck.finra.org/

Current Ratings Definition.

SECTOR OUTPERFORM: An “outperform” rating anticipates the company will outperform the S&P Regional Banking Index (peer group).

SECTOR PERFORM: A “market perform” rating anticipates the company will perform in line with the S&P Regional Banking Index (peer group).

SECTOR UNDERPERFORM: An “underperform” rating anticipates the company will underperform the S&P Regional Banking Index (peer group).

Limitation Of Research And Information.

This Report has been prepared for distribution to only qualified institutional or professional clients of 22V Research Group. The contents of this Report represent the views, opinions, and analyses of its authors. The information contained herein does not constitute financial, legal, tax or any other advice. All third-party data presented herein were obtained from publicly available sources which are believed to be reliable; however, the Company makes no warranty, express or implied, concerning the accuracy or completeness of such information. In no event shall the Company be responsible or liable for the correctness of, or update to, any such material or for any damage or lost opportunities resulting from use of this data. Nothing contained in this Report or any distribution by the Company should be construed as any offer to sell, or any solicitation of an offer to buy, any security or investment. Any research or other material received should not be construed as individualized investment advice. Investment decisions should be made as part of an overall portfolio strategy and you should consult with a professional financial advisor, legal and tax advisor prior to making any investment decision. 22V Research Group shall not be liable for any direct or indirect, incidental or consequential loss or damage (including loss of profits, revenue or goodwill) arising from any investment decisions based on information or research obtained from 22V Research Group.

Reproduction And Distribution Strictly Prohibited.

No user of this Report may reproduce, modify, copy, distribute, sell, resell, transmit, transfer, license, assign or publish the Report itself or any information contained therein. Notwithstanding the foregoing, clients with access to working models are permitted to alter or modify the information contained therein, provided that it is solely for such client’s own use. This Report is not intended to be available or distributed for any purpose that would be deemed unlawful or otherwise prohibited by any local, state, national or international laws or regulations or would otherwise subject the Company to registration or regulation of any kind within such jurisdiction.

Copyrights, Trademarks, Intellectual Property.

22V Research Group, and any logos or marks included in this Report are proprietary materials. The use of such terms and logos and marks without the express written consent of 22V Research Group is strictly prohibited. The copyright in the pages or in the screens of the Report, and in the information and material therein, is proprietary material owned by 22V Research Group unless otherwise indicated. The unauthorized use of any material on this Report may violate numerous statutes, regulations and laws, including, but not limited to, copyright, trademark, trade secret or patent laws.