No Fireworks for the June Employment Report
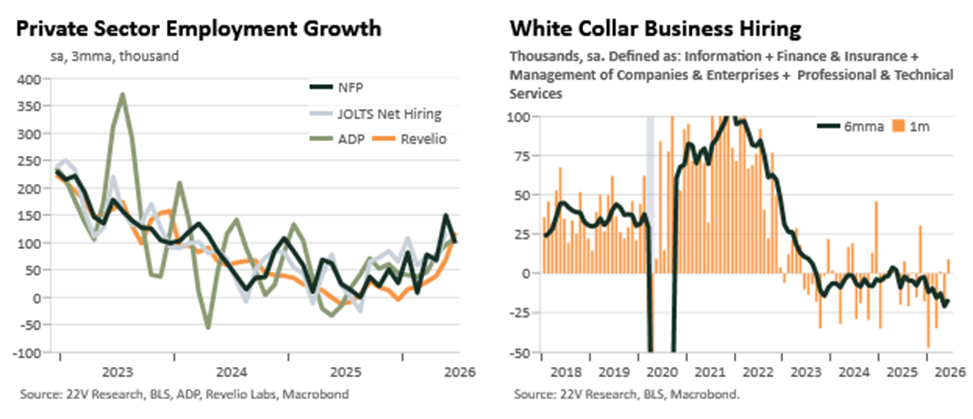
- After accelerating through most of the spring, NFP growth sharply decelerated in June (+57k) and saw notable downward revisions to the prior months. The breadth of hiring still looks decent and we saw the best month (still soft) of white collar job gains since Nov.
- Outside of health care, wage growth seems to gradually stabilizing or perhaps slowly reaccelerating across the economy.
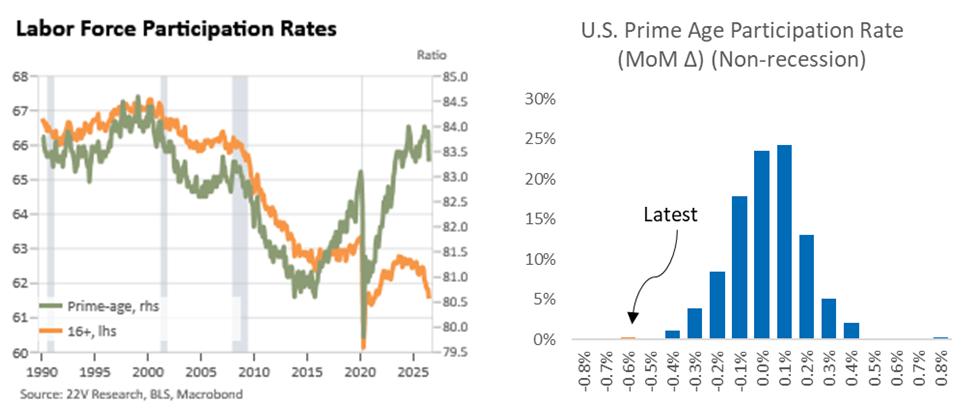
- The household survey seems quite wonky. The urate dropped to 4.19% even as the prime-age employment to population rate sharply fell. LFPR surprised sharply to the downside (98th %ile move), largely due to 25-34yo, in what seems like statistical noise.
- Given a 4.2% urate, NFP trend around 100k, and wage growth that seems steady enough those with more hawkish views seem unlikely to change them in response to this one release. The market was right to see this as making the economic case for July less likely (to me, July has always been much more about a choice to reestablish preemptive hawkish credibility more than the m/m data flow), but it does little to change the odds that we eventually start to hike.
Hiring trends have been quite volatile in recent months. The underlying pace now seems a bit more consistent, on a 3mma basis, with the signal from the ADP, Revelio, and JOLTS data all of which had been closer to 100k than the 188k 3mma that had been reported by NFP as of the prior release.
Sectorally, healthcare continues to lead but decelerated on the month. Leisure and hospitality’s strength in May whipped down to -61k in June, on what seems to be odd Memorial Day-related seasonals far more than World Cup related demand not being realized. I wouldn’t read much into this given the extreme strength related to travel demand we’ve heard from corporates through (write up from May here, with a bit more recent color here) and very strong OpenTable and TSA data. Spirit’s bankruptcy and war-related volume declines could be playing a bit of a role here as well, but nothing from corporates suggests soft or even softening travel demand, Broader cyclical hiring seems mildly positive in recent months, and breadth is above 50 but well below the usual pace during an expansion (as should be expected if breakeven payroll growth is quite close to 0). White collar hiring saw its best, and only second positive, month of the year. Softness there seems to have been worst around the turn of the year, which also lines up with what S&P1500 earnings call transcript show; on that front Q2 showed the fewest layoff mentions since mid-2022.
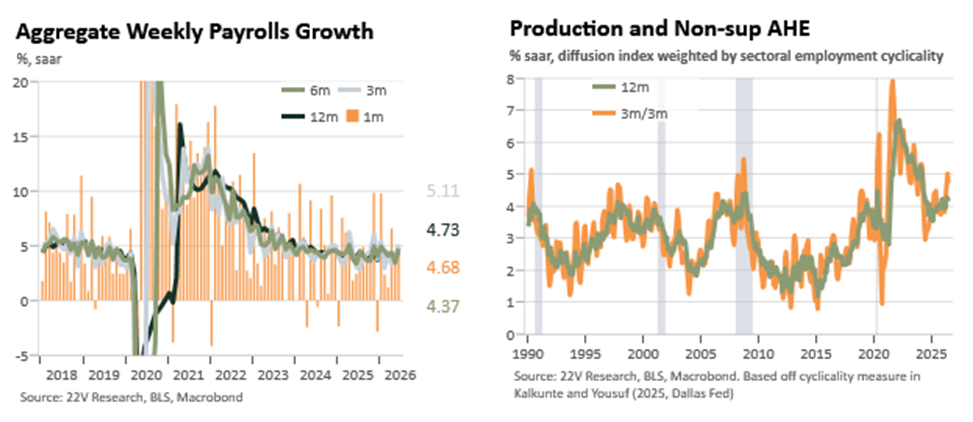
Wage growth has been decelerating a bit for much of this year on a topline basis that has overstated the degree of downside cyclicality there. Aggregate take home pay growth seems to have troughed and seems steady around 4.5-5% now. Much of the topline decline has been due to health care wages which are much more policy driven than cyclical. Our measure of cyclical wage growth, which is a diffusion index that weights sectors based on their employment cyclicality, has cooled a bit in recent months but shows a clear bottom and reacceleration over the past year.
The household survey told a messier and noisier seeming story. The unemployment rate dropped to 4.19%, from 4.30%. This was largely due to an oddly large drop in the labor force participation rate. The overall decline with in the 98th-%ile. This drop was largely concentrated in 25-34 year olds, which raises some quite obvious questions about sampling issues or just noise, as school related seasonal issues seem much less likely to apply. I am very skeptical that one of the largest ever drops in the prime-age employment to population ratio and participation rates took place in any real underlying cyclical sense; since the early 1960s, the 0.6% fall in the PALFPR ties for the largest ever monthly drop outside of covid and is by far the worst ever non-recessionary print.
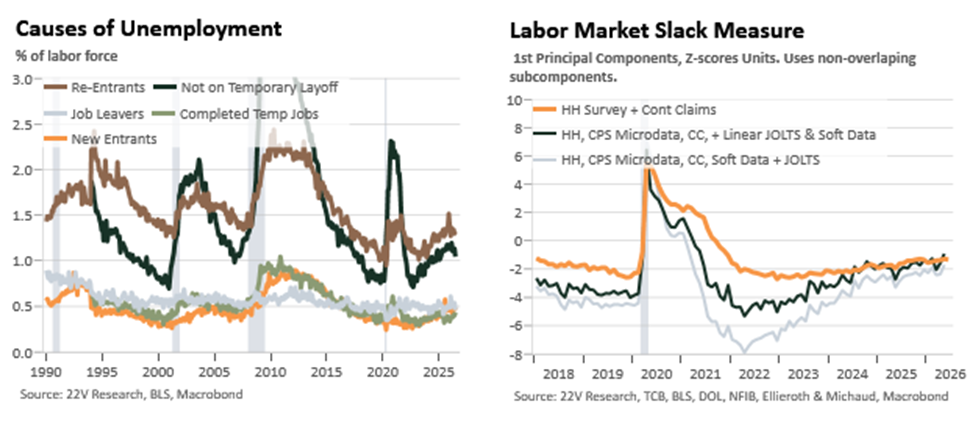
Other less obviously impacted measures of slack looked ok though. The unemployment rate was down but with the necessary caveats around participation rates and employment levels above. The composition of those unemployed has been improving across categories with the exception of workers on temp layoff; the largest drivers of the urate over the cycle are labor force reentrants and those on permanent layoff, both of which have seen improving dynamics recently. Part-time for economic reasons and durations of unemployment all improved on the month.
Overall, our composite measure of labor market slack that incorporates today’s data + jobless claims was slightly improved on the month.