Back Portfolio Strategy

Easy vs. Hard Way to Lower Inflation + USD Influence

Published on June 25, 2026

∙ Download the PDF Report

By

Dennis DeBusschere

Kevin Brocks

Sophia Wang

DAILY STRATEGY: Main Point – Gold, 10yr yields, breakeven inflation rates send a signal on where inflation is headed. Equities, the shape of the yield curve, and credit spreads send a signal on how. Conflating the first layer with a soft-landing assumption is where the analytical error could creep in. We have high conviction on the destination (lower inflation to respect an economic speed limit of 2%), but lower conviction on how we get there. Our bias is weaker growth in the back half of 2026 lowers inflation the “easier way”. Call that a 6 out of 10 conviction.

Easy vs. Hard Way to Lower Inflation – The hard to lower inflation would be Fed hikes to slow GDP growth. Recession probabilities go up in this scenario and stocks have downside risk. The easier way is core inflation slowing over the back half of 2026 toward the Fed forecast of 3.3% YoY or below as GDP growth slows following the 1H26 boost from Fiscal. The Fed remains on hold as growth and eventually inflation moves lower. Odds of extending the economic cycle increase in this scenario and markets would be biased higher. In both scenarios expect Inflation expectations, gold, and 10yr yields to be biased lower and the USD higher. The question is HOW inflation slows back toward the Fed’s target.

USD INFLUENCE ON RETURNS: We got a few questions yesterday on the Dollar’s influence on stocks generally and on Momentum specifically.

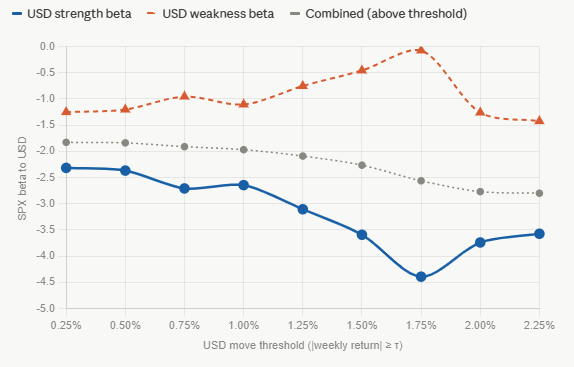
Investors will look through noise, but the current move in the USD does clear the historical threshold at which the USD tends to influence returns. Based on the historical beta to the USD, the threshold for weekly Dollar moves that matters is ~125bps. The current move is 150bps.

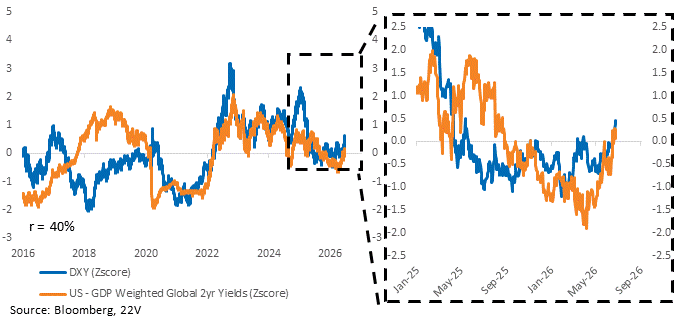
A higher USD is a headwind to equities in 2 ways. 1) Via tighter financial conditions. Gerard attributes the currency move to rate differentials (HERE). The USD and short rates are still trending together. US 2yr yields are increasing relative to the rest of the world, supporting the USD and tightening FCI at the margin. For now, 10yr yields declining offset the USD strength. Credit spreads remain tight. If the US 2yr yield surges toward 5%, it is likely the USD impact on financial conditions, along with other inputs, would become more intense.

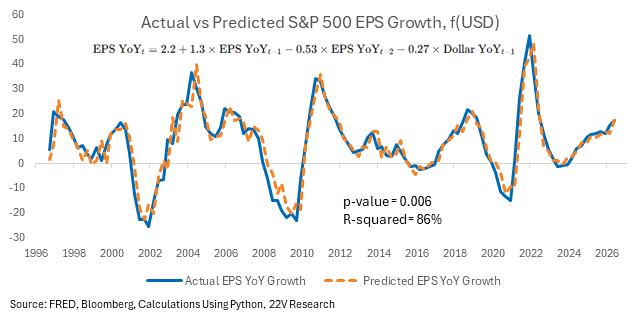
2) Via a headwind to earnings. We put together a simple model that suggests a 1% increase in the trade-weighted Dollar takes away roughly 25bps from EPS growth. Don’t get wedded to false precision here — direction and ballpark magnitude matter more than exact numbers.

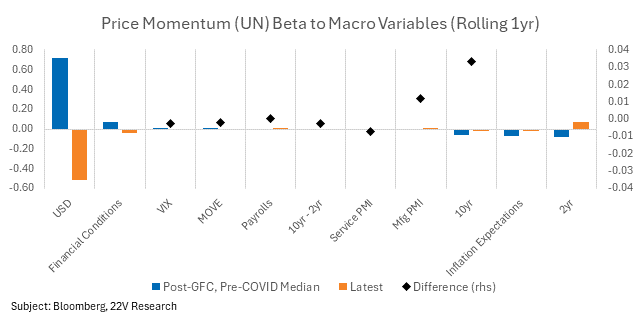
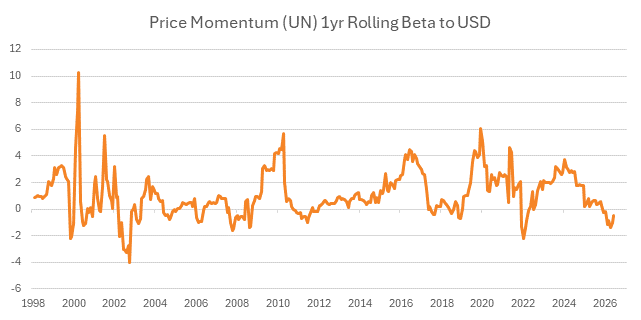
The USD screens as the macro variable with the largest impact on Price Momentum historically, but Price Momentum’s rolling beta to the USD is too unstable to draw a conclusion with any conviction. Rather than lean on the unstable historical data, we can consider the current situation. If the USD has a sustained move higher, it’s likely to be in response to hot inflation data and higher rates. Warsh made it clear that price stability is a priority. IF core inflation is too high (>21bps a month from here through the end of the year), then there could be a VAR shock/broad derisking. In that, Momentum will lead to the downside (definitionally). Financial conditions tightening is a live risk, adding to Momentum vol right now.

FYI, idio risk (AI) is still highly influential over Momentum returns too. Micron overnight will help.

Charts…

We estimate SPX sensitivity to the broad Fed trade-weighted index using post-2020 weekly returns. Rather than a single unconditional beta, we test whether the USD/equity relationship is meaningful beyond a minimum move size, running separate regressions above and below a grid of move thresholds. USD moves below 0.50% are statistically indistinguishable from noise. Beta scales above 1.25%. We find meaningful asymmetry: USD strength carries roughly 2.4x the impact of equivalent USD weakness.
A graph of a graph with a line and a line

AI-generated content may be incorrect.

Source: Bloomberg, 22V Research, Modeling done with Claude

The Dollar is tracking the rate differential between the US and the rest of the world. We are hesitant to abandon that framework after 1 day or divergence.
A graph of blue and orange lines

AI-generated content may be incorrect.

We put together a simple model that suggests a 1% move in the trade-weighted Dollar adds/subtracts roughly 25bps to EPS growth. The recent 150bp appreciation in the Dollar subtracts roughly 37bps from EPS, were it to hold. Don’t get carried away with the false precision here — direction and ballpark magnitude matter more than exact numbers. We’re happy to provide more details on the model if helpful.
A graph of a graph with numbers and a line

AI-generated content may be incorrect.

The USD has the largest effect on Momentum returns across macro variables, but as the line chart shows, Momentum beta to the Dollar is volatile. We are more likely to be right about the current influence of the Dollar on Momentum by focusing on inflation and financial conditions.
A graph of a graph with black and orange dots

AI-generated content may be incorrect.

A graph with orange lines

AI-generated content may be incorrect.

Source: Bloomberg, 22V Research

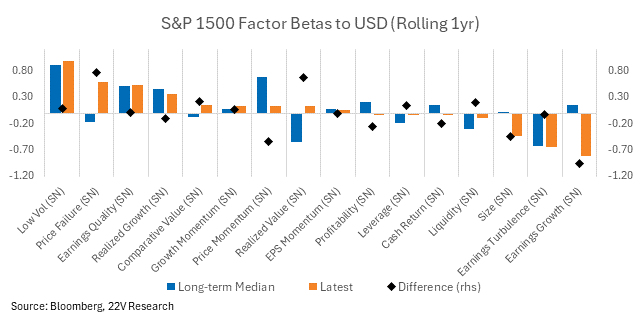
The Dollar has the largest impact on risk factors right now, consistent with the idea that financial conditions are the main channel the USD is operating through.
DISCLOSURES AND DISCLAIMERS

Analyst Certification

The analyst, 22V Research Group, primarily responsible for the preparation of this research report attests to the following: (1) that the views and opinions rendered in this research report reflect his or her personal views about the subject companies or issuers; and (2) that no part of the research analyst’s compensation was, is, or will be directly related to the specific recommendations or views in this research report.

Analyst Certifications and Independence of Research.

Each of the 22V Research analysts whose names appear on the front page of this report hereby certify that all the views expressed in this Report accurately reflect our personal views about any and all of the subject securities or issuers and that no part of our compensation was, is, or will be, directly or indirectly, related to the specific recommendations or views of in this Report.

22V Research (the “Company”) is an independent research provider. The Company is not a member of the FINRA or the SIPC and is not a registered broker dealer or investment adviser. 22V Research has no other regulated or unregulated business activities which conflict with its provision of independent research.

22V Research, LLC is a professional services and independent publication organization. 22V Research, LLC is not a securities broker-dealer, not a member of the Financial Industry Regulatory Authority (FINRA), not a registered investment advisor (RIA) and not a member of SIPC.

Securities transactions, when offered, are offered by 22V Securities, LLC through LPS Capital, LLC. Certain employees of 22V Securities, LLC are dually registered as securities representatives of LPS Capital, LLC or Analyst Hub Securities, LLC. 22V Securities, LPS Capital and Analyst Hub Securities are members FINRA, SIPC.

https://brokercheck.finra.org/

Current Ratings Definition.

SECTOR OUTPERFORM: An “outperform” rating anticipates the company will outperform the S&P Regional Banking Index (peer group).

SECTOR PERFORM: A “market perform” rating anticipates the company will perform in line with the S&P Regional Banking Index (peer group).

SECTOR UNDERPERFORM: An “underperform” rating anticipates the company will underperform the S&P Regional Banking Index (peer group).

Limitation Of Research And Information.

This Report has been prepared for distribution to only qualified institutional or professional clients of 22V Research Group. The contents of this Report represent the views, opinions, and analyses of its authors. The information contained herein does not constitute financial, legal, tax or any other advice. All third-party data presented herein were obtained from publicly available sources which are believed to be reliable; however, the Company makes no warranty, express or implied, concerning the accuracy or completeness of such information. In no event shall the Company be responsible or liable for the correctness of, or update to, any such material or for any damage or lost opportunities resulting from use of this data. Nothing contained in this Report or any distribution by the Company should be construed as any offer to sell, or any solicitation of an offer to buy, any security or investment. Any research or other material received should not be construed as individualized investment advice. Investment decisions should be made as part of an overall portfolio strategy and you should consult with a professional financial advisor, legal and tax advisor prior to making any investment decision. 22V Research Group shall not be liable for any direct or indirect, incidental or consequential loss or damage (including loss of profits, revenue or goodwill) arising from any investment decisions based on information or research obtained from 22V Research Group.

Reproduction And Distribution Strictly Prohibited.

No user of this Report may reproduce, modify, copy, distribute, sell, resell, transmit, transfer, license, assign or publish the Report itself or any information contained therein. Notwithstanding the foregoing, clients with access to working models are permitted to alter or modify the information contained therein, provided that it is solely for such client’s own use. This Report is not intended to be available or distributed for any purpose that would be deemed unlawful or otherwise prohibited by any local, state, national or international laws or regulations or would otherwise subject the Company to registration or regulation of any kind within such jurisdiction.

Copyrights, Trademarks, Intellectual Property.

22V Research Group, and any logos or marks included in this Report are proprietary materials. The use of such terms and logos and marks without the express written consent of 22V Research Group is strictly prohibited. The copyright in the pages or in the screens of the Report, and in the information and material therein, is proprietary material owned by 22V Research Group unless otherwise indicated. The unauthorized use of any material on this Report may violate numerous statutes, regulations and laws, including, but not limited to, copyright, trademark, trade secret or patent laws.
