Back Portfolio Strategy

Orderly Declines in Growth and Inflation Expectations are Good for Non-AI Cyclicals

Published on June 12, 2026

∙ Download the PDF Report

By

Dennis DeBusschere

Kevin Brocks

Sophia Wang

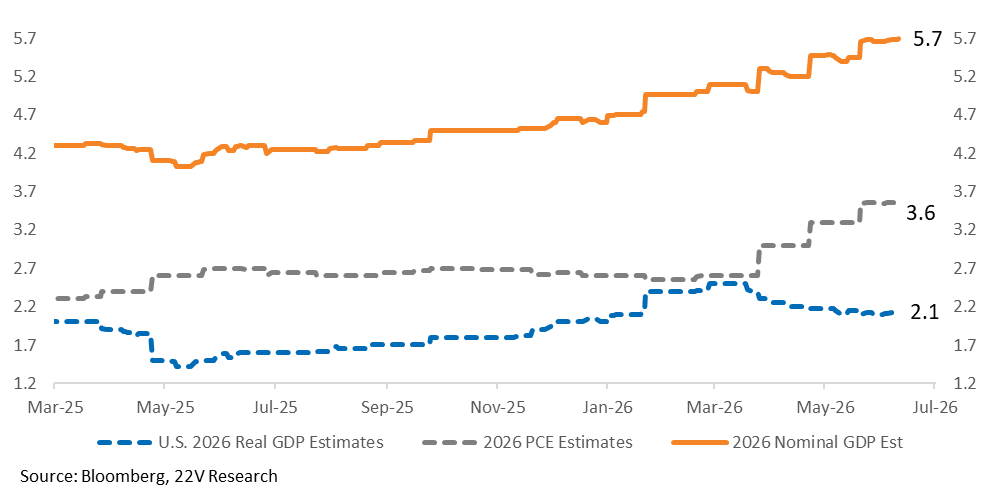
DAILY STRATEGY: Our call remains that to keep inflation in check GDP growth needs to be at or below 2%, assuming trend productivity holds at roughly 2%. Estimates for US GDP growth have started to decline toward 2% and inflation expectations are moving lower. 2026 GDP growth forecasts have moved from 2.7% to 2.1% for 2026 and are ~2% for 2027. GDP estimates holding, and actual inflation following inflation expectations lower, would be POSITIVE for Non-AI related Cyclicals. Retail stocks, Regional Banks, Airlines and Homebuilders.

Over the back half of 2026, we expect economic growth to slow toward 2% or slightly below and for the Fed to remain on hold AS GROWTH SLOWS. The Fed will let economic growth slow to ensure core inflation eventually declines. The implication is higher real yields, which is bad for gold. The risk reward is less compelling in theory for overall markets, but it’s not a problem. Economic growth is still expected to be +2% real and +4% nominal. The Fed will not have a tightening bias under this scenario, which is good. A tightening bias would be bad for risk assets as it would likely be associated with GDP growth estimates well below 2%.

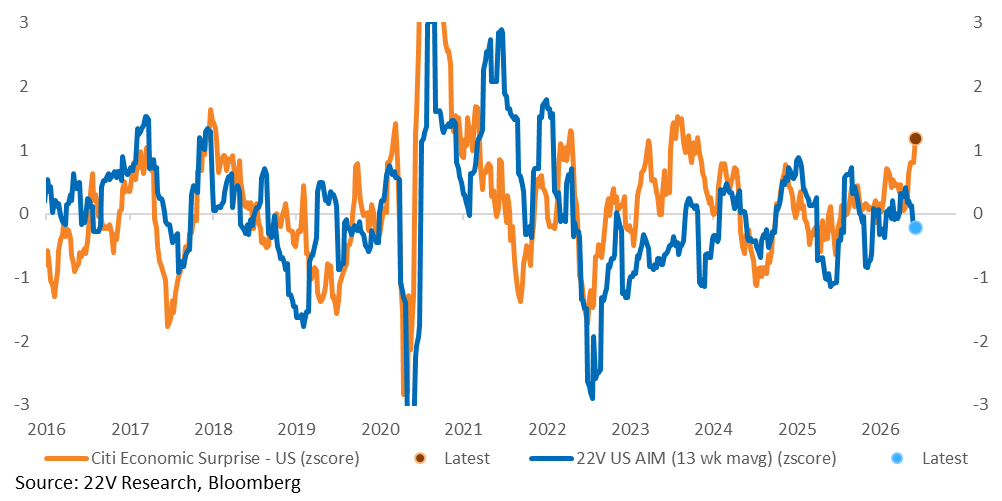
FYI – The US Citi surprise index is likely headed lower. By construction the US Citi surprise index is mean reverting, but more negative surprises going forward will probably influence economic sentiment some.

To answer a good question we have received, YES, consumer stocks (and other Non-AI Cyclicals) should outperform if economic growth slows. A non-recessionary slowdown that helps bring inflation down, which is what investors are discounting, is POSITIVE for non AI related Cyclicals.

It is possible that the Fed staying on hold for longer leads to a much sharper slowdown in economic growth. i.e. a mistake is made. That is a risk. But that is not what is being priced and not our forecast. We have a high conviction that inflation, not slower economic growth, is the main constraint on the economic cycle (HERE). Bottom Line – a sudden increase in recession odds is unlikely outside of a shock.

Important Background – The correlation between 10yr yields and Early Cyclicals (Discretionary, Tech and Comms) relative performance vs. Defensives is generally negative. Higher 10yr yields are negative for the relative performance of Early Cyclicals and vice versa. That negative correlation has intensified as 10yr yields move above 4.5%. A level that investors associate with increased odds of demand destruction (HERE). Demand destruction would be bad for consumer spending and non-AI related Cyclicals (Retail, Banks, Airlines, Builders) in general. 10yr yields in the 4.2-4.5% range with inflation moving toward the Fed’s target (over time) would be ideal.

Retail stocks witnessed NTM PE compression despite much stronger than expected consumer spending data and an increase in EPS estimates. NTM EPS estimates have moved from close to zero to start 2026 to +~17% today, compressing the NTM PE for Retail stocks on a relative basis. Retail stocks never benefitted from the better than expected consumer spending data and increased EPS estimates. Higher interest rates and oil prices weighed on the group. If economic growth moves from its current 3% level to 2%, but 10yr yields stay in a 4.2-4.5% range and inflation expectations decline, Retail and other Non-AI related Cyclicals will benefit. Odds that the economic cycle lengthens will increase as inflation moves lower in a non-recessionary way.

Charts…

Economic growth estimates have come down, but inflation estimates have increased.
A graph of the growth of the company

AI-generated content may be incorrect.

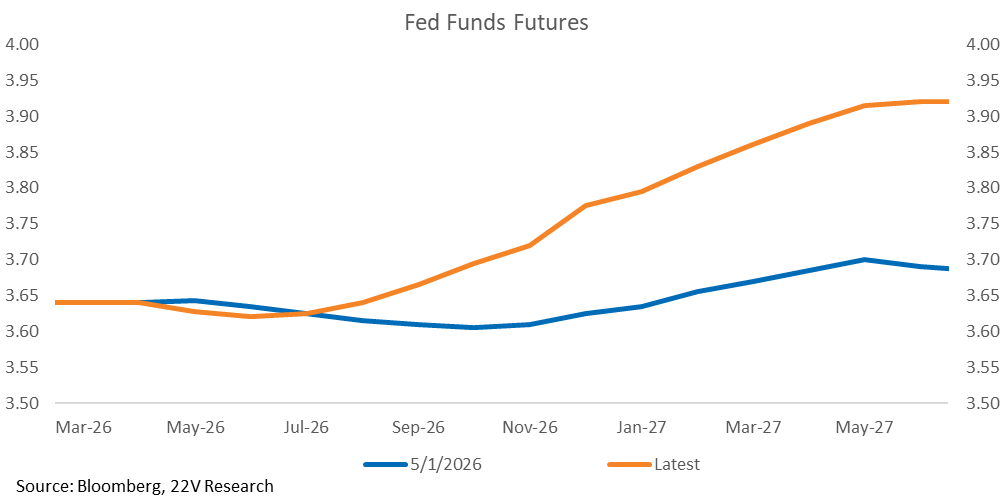
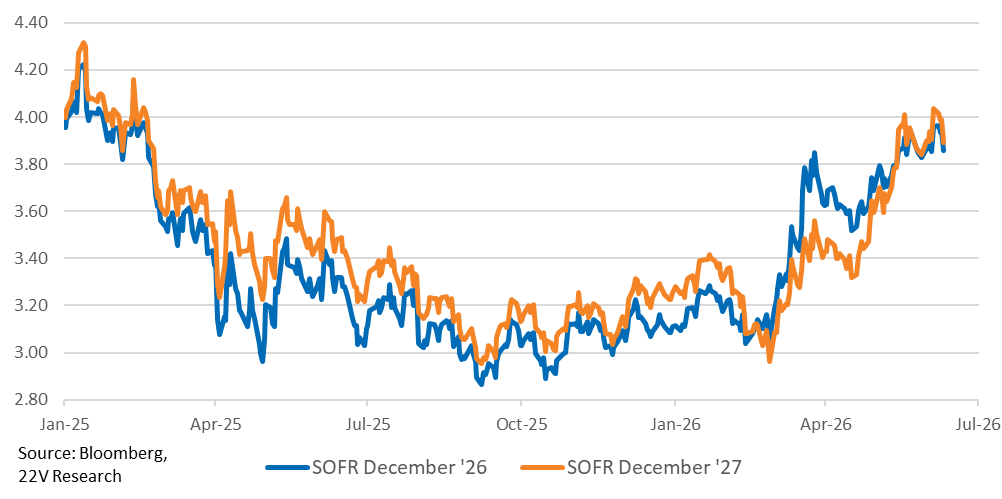
Core inflation estimates increasing is why Fed funds futures are pricing in a Fed on hold. Despite the recent decline in oil prices.
A graph showing the growth of the fed funds

AI-generated content may be incorrect.

A graph of blue and orange lines

AI-generated content may be incorrect.

Citi surprise index likely moving lower. Below is the US Citi Surprise index relative to the 22V Economic diffusion index (every data point vs the previous data point). For a number of reasons, economic US Citi surprise index is likely headed lower.
A graph of blue and orange lines

AI-generated content may be incorrect.

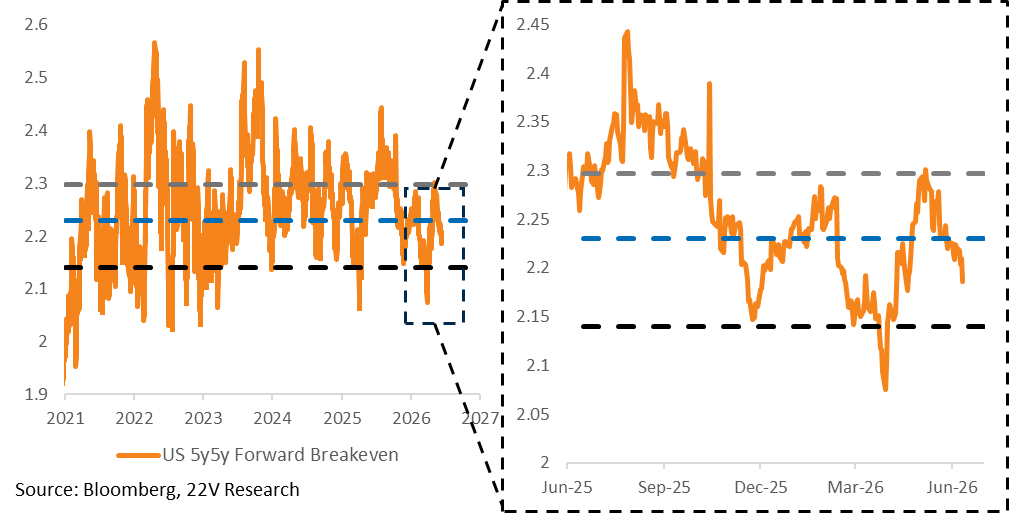
Inflation expectations have been moving lower on a longer term basis.
A graph of a graph of a graph

AI-generated content may be incorrect.

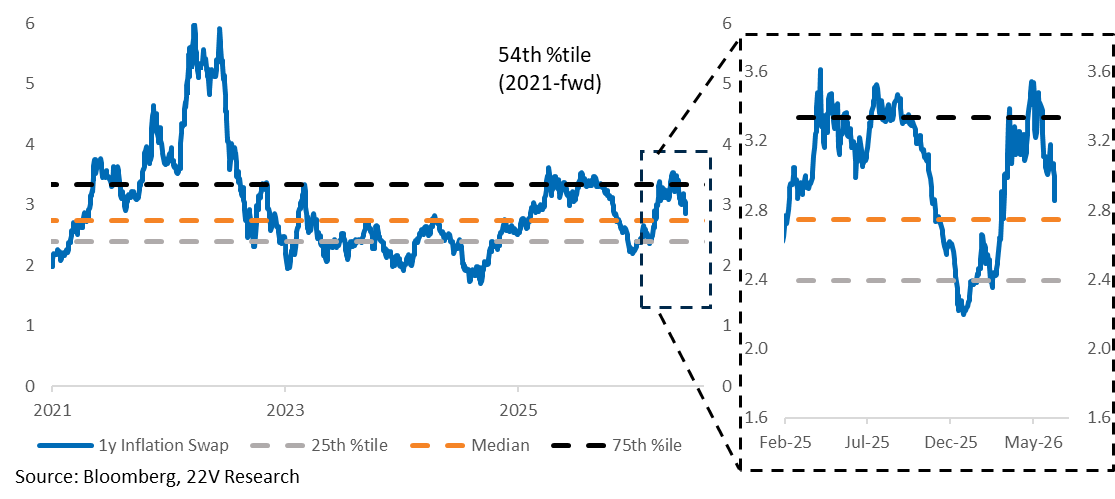
1yr inflation swaps have declined as well., indicating investors are pricing in declining inflation AS the Fed remains on hold. That is not a bad thing as long as GDP growth estimates remain ~>2%.
A graph of a line graph

AI-generated content may be incorrect.

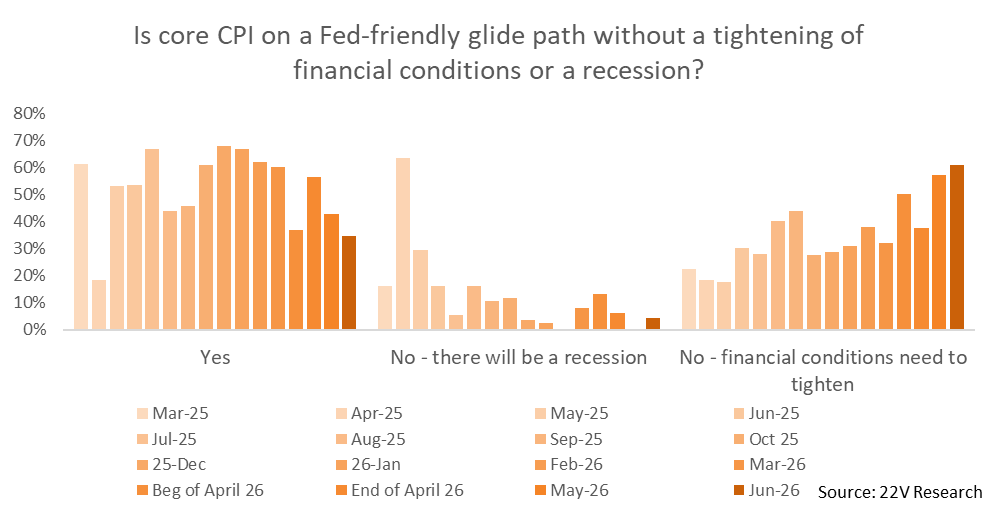
61% of the investors we polled think financial conditions need to tighten to get inflation on a Fed-friendly glide path. That is a new high for our surveys. This helps explain why higher 10yr yields has been associated with negative stock market performance.
A graph of a financial condition

AI-generated content may be incorrect.

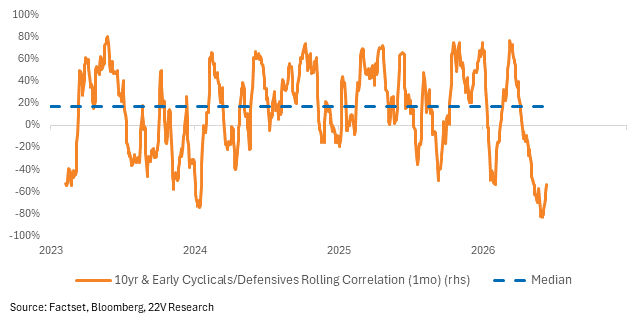
The correlation between 10yr yields and Early Cyclicals (Discretionary, Tech and Communications) relative performance vs Defensives is generally negative. Higher 10yr yields are a negative for the relative performance of Early Cyclicals and vice versa. That negative correlation intensified as 10yr yields moved above 4.5%. A level investors associate with increased odds of demand destruction (HERE). Demand destruction would be bad for consumer spending and non-AI related Cyclicals (Retail, Banks, Airlines, Builders) in general.
Retail stocks witnessed NTM PE compression despite much stronger than expected consumer spending data and an increase in EPS estimates. NTM EPS estimates have moved from close to zero to start 2026 to +~17% today. Yet the NTM PE compressed. Retail stocks never benefitted from the better than expected consumer spending data and increase in EPS estimates. The increase in interest rates and oil prices weighed on the group. If economic growth moves from the current 3% level to 2%, but 10yr yields stay in a 4.2-4.5% range and inflation expectations decline, that will BENEFIT retail and other Non-AI related Cyclicals. The odds that the economic cycle lengthens increases as inflation moves lower in a non-recessionary way.
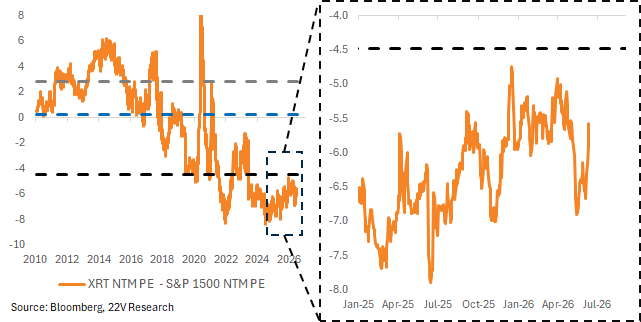
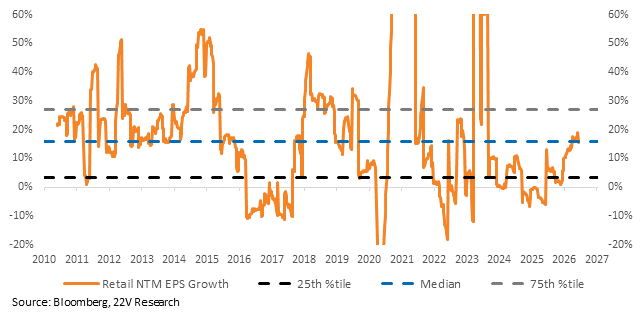
A graph of a stock market

AI-generated content may be incorrect.

A graph of a graph with numbers and lines

AI-generated content may be incorrect.

DISCLOSURES AND DISCLAIMERS

Analyst Certification

The analyst, 22V Research Group, primarily responsible for the preparation of this research report attests to the following: (1) that the views and opinions rendered in this research report reflect his or her personal views about the subject companies or issuers; and (2) that no part of the research analyst’s compensation was, is, or will be directly related to the specific recommendations or views in this research report.

Analyst Certifications and Independence of Research.

Each of the 22V Research analysts whose names appear on the front page of this report hereby certify that all the views expressed in this Report accurately reflect our personal views about any and all of the subject securities or issuers and that no part of our compensation was, is, or will be, directly or indirectly, related to the specific recommendations or views of in this Report.

22V Research (the “Company”) is an independent research provider. The Company is not a member of the FINRA or the SIPC and is not a registered broker dealer or investment adviser. 22V Research has no other regulated or unregulated business activities which conflict with its provision of independent research.

22V Research, LLC is a professional services and independent publication organization. 22V Research, LLC is not a securities broker-dealer, not a member of the Financial Industry Regulatory Authority (FINRA), not a registered investment advisor (RIA) and not a member of SIPC.

Securities transactions, when offered, are offered by 22V Securities, LLC through LPS Capital, LLC. Certain employees of 22V Securities, LLC are dually registered as securities representatives of LPS Capital, LLC or Analyst Hub Securities, LLC. 22V Securities, LPS Capital and Analyst Hub Securities are members FINRA, SIPC.

https://brokercheck.finra.org/

Current Ratings Definition.

SECTOR OUTPERFORM: An “outperform” rating anticipates the company will outperform the S&P Regional Banking Index (peer group).

SECTOR PERFORM: A “market perform” rating anticipates the company will perform in line with the S&P Regional Banking Index (peer group).

SECTOR UNDERPERFORM: An “underperform” rating anticipates the company will underperform the S&P Regional Banking Index (peer group).

Limitation Of Research And Information.

This Report has been prepared for distribution to only qualified institutional or professional clients of 22V Research Group. The contents of this Report represent the views, opinions, and analyses of its authors. The information contained herein does not constitute financial, legal, tax or any other advice. All third-party data presented herein were obtained from publicly available sources which are believed to be reliable; however, the Company makes no warranty, express or implied, concerning the accuracy or completeness of such information. In no event shall the Company be responsible or liable for the correctness of, or update to, any such material or for any damage or lost opportunities resulting from use of this data. Nothing contained in this Report or any distribution by the Company should be construed as any offer to sell, or any solicitation of an offer to buy, any security or investment. Any research or other material received should not be construed as individualized investment advice. Investment decisions should be made as part of an overall portfolio strategy and you should consult with a professional financial advisor, legal and tax advisor prior to making any investment decision. 22V Research Group shall not be liable for any direct or indirect, incidental or consequential loss or damage (including loss of profits, revenue or goodwill) arising from any investment decisions based on information or research obtained from 22V Research Group.

Reproduction And Distribution Strictly Prohibited.

No user of this Report may reproduce, modify, copy, distribute, sell, resell, transmit, transfer, license, assign or publish the Report itself or any information contained therein. Notwithstanding the foregoing, clients with access to working models are permitted to alter or modify the information contained therein, provided that it is solely for such client’s own use. This Report is not intended to be available or distributed for any purpose that would be deemed unlawful or otherwise prohibited by any local, state, national or international laws or regulations or would otherwise subject the Company to registration or regulation of any kind within such jurisdiction.

Copyrights, Trademarks, Intellectual Property.

22V Research Group, and any logos or marks included in this Report are proprietary materials. The use of such terms and logos and marks without the express written consent of 22V Research Group is strictly prohibited. The copyright in the pages or in the screens of the Report, and in the information and material therein, is proprietary material owned by 22V Research Group unless otherwise indicated. The unauthorized use of any material on this Report may violate numerous statutes, regulations and laws, including, but not limited to, copyright, trademark, trade secret or patent laws.
