

Main point: The inflation news last Thursday was better than expected. But underlying inflation seems to be at least 50 basis points above the Fed’s target, even if we control for the estimated effects of tariffs and the tendency of the government measures of average rents to lag behind marginal rents. The cause of this inflation overshoot is not well understood, but our ignorance here does not necessarily go to the dove. A conventional central bank should – and probably will – be willing to trade off a little employment in the short run to nudge inflation closer to target in what we might call the medium term. This fits my view that the speed limit on growth is 2% or lower, although I focus here on the inflation side.
Good news on Thursday
The rise of the Core PCE Price Index during April was about 5 basis points lower than the informed consensus had inferred from the individual price detail in the CPI, PPI and IPI for the same month. The reason for this, I read, is that there were some surprising tweaks in the seasonal factor around airline fares, and that some of the items for which there is no lead from the three reports mentioned above just happened to land on the soft side.
The 12-month change of the Core PCE was nevertheless within a couple bps of consensus because of slight upside revisions to the Q1 data. But those revisions were concentrated in non-market prices. A 6 basis point “miss” in the Market Price Only (MPO) component of the Core mapped to a similar miss in the 12-month rate there. So, the news on Thursday was somewhat better than expected.
This quickening is inconveniently timed
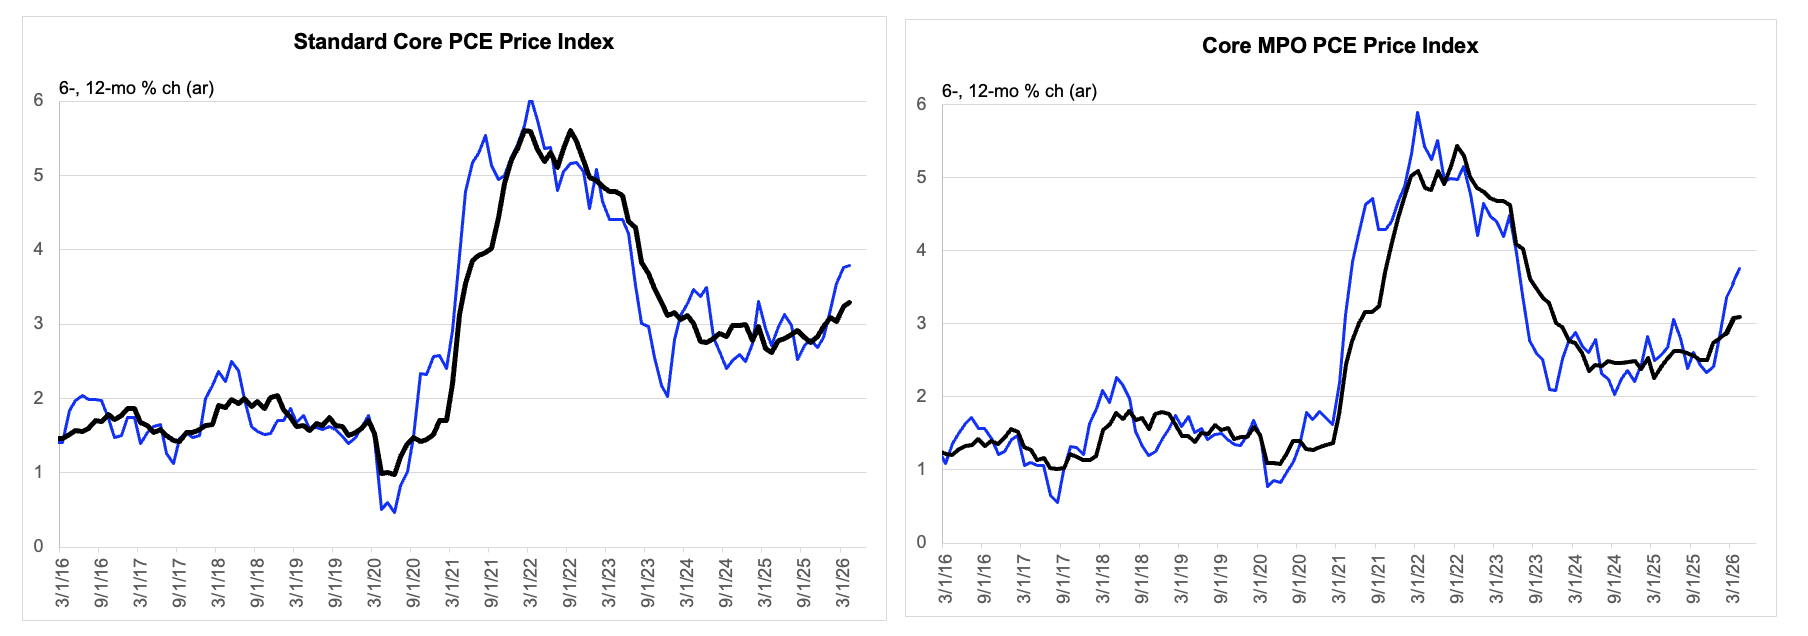
Data are actual to April.
NB: The Core and its MPO version imply the same ex-food-&-energy 12-month inflation rate as of April. But the MPO probably has the more representative second derivative.
A simple proxy of underlying inflation is 2 ½% +
But that news does not do much to change the basic setup here, which is that underlying inflation is running a half percentage point or slightly more above the Fed’s target. Both the Core and its MPO component suggest an ex-food-&-energy inflation rate of about 3.3%. The MPO rate is slightly lower, but it must be adjusted upward to offset by the (hopefully stable) downward bias created by its exclusion of non-market prices that tend to rise in relative terms over time. But we can probably shave that 3.3% rate down to 3%, if we swap out the lagging government measure of average rents (3.2%) for my proxy of marginal rent inflation (1.5%). I used to call that the Observed Rent core inflation rate, but I have tended to de-emphasize that measure in recent months for reasons I need not reiterate here.
We then might want to net out the effect of the tariffs on the grounds that they are transitory and not related to underlying inflation pressures. According to a recent study produced by the Fed staff, which I have circulated before, the tariffs are lifting the 12-month inflation rate by about 55 basis points. (The total effect is a bit larger, but some of it predates April 2025.) That study assumes that the ex-tariff paths in goods prices, on a case by case basis, are equal to their pre-Covid trends, which may be a bit optimistic, even without invoking the AI buildout effect, simply because globalization is over. So, let’s shave that tariff effect back to a ½ a percentage point or slightly lower and infer an underlying inflation rate of 2½% — or just slightly higher.
The recent acceleration is oddly timed
So, that is the state of things here as I see it. Now let me turn to a couple oddities around this situation that are arguably offsetting in terms of their absolute influence but perhaps lean slightly hawkish in terms of their influence relative to perceptions.
The first point here is hawkish outright and hawkish relative to perceptions. The consensus discussion tends to bury the point and to focus on the idea that the tariff effects are not yet fully in the data. But the Fed study referenced above, which I and presumably others view as authoritative as these things go, suggests that the peak tariff effect on the level of PCE prices peaked four months prior to April and is unchanged from six months ago. It is conceivable that the Fed study’s conclusions jump the gun slightly, but I think we can agree at least that the peak tariff impetus is behind us. So, something else must be behind the recent acceleration of core inflation, as evidenced by the fact that the 6-month rates are above the 12-month rates, with both trending higher in recent months, as indicated by the chart at the top of this note.
Estimated impetus has peaked, unsurprisingly, given that tariff rates themselves have
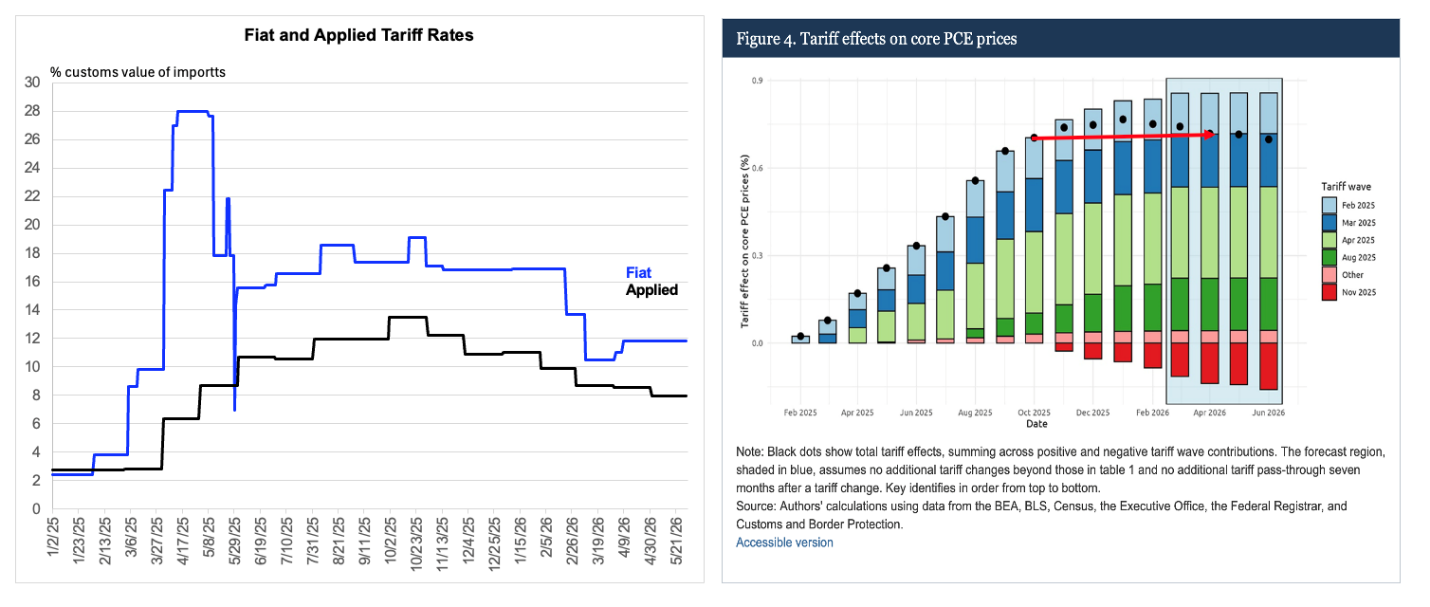
Fiat tariff rate is as of April 8 reading from Yale. Applied tariff rate is effectively actual to May. The red arrow in the right panel just highlights that the tariff effect in the six months to April is estimated by that Fed study at ZERO.
And it is hard to fit into the standard model
The second oddity here leans dovish, but perhaps not by as much as is generally perceived. It is conventional, especially in central banking circles, to describe an inflation pulse as “transitory” if its origins cannot easily be shoe-horned into the New Keynesian Phillips Curve, which holds that inflation pressures show up first in the labor market, and can become self-reinforcing to the extent that they feed higher inflation expectations. Viewed through this lens, the current inflation spike may seem likely to peter out. After all, the labor market is near rather than through full employment, and direct measures of inflation expectations in the real economy and at horizons that are presumably relevant to price setting are well behaved. I think this may largely explain why former Fed Chair Powell, even on a relatively hawkish day, would speak of needing to be patient while waiting for evidence of resumed disinflation. The patience is hawkish, but the pretense of what awaits is clearly dovish.
I am not as critical of the Phillips Curve as are some others. The idea that monetary policy has real effects seems intuitively obvious, and the least awkward way to generate that result within conventional macro is to assume that expected marginal cost drives expected price change and that price change is staggered. If a central bank intentionally stoked aggregate demand above the economy’s supply side potential, the initial effect will be a tightening in the labor market, with inflation subsequently accelerating, until the excess demand is dealt with and the labor market renormalizes. So, yes, I get why a sort of normal-looking unemployment rate, seemingly confirmed by moderate wage growth, would incline people not to extrapolate this recent inflation pulse.
However, it is worth distinguishing between what is plausible and what is known. Even if we accept the core logical premises underlying the Phillips Curve, it does not follow that an unemployment rate that looks normal in conjunction with moderate wage growth means that even the labor market is in a non-inflation position. For example, imagine a case where market power rose abruptly in response to corporate consolidation. We could easily see a rise in the natural rate of unemployment that would allow even a normal “looking” unemployment rate to reflect excessive demand. And wage growth might not be a relevant consistency check if that same rise of market power depressed equilibrium wages. And we could tell a similar story about how things might place out in the presence of labor-saving technology advance.
Structural changes that tend to raise the unemployment rate and depress wages are not necessarily disinflationary. And it is possible to miss this simple point if we rely excessively on intuition and refuse to trace through the actual logic of the Phillips Curve, even as advanced by its advocates. Moreover, within the imaginary set-up described above, simply for the purposes of illustration, the proof would be in the behavior of goods and services price measures, not labor market indicators.
Known unknown
So, then what is an analyst to do, given that these structural changes that I just imagine for illustration are very hard to observe in real time? My own approach here is to be humble and recognize that I don’t know. The behavior of labor market indicators does make it difficult for someone who is open minded (or undecided to put it less gently) about the Phillips Curve to conclude that the US has a serious inflation problem. My judgment call is that we probably do not. But we cannot be certain about this, because the Phillips Curve approach is at best incomplete, and it is not dispositive even in set-up where its fans somewhat casually assume it to be.
What we do know is that inflation has recently been accelerating for reasons that do not fit well with the idea that “it is just tariffs” and may signal that there is some pressure from excessive demand, both in the AI buildout and in the service sector. Meanwhile, the labor market does appear to be near full employment, so the Fed should – and probably will – be willing to trade off a little employment in the short run to know inflation reliably back toward target in what we might call the medium-term. And when monitoring how this is all playing out, we probably should pay at least as much attention to direct measures of underlying PCE inflation as we do the various indicators of labor market slack.

