

I believe the ongoing situation in the Middle East has diverted attention away from what has been negatively impacting the major indexes since well before the war started. I have already pointed out the weakness/underperformance in the financials that started several months ago (here), but I don’t believe enough attention is being paid to the struggles that most of the Mag7 names continue to be under. I updated my equal-weighted mag7 index based on Friday’s closing prices, and it shows a nearly 20% absolute decline from the October all-time highs. This sharp decline is nearly 3x the decline in the SPX and nearly 2x the decline in the NDX over that time. Even as the selling in the market has intensified the past two weeks, and perhaps other areas of the market with more exposure to higher oil and higher rates should have lagged, we still saw the Mag7 names underperform both SPY and QQQ by a wide margin.
The equal-weighted Mag7 index I created shows a nearly 20% decline from the Oct highs, and a sharp break below the 200-day moving average
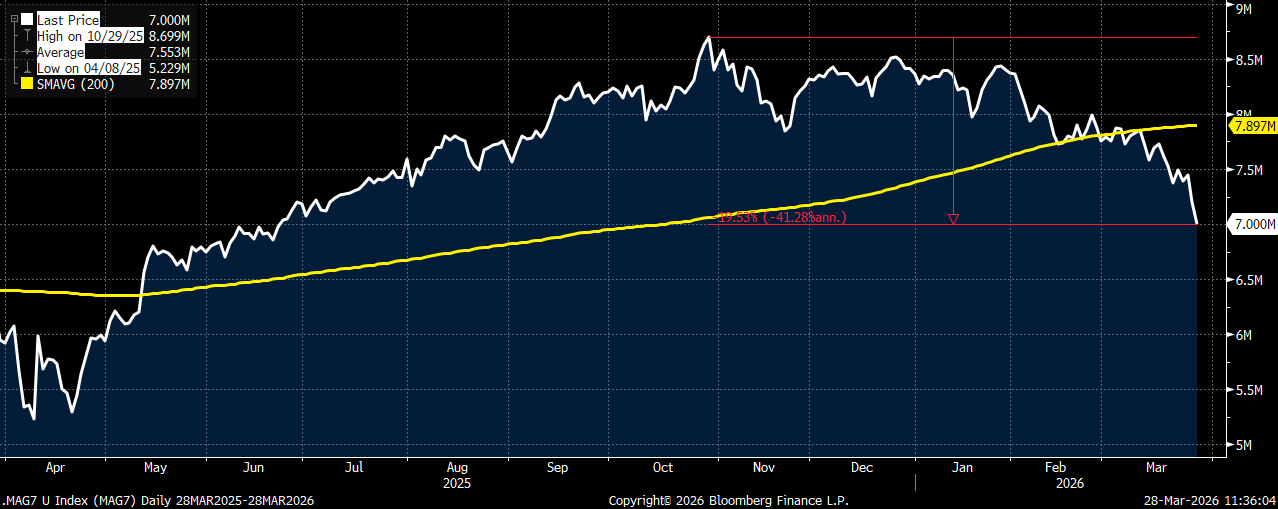
The Mag7 equal-weighted index is down ~ 3x the SPX and nearly 2x the NDX (QQQ) from the highs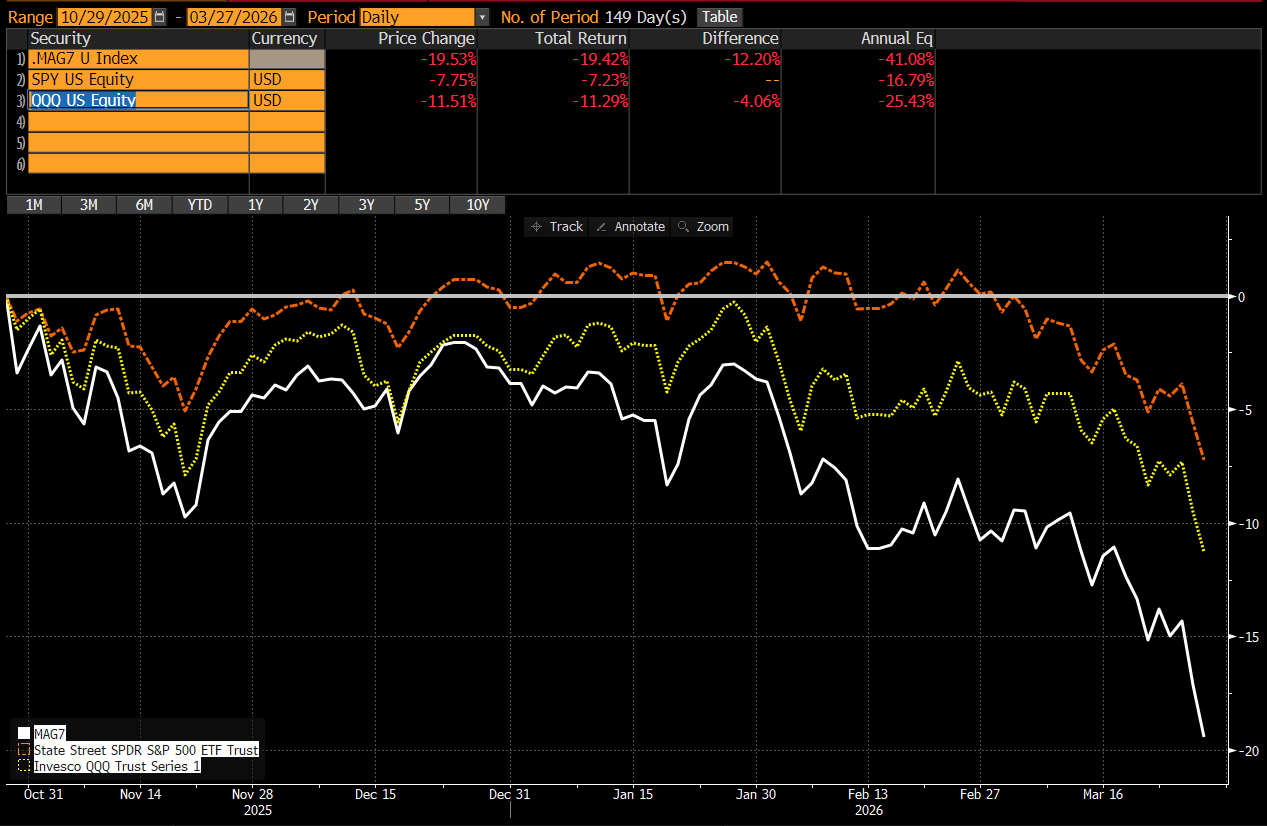
As you can see from the charts, the Mag7 names were already rolling over and underperforming the market well before the conflict in the Middle East even started. So, when the conflict is resolved (hopefully soon), should we really expect to see this group regain a market leadership role right away? It appears the problems they are currently facing go far deeper than just higher oil and higher rates for now. I mention this because with a current weighting of 40% in the QQQ, and a 32% weighting in the SPY, it would seem that without this group leading the market higher that any chance of a meaningful rally back to near the highs in either index seems very unlikely in the next few months,
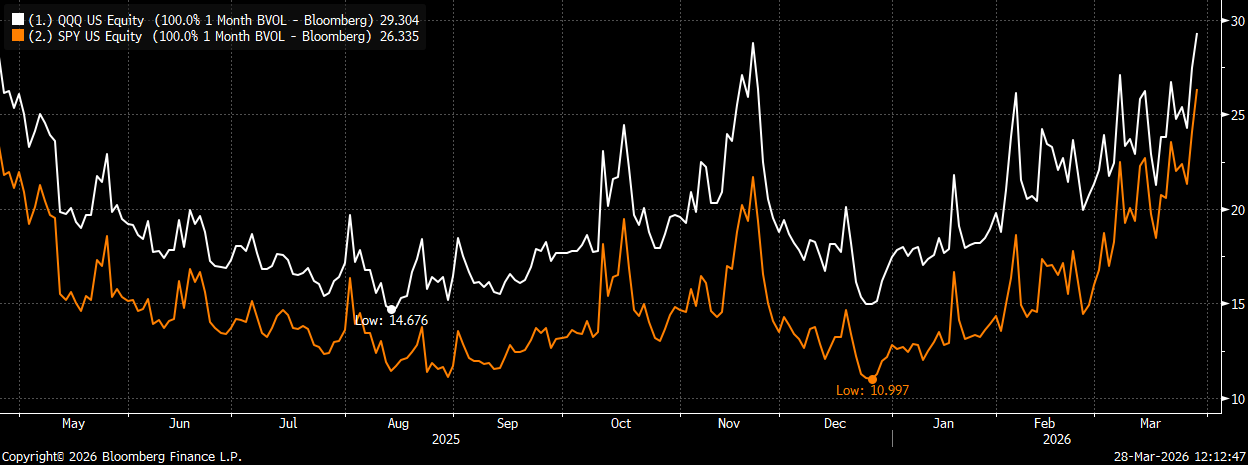
This fact, and with implied vol on both the QQQ and SPY now at levels not seen since last April’s tariff related selloff, makes me even more comfortable in suggesting new put spread collar hedges on both even though we are now down ~ 11.5% from the highs in QQQ and ~ 9% from the highs in SPY. Yes, we are short-term oversold, but I still don’t believe we can stage a meaningful rally with ~ 50% of the market (Mag7 and financials) acting as poorly as they have been. At the same time, both indexes continue to trade lower, and there clearly remains downside risks given the tenuous situation in the Middle East (which is why I STILL want to own lower-cost downside hedges).
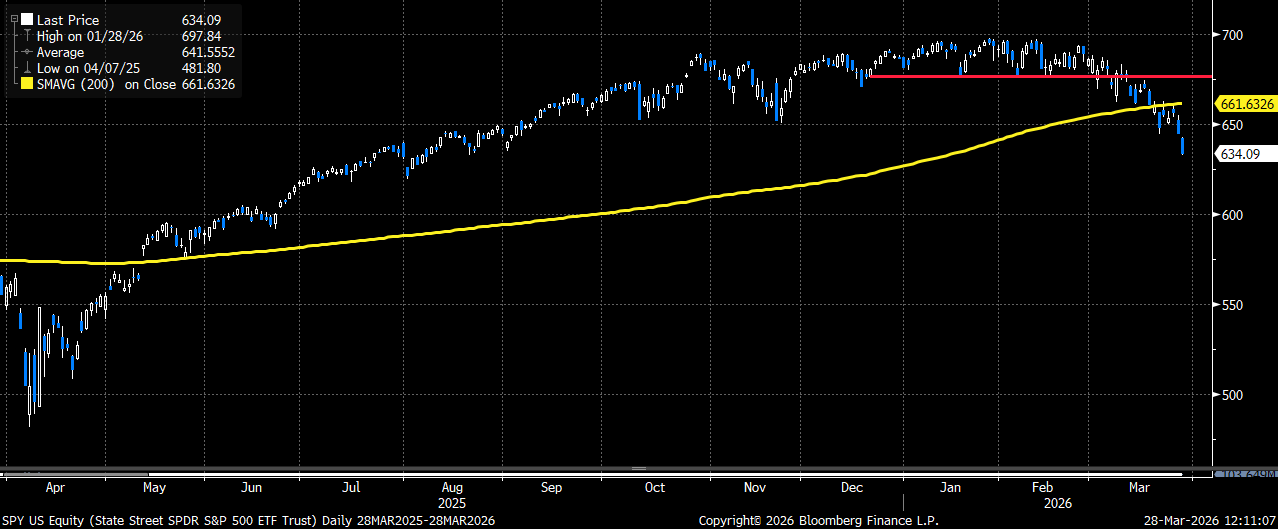
While I had previously suggested using the former highs for both QQQ and SPY as areas where I would look to sell upside calls as part of any put spread collar hedge, I believe those upside levels must now be lowered given the declines already seen in both. As for QQQ, I would now focus on the Feb-March highs ~ 615 as an upside call strike I would feel very comfortable selling (especially on any decent rallies). As far as SPY, I would target the 675 area as that was the former support level between Dec and Feb that should now act as meaningful resistance on any decent rally.
Please reach out to me for upside structures and pricing using the new upside call strike suggestion.
SPY is now well below the 200-day moving average. I would use the former support ~ 675 as part of any new put spread collar hedge trade (especially on any rallies)
QQQ well below the 200-day moving average. I would now use the Feb-March resistance ~ 615 as part of any new put spread collar hedge trade (especially on rallies)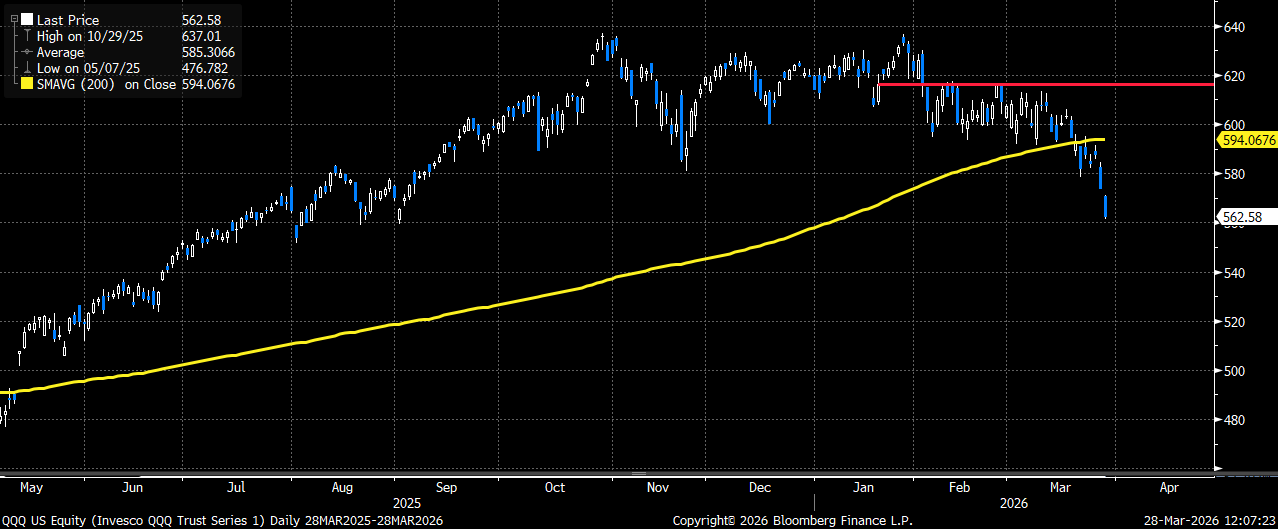
Both QQQ and SPY 1-month implied vol now at levels not seen since last April
Upside repair trades for META & MSFT
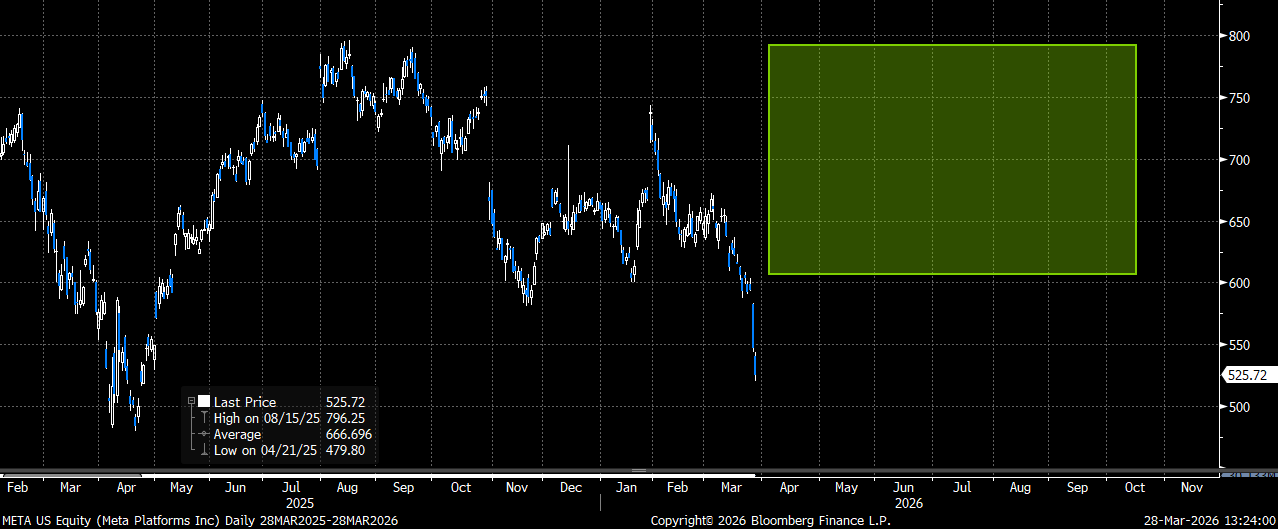
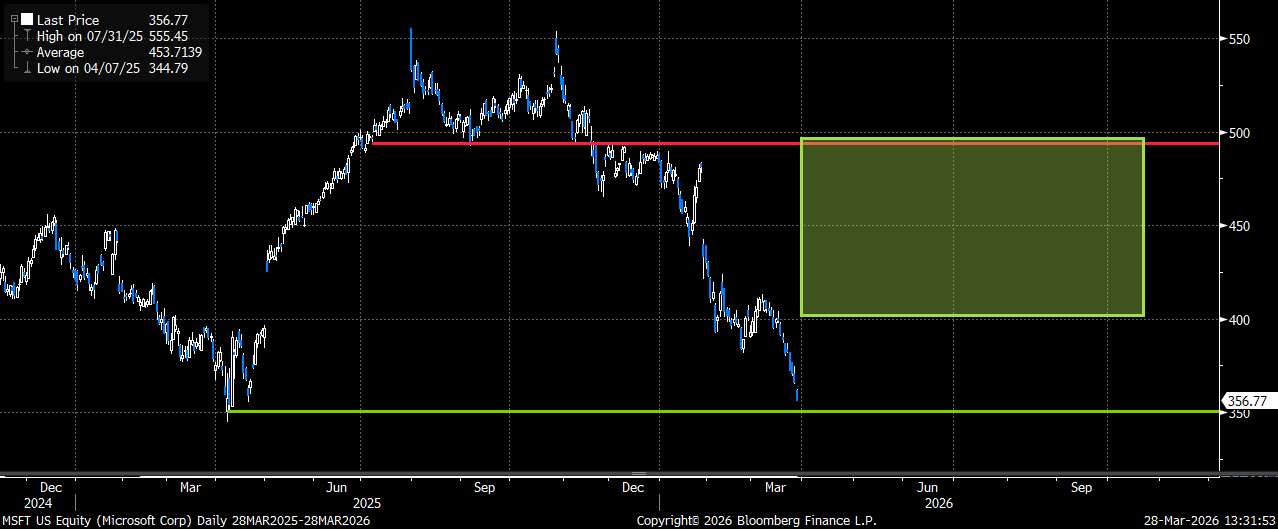
Speaking of the Mag7, MSFT and META have been the two worst performing names by a wide margin. MSFT is now down ~ 35% from the Oct highs, while META is down ~ 34% from the Aug all-time highs. Incredibly, both stocks are now at/near their April 2025 tariff lows, even though the market (SPY) is still ~ 32% above the tariff lows.
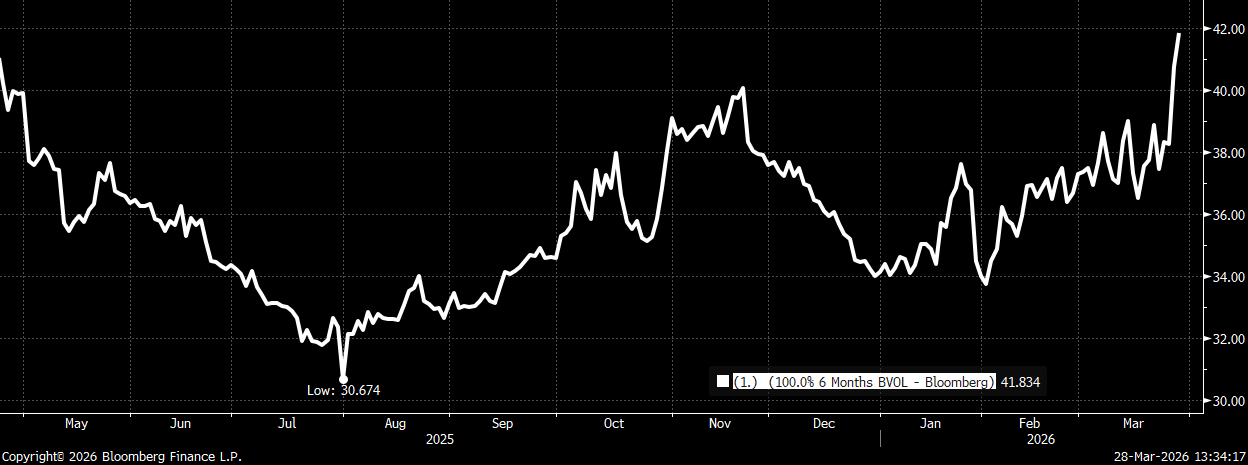
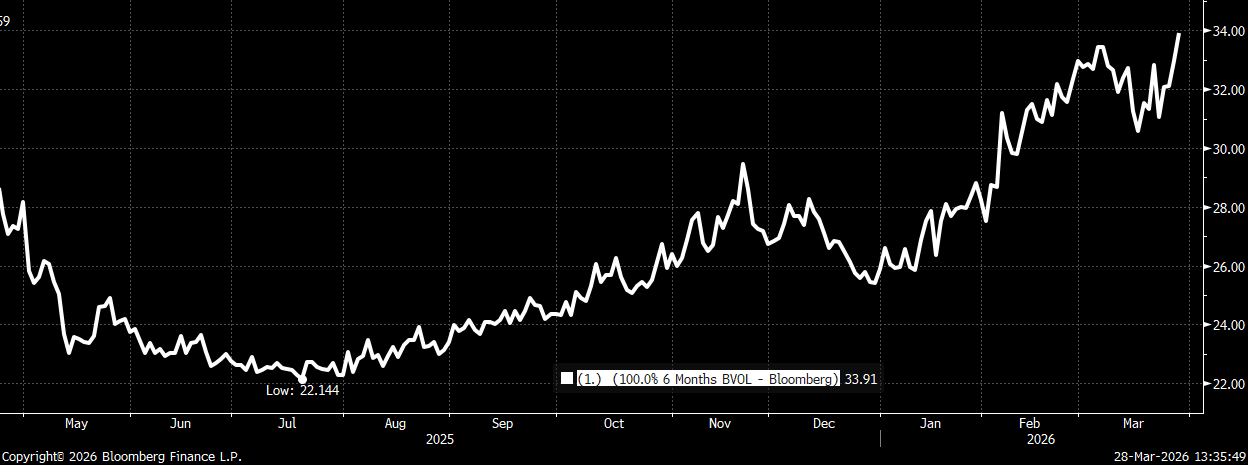
Not only are both MSFT and META down sharply, but we have seen 6-month implied volatility in both names move up aggressively as well. As opposed to the April 2025 selloff, where the entire market sharply declined and then saw a spike higher once the tariffs were rolled back, this selloff feels very stock specific. Since we are at the April 2025 lows for both names, and implied vol is at the recent highs, I suggest establishing longer-dated and low-cost upside “repair” trades as an overlay to an existing long equity position in either name for clients looking for “additional” upside without adding much new downside risk.
Here is a META trade I would consider at this time:
Buy META Oct 600 calls 1x
Sell META Oct 700 calls 2x
Costs ~ $7.50 (META 525.72 price ref)
META Oct 1×2 call spread overlay trade offers a wide area of upside outperformance with breakeven essentially back at the all-time highs
META 6-month (Oct) implied vol back near 1-year highs
Trade Details:
- Buying the delta-neutral October upside 1×2 call spread overlay with shares down 34% from the highs and back near the April 2025 lows
- Trade adds NO additional downside risk to existing long equity position (besides nominal cost of the trade)
- Option trade will make money/outperform stock between 607.50 and 792.50 at Oct 16th expiry (+15.5% to +51%)
- Great way to potentially add upside outperformance to an existing long equity position, while offsetting the elevated volatility
- Please reach out to me or the 22V sales team for updated pricing and execution capabilities
Here is a MSFT trade I would also consider now:
Buy MSFT Oct 400 calls 1x
Sell MSFT Oct 450 calls 2x
Costs ~ $3.30 (MSFT 356.77 price ref)
MSFT Oct 1×2 call spread overlay also offers a wide area for upside outperformance
MSFT 6-month (Oct) implied vol also back at 1-year highs
Trade Details:
- Buying the delta-neutral October upside 1×2 call spread overlay with shares down 35% from the highs and back near the April 2025 lows
- Trade adds NO additional downside risk to existing long equity position (besides nominal cost of the trade)
- Option trade will make money/outperform stock between 403.30 and 496.70 at Oct 16th expiry (+13% to +39%)
- Great way to potentially add upside outperformance to an existing long equity position, while offsetting the elevated volatility
- Please reach out to me or the 22V sales team for updated pricing and execution capabilities

