Back Portfolio Strategy

Yesterday’s GDP Implied Exceptionally Strong Q3 Productivity Growth

Published on December 24, 2025

∙ Download the PDF Report

By

Dennis DeBusschere

Brian Herlihy

Kevin Brocks

Sophia Wang

DAILY STRATEGY: Instead of getting caught up in distractions and worries about what drove the 3Q GDP data yesterday, let’s focus on what is happening. Productivity growth is very strong. Yes, transfer payments added to consumption, inflation COULD change next year given how strong growth is today, and the savings rate that came down a bit in 3Q. These are all legitimate concerns about how the economy might unfold in 2026. What we know today is that strong productivity growth allows for faster GDP growth with contained inflation.

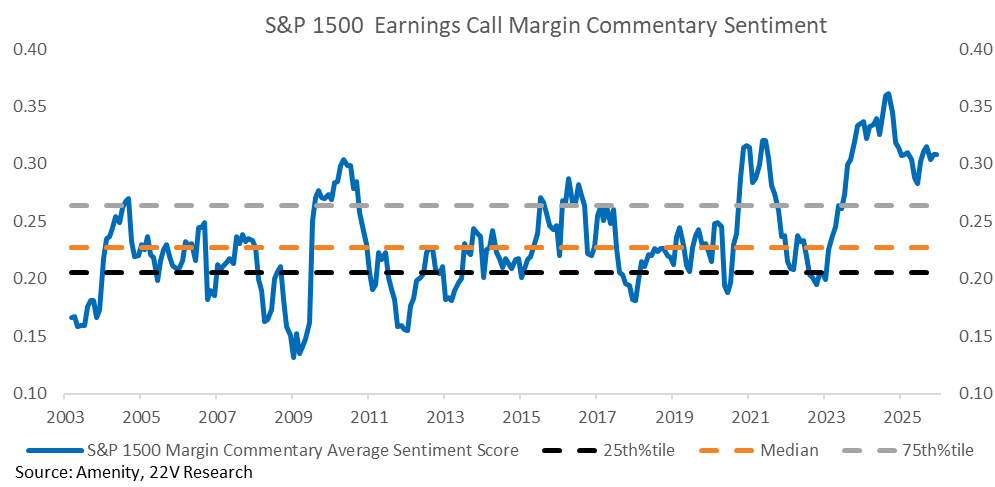
Yesterday’s GDP implied exceptionally strong Q3 productivity growth. Productivity surprises tend to accrue to capital (HERE). Margin sentiment for the S&P 1500 ticked up slightly last quarter and is hovering around historical highs. That is consistent with strong productivity data. Also, strong productivity should keep inflation risk lower (happening). Booming productivity and surging profits suggest the risk of labor market problems should be low. This looks more obvious now as hiring data has stabilized. Strong productivity generally means higher real income over time. That real income would get recycled through the economy. I.e. spending data should remain firm. Holiday sales look better than expected.
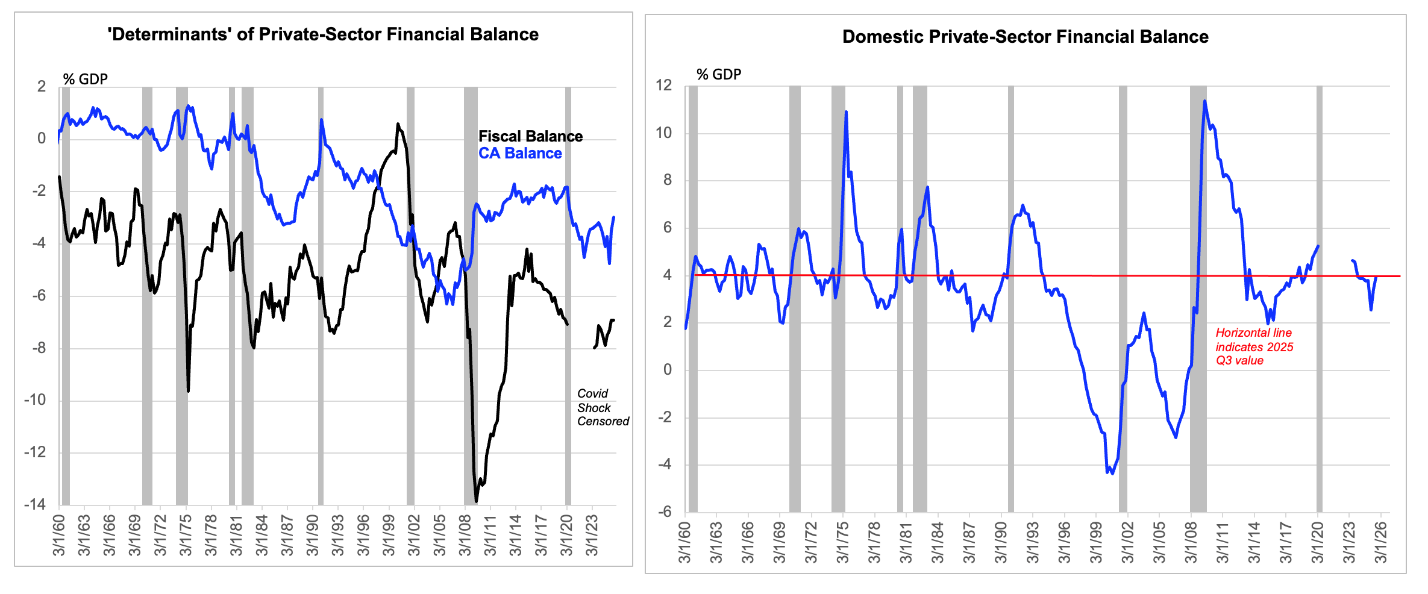
Don’t Worry About the Private Sector Being Levered Up – According to yesterday’s data, the private sector financial balance* INCREASED in 3Q and is ~4% of GDP. Heading into the 2000 and 2008 recession, the private sector balance was negative (~-4% and ~-2.5% respectively). We are not sure why some investors are worried about levered households (this came up a few times yesterday) or the current savings rate being low. Net worth as a percentage of disposable income has surged and real income growth is firm. Savings rates are likely to remain low unless the economy experiences a shock.
A graph of a graph of a graph of a graph of a graph of a graph of a graph of a graph of a graph of a graph of a graph of a graph of a graph of

AI-generated content may be incorrect.

SOURCE: BEA, 22V Research

*The domestic private sector financial balance is the difference between the fiscal deficit and the current account deficit (i.e., with the sign on the underlying balances reversed. Both are shown in the top left chart). The domestic private sector financial balance is shown in the top right chart.

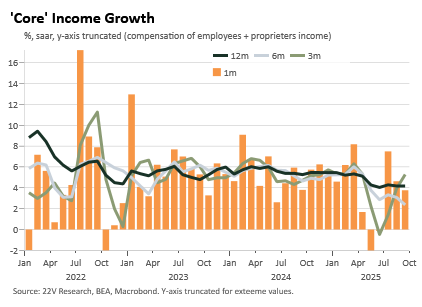
A few clients noted that ex transfer payments, consumption would be weak. From the data we see, it is tough to make that argument. To be candid, we don’t really know exactly what people are measuring when they make this point. Here is what we know, as Peter Williams highlighted to us, core income – which is earned income from workers and proprietors and ex-transfer payments (social security and Medicaid) – has been firm. It is running at a ~4% growth rate on a 12-month basis and just under 6% on a 3-month basis. It dropped sharply around liberation day but has bounced back. The spending and income data is firm.
A graph of growth and income

AI-generated content may be incorrect.

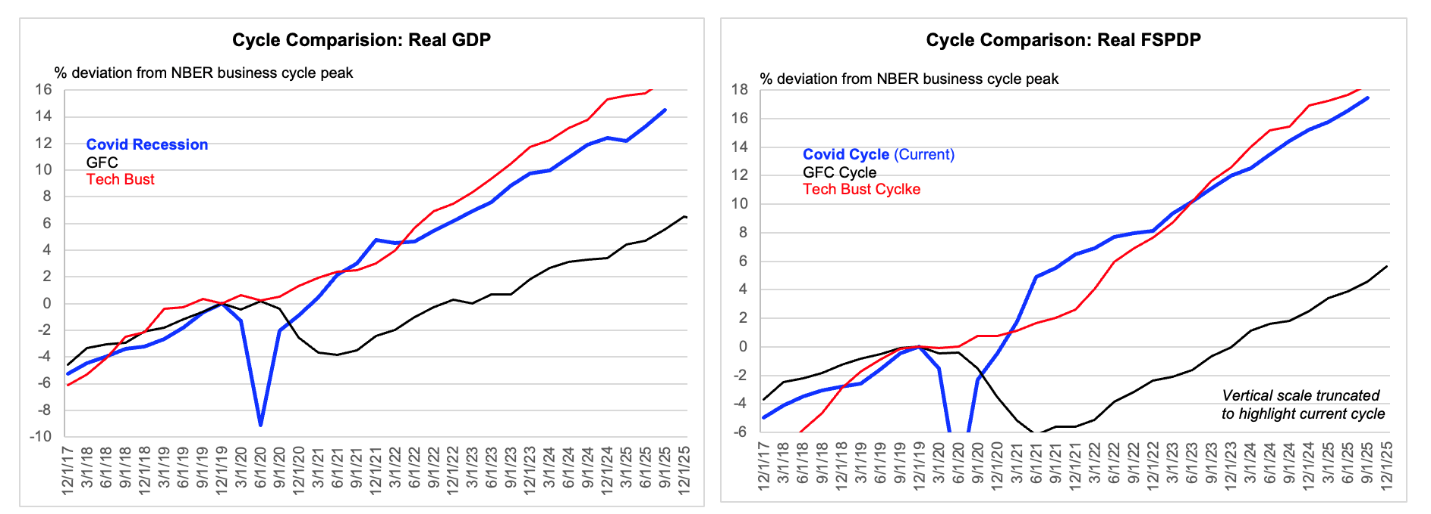
Final Demand Tracking – Real final sales to private domestic purchasers*, which is what matters most for US company earnings, rose at a 3% annualized pace. Consumption was the main driver of the GDP beat. Capex was a bit weaker. AI capex HAS NOT been the only driver of GDP. This is a point we have been over many times (HERE). The below charts highlight the trend in GDP and Real final sales to private domestic purchasers over the past 3 post recessionary cycles. Unlike the post-GFC cycle, lack of demand is not a problem this time around. Like MOST cycles, inflation is the potential constraint in this cycle. Right now, inflation is not a problem.
A graph of a graph of a graph of a graph of a graph of a graph of a graph of a graph of a graph of a graph of a graph of a graph of a graph of

AI-generated content may be incorrect.

Source: BEA, NBER, FH calculations
Data are actual to Q3

*Real final sales to private domestic purchasers is a demand-side GDP indicator that strips out trade, inventories, and government to focus on underlying private domestic demand in the U.S. economy.


DISCLOSURES AND DISCLAIMERS

Analyst Certification

The analyst, 22V Research Group, primarily responsible for the preparation of this research report attests to the following: (1) that the views and opinions rendered in this research report reflect his or her personal views about the subject companies or issuers; and (2) that no part of the research analyst’s compensation was, is, or will be directly related to the specific recommendations or views in this research report.

Analyst Certifications and Independence of Research.

Each of the 22V Research analysts whose names appear on the front page of this report hereby certify that all the views expressed in this Report accurately reflect our personal views about any and all of the subject securities or issuers and that no part of our compensation was, is, or will be, directly or indirectly, related to the specific recommendations or views of in this Report.

22V Research (the “Company”) is an independent research provider. The Company is not a member of the FINRA or the SIPC and is not a registered broker dealer or investment adviser. 22V Research has no other regulated or unregulated business activities which conflict with its provision of independent research.

22V Research, LLC is a professional services and independent publication organization. 22V Research, LLC is not a securities broker-dealer, not a member of the Financial Industry Regulatory Authority (FINRA), not a registered investment advisor (RIA) and not a member of SIPC.

Securities transactions, when offered, are offered by 22V Securities, LLC through LPS Capital, LLC. Certain employees of 22V Securities, LLC are dually registered as securities representatives of LPS Capital, LLC or Analyst Hub Securities, LLC. 22V Securities, LPS Capital and Analyst Hub Securities are members FINRA, SIPC.

https://brokercheck.finra.org/

Current Ratings Definition.

SECTOR OUTPERFORM: An “outperform” rating anticipates the company will outperform the S&P Regional Banking Index (peer group).

SECTOR PERFORM: A “market perform” rating anticipates the company will perform in line with the S&P Regional Banking Index (peer group).

SECTOR UNDERPERFORM: An “underperform” rating anticipates the company will underperform the S&P Regional Banking Index (peer group).

Limitation Of Research And Information.

This Report has been prepared for distribution to only qualified institutional or professional clients of 22V Research Group. The contents of this Report represent the views, opinions, and analyses of its authors. The information contained herein does not constitute financial, legal, tax or any other advice. All third-party data presented herein were obtained from publicly available sources which are believed to be reliable; however, the Company makes no warranty, express or implied, concerning the accuracy or completeness of such information. In no event shall the Company be responsible or liable for the correctness of, or update to, any such material or for any damage or lost opportunities resulting from use of this data. Nothing contained in this Report or any distribution by the Company should be construed as any offer to sell, or any solicitation of an offer to buy, any security or investment. Any research or other material received should not be construed as individualized investment advice. Investment decisions should be made as part of an overall portfolio strategy and you should consult with a professional financial advisor, legal and tax advisor prior to making any investment decision. 22V Research Group shall not be liable for any direct or indirect, incidental or consequential loss or damage (including loss of profits, revenue or goodwill) arising from any investment decisions based on information or research obtained from 22V Research Group.

Reproduction And Distribution Strictly Prohibited.

No user of this Report may reproduce, modify, copy, distribute, sell, resell, transmit, transfer, license, assign or publish the Report itself or any information contained therein. Notwithstanding the foregoing, clients with access to working models are permitted to alter or modify the information contained therein, provided that it is solely for such client’s own use. This Report is not intended to be available or distributed for any purpose that would be deemed unlawful or otherwise prohibited by any local, state, national or international laws or regulations or would otherwise subject the Company to registration or regulation of any kind within such jurisdiction.

Copyrights, Trademarks, Intellectual Property.

22V Research Group, and any logos or marks included in this Report are proprietary materials. The use of such terms and logos and marks without the express written consent of 22V Research Group is strictly prohibited. The copyright in the pages or in the screens of the Report, and in the information and material therein, is proprietary material owned by 22V Research Group unless otherwise indicated. The unauthorized use of any material on this Report may violate numerous statutes, regulations and laws, including, but not limited to, copyright, trademark, trade secret or patent laws.