

There are two problems with the now widely circulated view that the AI buildout is the main reason the economy has managed to continue growing despite the hit from tariffs. The first applies to what we might call the medium term – of the past six to nine months. And the second applies to a longer-term horizon, which incorporates a longer run of history as well as the outlook for the next year or so, over which the economy’s speed limit would be relevant.
Last week I wrote a couple notes on the medium-term issue. And this note focuses on the longer-term issue involving the speed limit. The main point I raise here is that the main driver of the economy’s performance over any horizon extending beyond a couple quarters is not likely to be aggregate demand considerations, at least not when the economy is away from liquidity trap, that is, when rates are not pinned to lower bound. Rather, under what we might call “normal” conditions, and absent major shocks like a pandemic or financial system collapse, growth is likely to be determined by the speed limit, which itself is heavily influenced by the economy’s supply side growth potential and the state of inflation pressures. And the influences on the speed limit have turned out to be more benign than I and many others had expected, for reasons I will review here.
Before turning to that, though, let me just quickly give a distillation of the main figures raised in my earlier two notes on this theme. During the first half of this year, the GDP rose at an annualized rate of 1.6%. (GDI grew 2.7%, so the AI overstaters should thank their stars it cannot be allocated to sectors). If we look at a decomposition of GDP growth through the lens of the expenditure data, we do find that the impetus to demand growth associated with a boom in investment spending on high tech equipment and software development can explain almost 2/3 of the growth, which I would note is not “all.” Separately, please see the Appendix for an allegory about one sector “explaining all” the growth.
NS from MSM on AI
More to the point, using the expenditure data is problematic because the data are available at only high levels of aggregation and because we do not know how much that expenditure is sourced to domestic production (as opposed to vented overseas). The output data are better because they get closer to the definition of AI and because they are – by definition – about demand being satisfied locally. These data suggest that computer and electronics production plus data processing and related activities (some of which may not be AI) accounted for 30 bps of the 1.6% (ar) increase of value added during H1. And if we add in computer systems development, much of which might be the intellectual side of AI, we can get that number to 60 bps or just over 1/3 of the total.
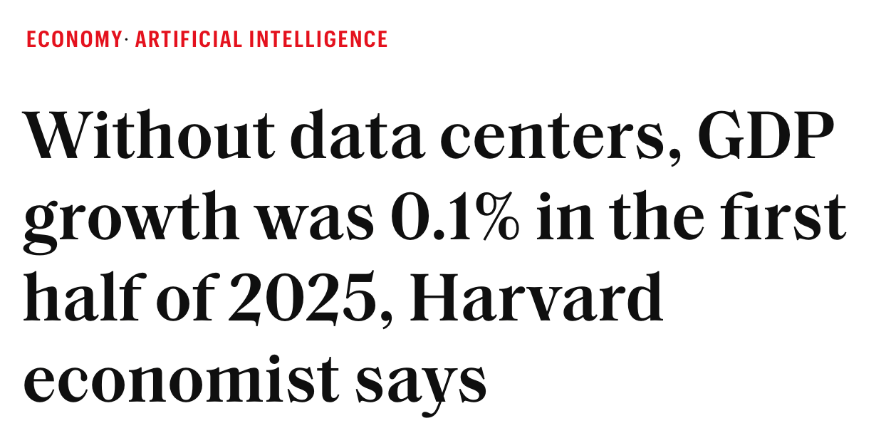
Even here, though, we can’t be confident that even most of this is about AI per se. And that brings me to this typically very silly piece from Fortune citing Jason Furman (who is not silly) to the effect that data centers explained all but 10 bps of the growth of the economy during H1. I would focus on different bits or arithmetic than Dr. Furman does, for reasons I have been over. But of course, Fortune cannot even get Furman’s own point quite accurately in their headline. He said all high tech equipment spending plus data centers. Data centers are buildings, bruh.
The idea that it was all data centers is particularly dubious, although to demonstrate this point I have to return to the expenditure side of the GDP accounts, where the BEA newly has a specific line item in the structures investment figures dedicated to them. Between Q4 2024 and Q2 2025, nominal expenditures on data center construction rose from $35.6 billion (ar) to $40.4 billion, taking it to 1/8 of 1% of GDP and adding 3.5 bps (ar) to the domestic demand growth rate during the period. Presumably most of this demand was satisfied by a rise in domestic production somewhere.
The add from bricks, mortar and HVAC in data centers is apparently trivial. But what makes this interesting is that it might help us put a limit on the value add from AI related chips production. Even if there are 4 dollars of value added from domestic chip production for each dollar of structures investment in data centers, the add to GDP growth from this source would be only 5 times as large as the impetus from building the structures themselves. That is, it would be 17.5 basis points. Of course, it is possible they are sticking the chips in old buildings. I don’t know. But the wilder claims do not pass the smell test.
At some point, you have to figure the Fed has greenlighted this, even if in stages
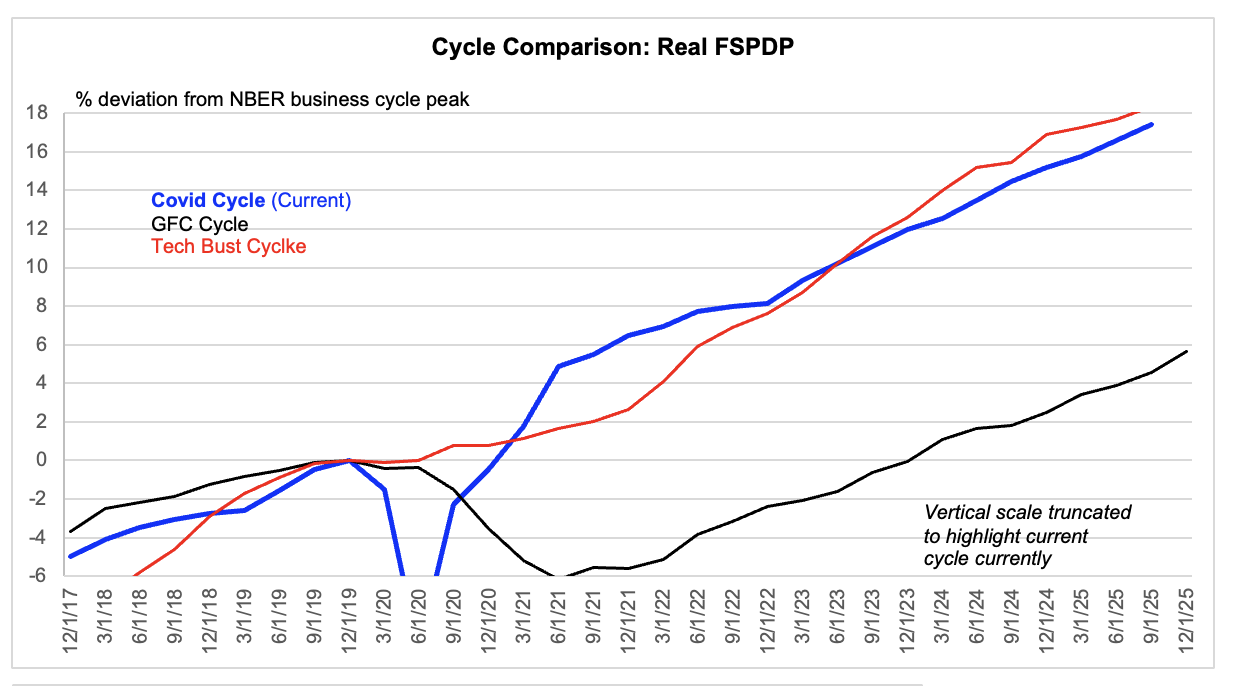
Data are actual to Q2 and estimated for Q3.
FSPDP stands for final sales to private domestic purchasers, often taken to be core GDP.
Ok, so that is my distillation of the main points from my earlier notes. Now let’s move on the novel part of this note dealing with the speed limit. The Fed’s financial conditions index has eased dramatically since the end of 2022, moving from the tightest outside the GFC to easiest outside the immediate wake of the Covid shock. The estimated impact on year ahead GDP growth (which is how it is scaled) has swung from a drag of 1 percentage point to an impetus of just over 1 percentage point. And this easing trend has persisted virtually without interruption during the past six quarters, even though core GDP growth during the six quarters to (estimated) Q3 has run at almost 3%!
There are lags from monetary policy to their real effects on the economy, but it is pretty obvious that the Fed has blessed this demand boom. With lower confidence, we might insist also that it is comfortable with much of it continuing, because Powell keeps repeating that he does not want the labor market to ease any further. That would require GDP growth in line with productivity growth, which has recently been running at 2% — although, I concede a continuation of that is not guaranteed.
%*^$*#(&!
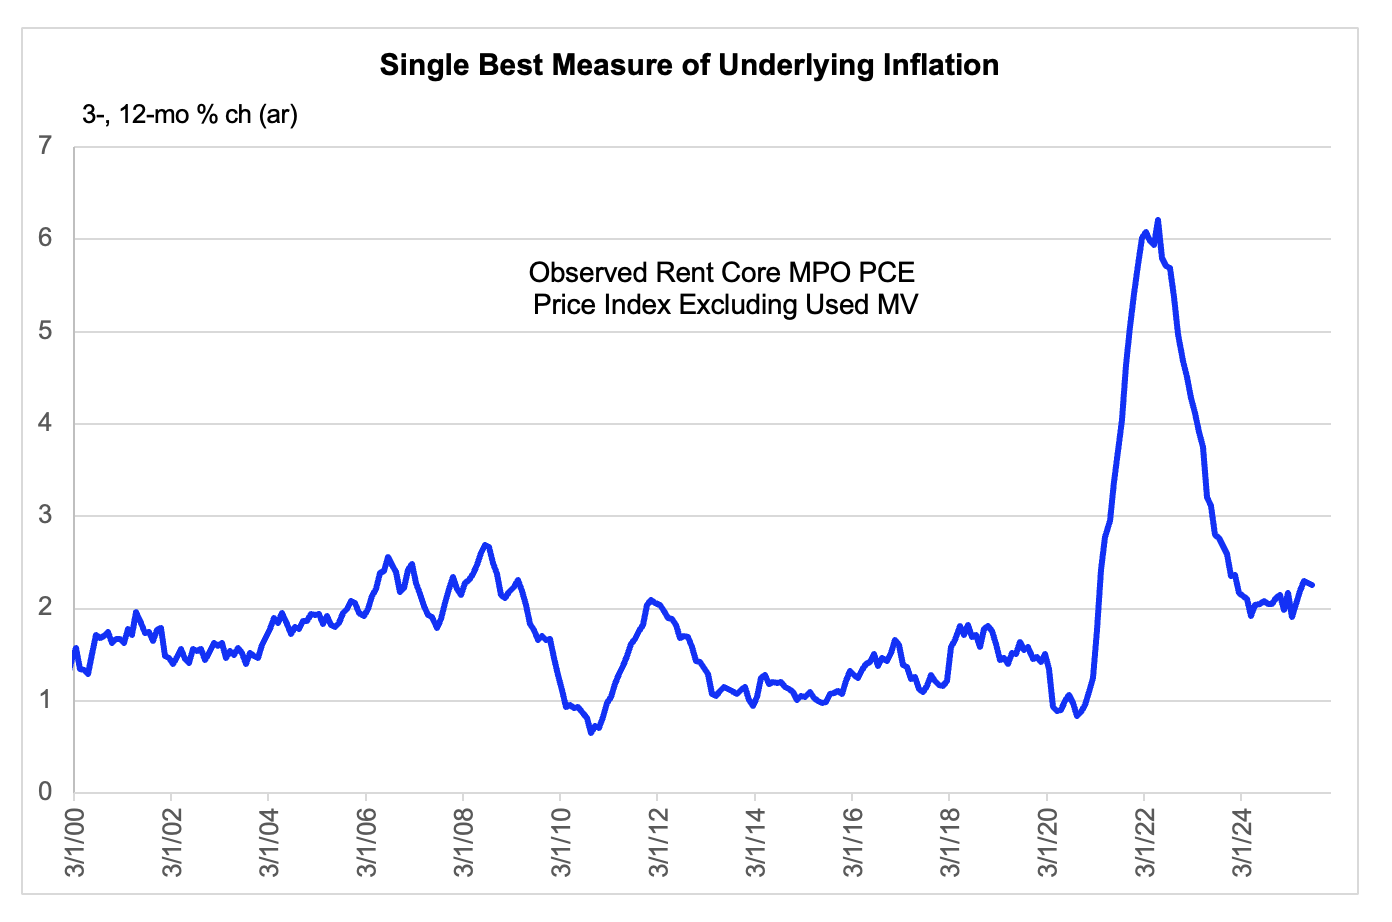
Data are actual to August
There have been two major forces behind the Fed’s willingness to see demand growth that has been reasonably strong by historical standards, both of which have proven awkward for an analyst that has had my priors! Let’s take these in chronological order. The first development was a surprising deceleration of underlying inflation from the peaks achieved (in the short run rates) during 2022 in response to the Covid shock and (inflationary) fiscal policy response to it. Inflation remains an issue and is a key reason that Powell is not aiming for above-trend demand growth. But absent this surprising disinflation, the economy might well have fallen into recession. You may recall that one of the dovish arguments offered at peak inflation was that a standard recession couldn’t even cure it, so why bother. 😉
More recently, we have had a new worry, which has been the steep deceleration of the breakeven employment growth rate, which I discussed in my note yesterday. With Powell averse to a tightening of the labor market because of remaining inflation worries, and with the labor force growing so slowly, it seemed as though we were fated for very slow employment growth (correct) and therefore slow aggregate demand growth (incorrect). In the event, the Covid shock seems to have delivered an impetus to productivity growth which has now run long enough (five years) to have actually mattered to the economy’s aggregate performance. On my eyeballing of the data (as I expect it ultimately to be revised), productivity growth has accelerated from a trend rate of 1% pre-Covid to about 2% since Covid. And during the middle two quarters of this year, productivity growth appears to have run at about 3%. The post Covid inflection higher has allowed the economy to grow at a decent rate, even as Powell has delivered the labor market ease (i.e. lower e/pop ratio) that seemed to be required to handle the remaining inflation worry. And just from a pure accounting perspective, leaving entirely aside whether it is indicative of a trend, the economy has recently been able to grow above 2 ½% without any help from additional labor input. It is obvious in the numbers. It is also obvious from Powell saying that he is concerned to stop labor market ease. That he can lead with that with the economy performing so far above recession is mostly about productivity.
This is not to say that the economic expansion is now secure. Stalled employment does raise the risk of a self-reinforcing downward spiral, although that risk is probably less than typical for reasons I argued in yesterday’s note. The inflation impetus from tariffs is still mostly to come, which reinforces the point that renewed labor market tightening will not be welcome any more than ease would be – according to Powell. And if the recent hard-to-understand acceleration of productivity somehow falters, then confining aggregate demand growth to “potential” might again mean containing it to a dangerously slow growth rate.
But unless you believe that the ability to create a fake video of Sam Altman peeing on the flag is behind the productivity rise and (earlier) disinflation, then our success to date has not really had much to do with AI, certainly not from the speed limit perspective, and probably not even mostly from the demand impetus perspective that would be dominant over the shorter horizon.
Appendix: An allegory on bean counting GDP growth
Leaving aside the measurement issues that I am convinced just totally disqualify the thesis anyway, imagine the following economy in which 1/6 of it “explains all” the growth. This economy has three sectors, one of which is 3/4 of the total and the remaining two of which are each 1/8. During some period, it does not matter how long, the larger sector grows 2% and thus delivers an impetus of 1.5 ppts to the overall growth rate. The other smaller sectors are far more volatile. One grows 9% to deliver an impetus of 1.5 ppts and the other contracts 9% to deliver a drag of 1.5 ppts. If we were to exclude the rapidly growing sector, then the GDP-X growth rate would be zero. So, that 1/6 would “explain” all the growth, even though 3/4 of the economy is growing at 2%. I do not believe such a claim would be clarifying of what is actually going on, even if it were true, which we could debate separately.

