This paper introduces our Federal Reserve Sentiment Score (FRSS) which leverages LLMs to track and analyze Federal Reserve Sentiment across a variety of economic and investment themes. Our aim is to quantify bulky Fed information and documents into insightful charts and actionable output, making it easier for investors to objectively grasp macro investment signals.
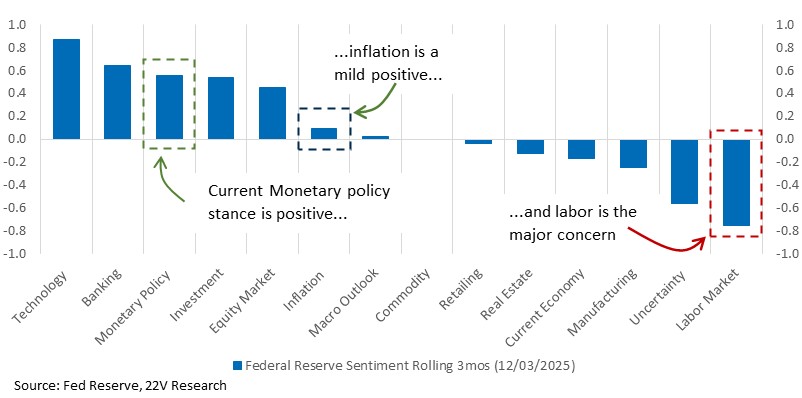
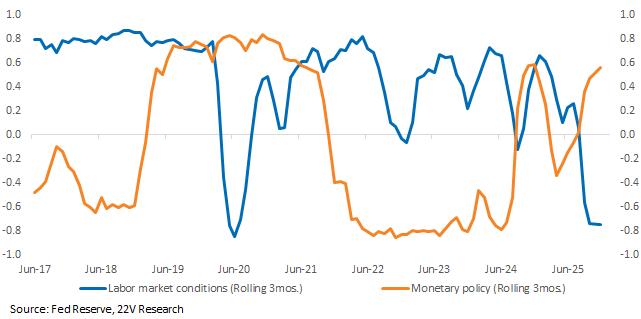
Ahead of the December FOMC meeting ahead, current sentiment readings indicate monetary policy sentiment is positive and to historical levels. That is consistent with futures markets putting 95% odds on a rate cut at this meeting. The motivation for that cut is deteriorating labor market sentiment. Inflation sentiment has been mild recently, also helping to support a cut.
In addition to tracking the current level and changes of Fed sentiment towards each category the FRSS creates a tool for observing how sentiment shifts with macro series. This helps us quantify policy risks ahead of data releases. There has been a strong correlation between pillars of Fed sentiment and corresponding macro series, which we lay out in more detail in the full report.
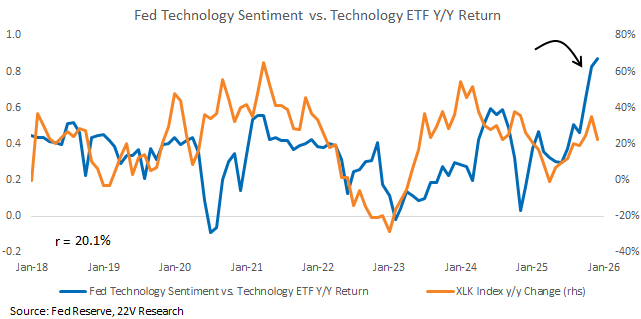
Though the Fed sentiment mostly a macro consideration, sector sentiment also has implications for market performance. Fed sentiment towards Technology has climbed sharply this year, reaching its highest level historically. The suggestions is a continued tailwind to the Tech sector.
Overview
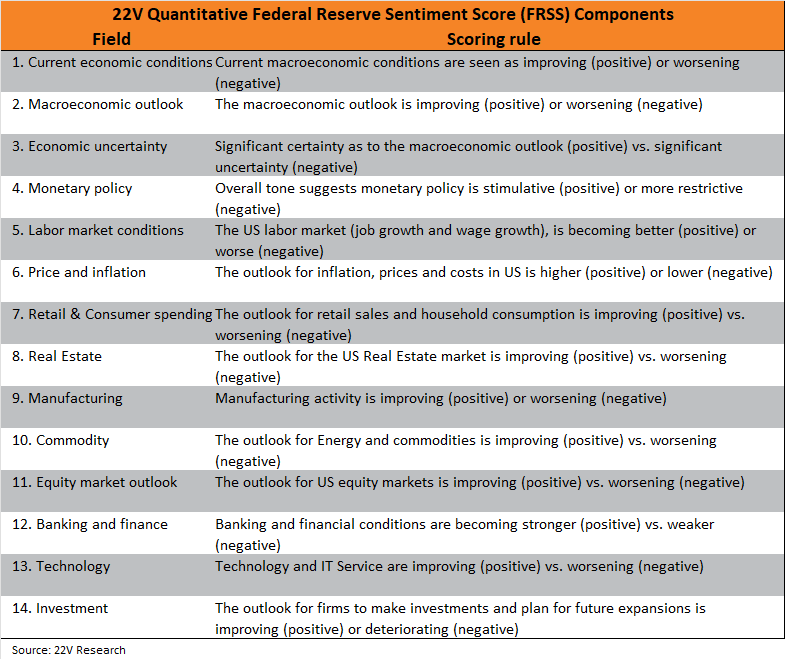
Federal Reserve Sentiment Score (FRSS) uses ChatGPT to analyze changes in Federal Reserve sentiment across 14 distinct categories listed in the table below. The input documents include speeches by Federal Reserve Officials, Fed Meeting Minutes, FOMC Introductory Statements, and Press Conference Transcripts.
Methodology
Similar to the China Economic Sentiment Series (CHESS) analysis launched by 22V China Research Team (whitepaper HERE), we used the steps listed here to extract documents and generate output for each of the following categories:
1. Data Collection and Document Processing
We gather Federal Reserve communications from official sources, including speeches dating back to 1996, Beige Book reports from 2006 onward, and comprehensive FOMC communications including transcripts, meeting minutes, policy statements, and economic projections. These materials are processed into standardized formats suitable for analysis, with particular attention to organizing Beige Book reports into national summaries and regional district reports for granular analysis.
2. Sentiment Analysis Applying ChatGPT
We employ OpenAI’s ChatGPT 4.1 to assess sentiment across key economic and financial dimensions relevant to investment decisions. The prompt asks ChatGPT to assume the role of a professional investor to evaluate each of the categories with a scoring system ranging from -2 to 2 (most negative to most positive) and 0 represents neutral sentiment. If the document is not relevant to the outlook in a specific category, “NA” will be filled. Each document receives three independent assessments to ensure consistency and reliability.
3. Sentiment Index Compilation
To identify meaningful trends and reduce daily volatility, we apply rolling average calculations using two primary windows: a 30-day (1-month) rolling window for near-term sentiment tracking and a 91-day (3-month) rolling window for medium-term perspective. The sentiment index for each window is calculated using the following formula that balances positive and negative sentiment while accounting for the volume of relevant content:
Sentiment = (Positive Counts + Negative Counts) / (1 + Positive Counts + Negative Counts)
where Positive Counts represents the sum of all positive sentiment values and Negative Counts represents the sum of all negative sentiment values within the rolling window.
To facilitate comparison across different time periods and categories, we further transform these rolling sentiment scores into normalized z-scores, which measure how current sentiment deviates from its five-year historical average.
Use Case
Federal Reserve Sentiment Score (FRSS) creates an objective way of measuring Fed sentiment and monitoring sentiment changes toward monetary policy, the macro backdrop, and specific sectors. Such information, together with economic data, help us predict Fed actions as well as economic turning points. Below we lay out a few use cases ahead of December Fed meeting, and what current sentiment scoring suggests.
Current Fed Reserve Sentiment
The latest FRSS shows the Fed officials think policy is supportive, inflation is improving, and the Labor Market is a source of risk. Though the latest nonfarm payroll was better than expected, readings were mixed with the unemployment rate rising. The bottom line is that Fed officials think inflation is contained and are deeply worried about the labor market.
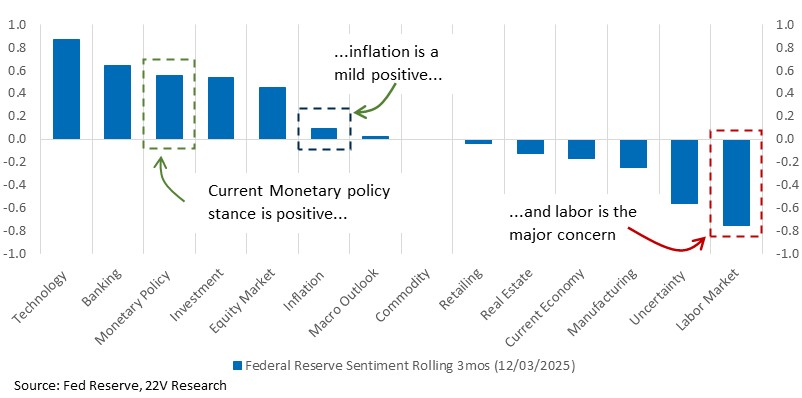
Labor Market sentiment is currently near the lows seen during COVID, suggesting DEEP concerns by the Fed about weakening demand for workers. That concern helps quantify the Fed’s bias to keep policy accommodative.
Fed Reserve Sentiment Changes
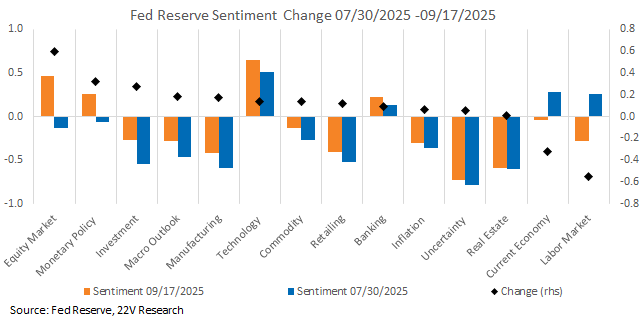
Applying the Fed sentiment score, we can compare sentiment moves across all categories to see how sentiment has changed over time. Between 7/30/2025 and 9/17/2025, the dates of the most recent FOMC meetings, Equity Market sentiment showed the most positive change, aligning with the 3.7% S&P rally during that period. Monetary Policy sentiment was the second-most positive category, reflecting an increasingly dovish tone during the cutting cycle while the labor market saw the most negative change.
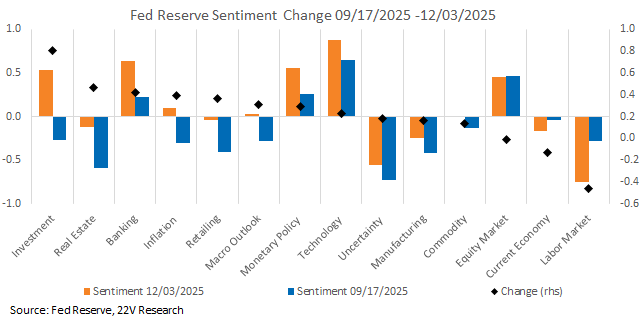
Since 9/17, there were no FOMC meetings due to the government shutdown, but we can still use Federal Reserve sentiment data to track changes in sentiment. Investment sentiment was the most positive category, while labor sentiment continued to fall. From this perspective, we expect the December FOMC meeting to continue to express concerns toward the labor market and that a cut remains the most likely outcome of the meeting.
Interestingly, Monetary Policy has the second highest increase between 7/30 and 9/17 but has now fallen to sixth out of fourteen. Real Estate and Banking saw a significant positive change from 9/17 to 12/3, partially reflecting the recovery from a series of bankruptcy headwinds earlier this year and some recovery of the Real Estate market.
Fed Reserve Labor Market Sentiment and Unemployment Rate
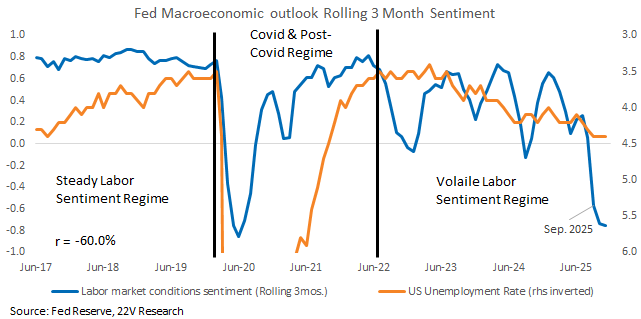
The comparison of Fed sentiment with corresponding macro series helps us identify divergences and turning points for macro series. Taking the urate as an example, we split the period from 2018 to the present into three regimes based on the Fed’s Labor Market Condition Sentiment: Steady Sentiment, Covid & Post-Covid, and a Volatile Regime.
Steady Labor Sentiment Regime: From Jan 2018 to Jan 2020, as unemployment rate steadily decreases, with Fed Sentiment remained at a very high level (~0.8 z-score).
Covid & Post-Covid Regime: From Jan 2020 to Sep 2022, the URate spiked during Covid and fell back post-Covid to its pre-Covid Level, with Fed Labor Market Sentiment crashing during Covid and recovering to the pre-Covid level.
Volatile Labor Sentiment Regime: From September 2022 to September 2025, the unemployment rate gradually increased and Fed sentiment fluctuated, reflecting inconsistent and hesitant views toward the labor market. During this regime, although Fed sentiment towards labor was volatile, it was also consistently positive.
Since 2020, the volatility of the Fed sentiment towards the labor market significantly increased. Starting in September 2025, Fed sentiment toward labor market conditions dropped sharply to COVID-period levels. This suggests that the Fed may be exiting the Volatile Regime and now views labor market conditions as a serious concern.
Fed Reserve Sentiment and Macro Sentiment Divergence
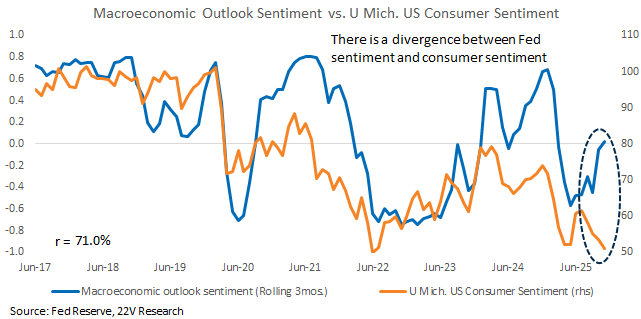
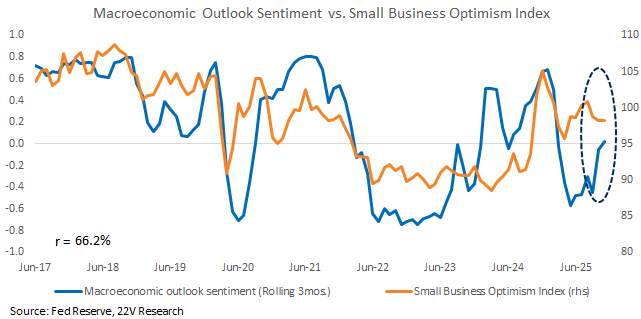
Since 2018, Federal Reserve sentiment toward the macroeconomic outlook has been highly correlated with both consumer and small-business sentiment, with the correlation vs. Mich. US Consumer Sentiment Index and the NFIB Small Business Sentiment Index at 71% and 66.2% respectively. Every sharp drawdown in consumer and small-business sentiment has been accompanied by a corresponding decline in the Fed’s sentiment toward the macroeconomic outlook.
More specifically, the Mich. US Consumer Sentiment Index typically acts as a leading indicator for Fed macro sentiment: the Fed’s sentiment peaks and bottoms tend to occur after the inflection points in consumer sentiment.
However, since June 2025, the pattern shows a clear divergence between the Fed Macro Outlook sentiment and both consumer and small-business sentiment. Consumer sentiment and small-business optimism have both declined, while Fed macroeconomic outlook sentiment has risen significantly. The Fed seems to view the macro backdrop better than does SMB and consumers suggesting a risk that the monetary policy reaction towards real economy will be slow.
Using FRSS to Forecast/Nowcast Lower Frequency/Missing Macro Data
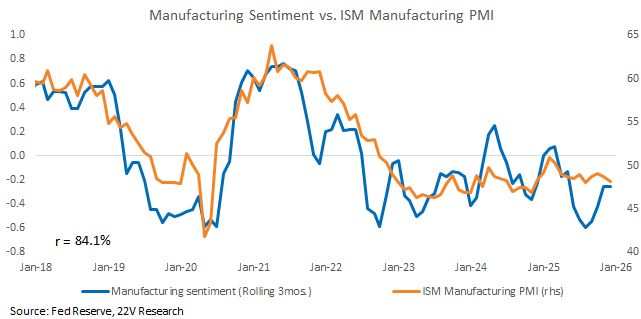
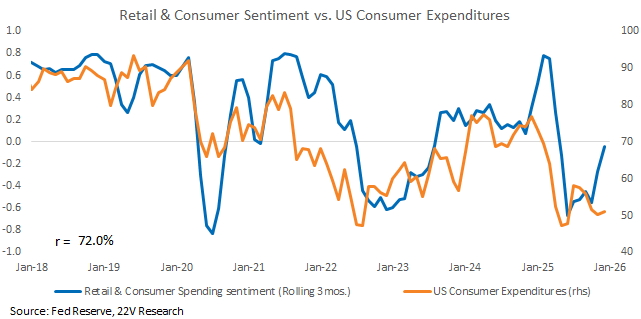
FRSS captures sentiment across a combination of documents including daily frequency Governors’ Speeches, offering us the latest sentiment towards macro trends. We can use the sentiment before macro data are released to nowcast the trend of upcoming macro series, or to forecast the marco variables when they are missing during periods like the recent government shutdown.
For example, Fed Sentiment in Manufacturing has an 84.1% correlation with the ISM Manufacturing PMI index, offering us information on the trending of PMIs. Manufacturing sentiment rebounded recently, suggesting potential improvement for the Manufacturing PMI.
Correlation between Fed Consumer sentiment and consumer expenditures is high as well. Recently, there has been a sharp reversal for consumer sentiment expressed by the Fed. With consumer expenditure indicating more upward potential for the series.
Fed Reserve Sentiment and Sector Moves
The Fed comments about specific sectors have implications for stock performance as well. The chart below shows an example of the Federal Reserve’s Technology sentiment vs. Tech ETF XLK’s y/y return. XLK’s performance has been correlated with the Fed sentiment historically. Recently, Fed sentiment towards Technology has climbed sharply, reaching an historical high. XLK returns have slipped recently due to AI headwinds. For what it is worth, Fed speakers do not share the negative sentiment that has crept into investor views.