

SUMMARY
- 22V’s China Economic Sentiment Series (CHESS) leverages the flexibility of LLMs to analyze sentiment across multiple areas of China’s economic and financial outlook
- Back-testing suggests that CHESS sentiment can help investors identify and confirm directional changes in economic data and Chinese equity markets
- Comparing sentiment across categories is a way to understand the drivers for changes in the outlook and potential catalysts
In late April, 22V debuted the China Economic Sentiment Series (CHESS), a new tool from our China and Quant teams that uses sentiment analysis to help international investors monitor China’s economy and financial markets. Our launch report (link HERE) introduced CHESS and focused on what recent sentiment data signal about China’s outlook, followed by a second monthly update on May 30 (link HERE). This white paper serves as a broader reference piece, with more details on CHESS’ methodology, back-testing, and applications.
OVERVIEW
CHESS uses ChatGPT to assess daily changes in sentiment towards the economy and financial markets among analysts commenting in China’s domestic financial media. By translating analysts’ qualitative opinions into a series of real-time, quantitative indexes, CHESS provides international investors with a tool to monitor changes in the outlook and to understand the drivers behind those changes.
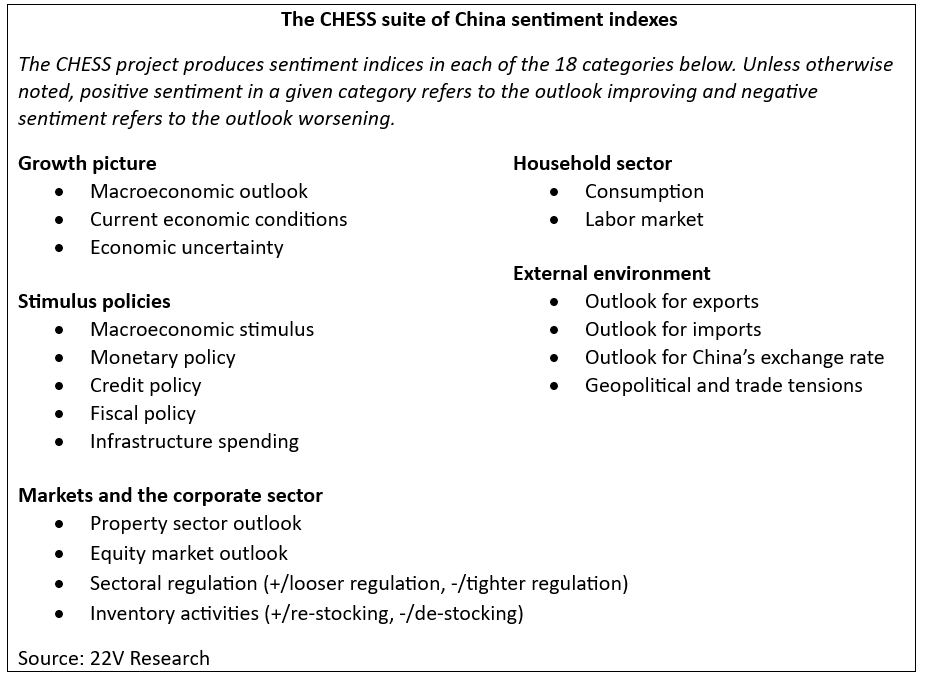
CHESS indexes measure sentiment in 18 distinct categories (see table below), including analyst views as to the growth outlook, current economic conditions, expectations for stimulus, and sectoral dynamics in areas such as property and the equity markets.
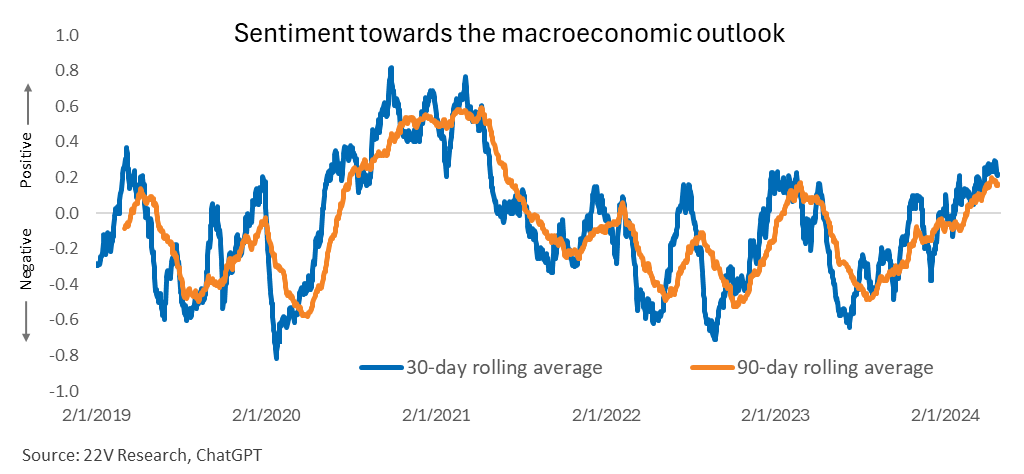
As an example, the chart below shows how sentiment towards the macroeconomic outlook has evolved since early 2019. Both 30-day and 90-day rolling averages for sentiment are shown.
METHODOLOGY
Below are the steps involved to produce and maintain the CHESS indexes:
- Assemble and update the library of articles
- The current source material for sentiment analysis is commentary pieces appearing on the opinion channel of one of China’s more respected financial news sites. Authors include domestic and international sell-side economists, prominent think tank and academic economists, and other high-profile commentators.
- 22V scrapes the URLs and downloads the content of every article. The library currently goes back to 2019.
- Analyze article sentiment using ChatGPT 4
- Using OpenAI’s ChatGPT API (application programming interface), 22V prompts ChatGPT to read each article and to assess the sentiment across 18 categories relevant to the outlook. The prompt specifically asks ChatGPT to assume the role of a professional investor looking for signals relevant to the outlook.
- The prompt asks ChatGPT to score sentiment in each of the 18 categories on a scale of -2 (very negative) to +2 (very positive). If the commentary is not relevant to the outlook in a specific category, the prompt instructs ChatGPT to return a score of “NA.”
- In addition to these category-based sentiment scores, 22V prompts ChatGPT to score the relevance of the article as a whole to the economic and financial outlook. This provides another layer to ensure that only relevant articles are included in the sentiment indexes.
- The output of ChatGPT’s analysis of each article has 19 fields: sentiment in each of the 18 categories (including those labelled “NA”), and a score for the level of relevance.
- Compile the sentiment data into indexes
- 22V groups each article by date and compiles these into a normalized daily score for each sentiment category. Following a widely used practice for sentiment analysis, we use the following formula to calculate the daily score: (sum of positive sentiment values – sum of negative sentiment values)/(1 + sum of positive sentiment values + sum of negative sentiment values)
- To smooth the data, 22V calculates a 30-day rolling average and 90-day rolling average for each sentiment index.
- 22V also calculates a z-score sentiment value (how much daily sentiment diverges from the five-year trend), which can be useful when comparing various categories of sentiment.
Working with ChatGPT: Motivation and Validation
CHESS’s sentiment analysis uses ChatGPT 4 rather than natural language processing (NLP). NLP tools have been the mainstay for sentiment analysis in finance, including in the 22V quant products which analyze the content of US corporate earnings calls (see an example HERE).
There were two reasons we decided to use a large language model (LLM) approach rather than NLP for CHESS. First, in developing CHESS as a new tool to monitor various aspects of China’s macro outlook, we wanted the flexibility to look across multiple categories and to add or change categories over time. This would have been difficult using NLP tools, which are powerful but require extensive training of machine learning algorithms, which is often limited to a specific context. Another limitation in the China context is that many NLPs lack native Chinese language capabilities, requiring texts to be translated into English or another Western language and thus adding to risk of missed nuances.
A number of studies have demonstrated that ChatGPT and other LLMs can, in the right context and with the right prompting, produce results that rival those of NLPs. One example includes classifying the hawkish/dovish sentiment of Fed statements (link to study HERE), an application comparable to the task of CHESS. In initial testing of LLMs, we found that ChatGPT 4 has an impressive ability to read Chinese language texts, to capture nuances in discussion of the economic and policy outlooks, and to provide cogent explanations for the sentiment scores it assigns.
The most time-intensive aspect of the development process was crafting a prompt that would have ChatGPT examine the appropriate criteria (signals bearing on the economic and financial outlook) and produce stable outputs. We experimented with different “temperature” settings for ChatGPT, which involve a trade-off between consistency and creativity in ChatGPT’s responses. With our final prompt, different runs of ChatGPT were producing the same sentiment score around 98% of the time.
To validate our prompting approach, we compared ChatGPT’s sentiment and relevance scores using the close-to-final prompts against a batch of articles scored by five human analysts. In most categories, ChatGPT and the average of human scores agreed 70-90% of the time. We judged this to be an acceptable percentage, particularly since there was significant variation among scores provided by the human taggers. We eliminated two categories in which ChatGPT and human taggers agreed last than 60% of the time. Otherwise we made only minor tweaks to the final prompts after this testing.
We intentionally did not train ChatGPT against historical economic data or modify the prompts to optimize the fit with historical data. We were conscious of not over-fitting to the past, and instead wanted to preserve CHESS’ flexibility to capture relevant signals as they evolve over time. This is especially important for an economy undergoing structural change, as is the case for China. Patterns or key words that would have been relevant in a previous period, such as that between real estate and overall economic growth, may not hold up as reliable signals for the outlook moving forward.
Source material for CHESS: Is analyst bias an issue?
Analysts and financial media outlets in China face government pressure (usually informal) to limit the negativity of commentary and reporting on the economy, with the amount of pressure fluctuating over time. While we selected a financial news website known for the relative independence of its views as the source of commentary for CHESS, the broader political environment raises the questions of whether there is a positive bias to the commentary and whether it matters.
While bias is hard to measure, there are strong reasons to conclude that the sentiment signals from analyst commentary are still valuable for investors. First, the main utility for investors using CHESS and other sentiment analysis is to look at relative rather than absolute changes in sentiment: e.g., are views towards the outlook more/less negative than several months ago? From this standpoint, the CHESS sentiment series show very substantial shifts in sentiment from day-to-day and month-to-month, which correspond to observable changes in the economic situation and the policy outlook.
Finally, it is not hard to find periods of pronounced negative sentiment. As one example, sentiment towards current economic conditions (and most other categories) worsened abruptly in early 2023 when it became clear that economic momentum from the initial post-Covid boom was quickly fading without major stimulus support. By the summer, sentiment was as low as during Shanghai’s Covid lockdown in spring of 2022 – a sharper fall than much of China’s official data implied but likely a more accurate reflection of the depth of the downturn.
RELATIONSHIP OF CHESS TO ECONOMIC AND FINANCIAL DATA
In this section we summarize initial results from back-testing signals from CHESS against financial and economic data. More details and underlying data are available on request.
Because sentiment data tend to be volatile, they are generally more useful for identifying inflection points in the economic and financial outlook, and predicting/confirming directional moves, than trying to forecast levels such as monthly industrial production or stock prices. This is also worth keeping in mind when looking at summary statistics such as regression coefficients between sentiment and economic/financial data, which are useful as a reference but do not always capture the two-way interactions between the two.
Economic data
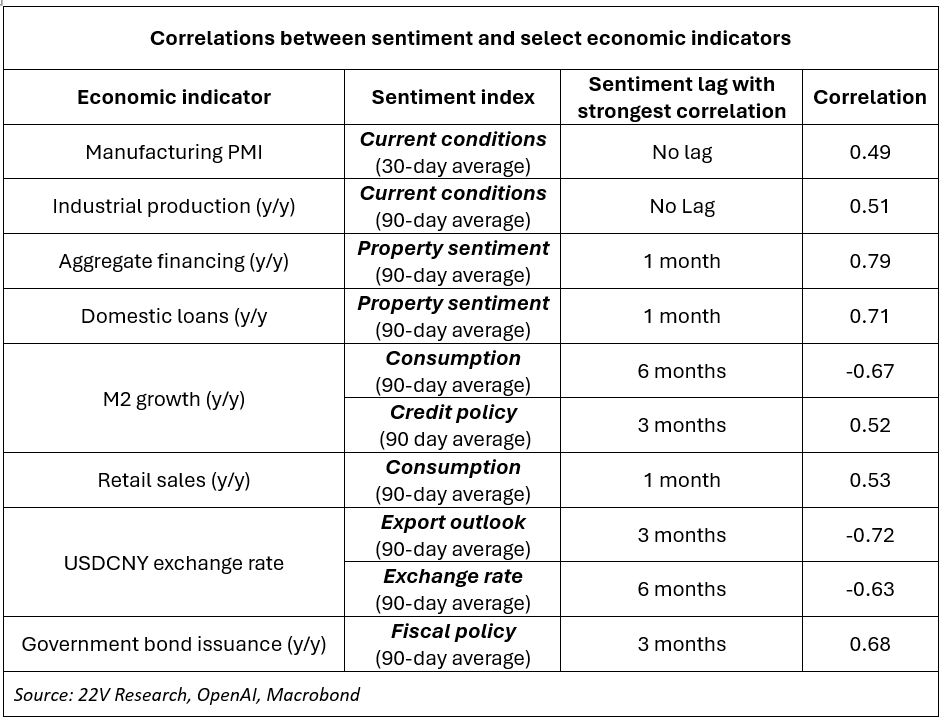
Initial tests suggest that CHESS indices have predictive value for relevant economic indicators. In the table below, we show some examples of sentiment indexes that have strong correlations with relevant economic data. Note that the correlations are sometimes strongest when sentiment is lagged by 1-6 months. The fact that property sentiment is the strongest predictor of credit growth in China speaks to the key role of housing in the financial system.
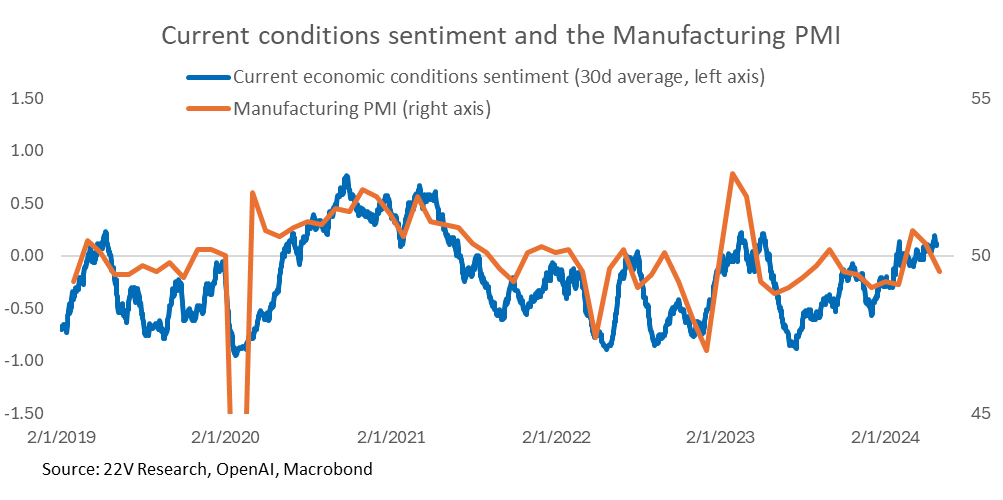
To further tease out the relationship between sentiment and economic data, we conducted more detailed tests of sentiment towards current economic conditions – one of the key CHESS indexes – and various monthly data series:
- We first applied Pearson and Spearman correlation coefficients to explore linear (Pearson) and non-linear (Spearman) relationships between current conditions sentiment and the economic data. This found strong correlations (between ±0.5 and ±1) for both Pearson and Spearman for China’s PMI surveys, growth in aggregate financing (“social financing”) and industrial production. There were moderately strong correlations (±0.3 and ±0.5) for retails sales, loan growth, fixed asset investment and consumer confidence. Almost all of the indicators had a higher absolute value in Spearman than Pearson, suggesting that sentiment scores have a non-linear relationship with these indicators.
- We next employed a commonly applied OLS linear regression method. By detrending via adding a dummy variable for months, we estimated the correlation coefficient between sentiment and key macro data series. There were strong and statistically significant relationships between current conditions sentiment and data including aggregate financing growth, the manufacturing PMI, loan growth, consumer confidence, and industrial production. Reassuringly, those indicators which showed strong linear or non-linear correlations in step one (above) have higher and more significant coefficients here.
Taken together, these steps show a strong predictive and non-linear relationship between current conditions sentiment and China’s monthly economic activity, especially the manufacturing PMI index, credit data (loan growth and aggregate financing), industrial production, and consumer confidence.
CHESS and China’s equity markets
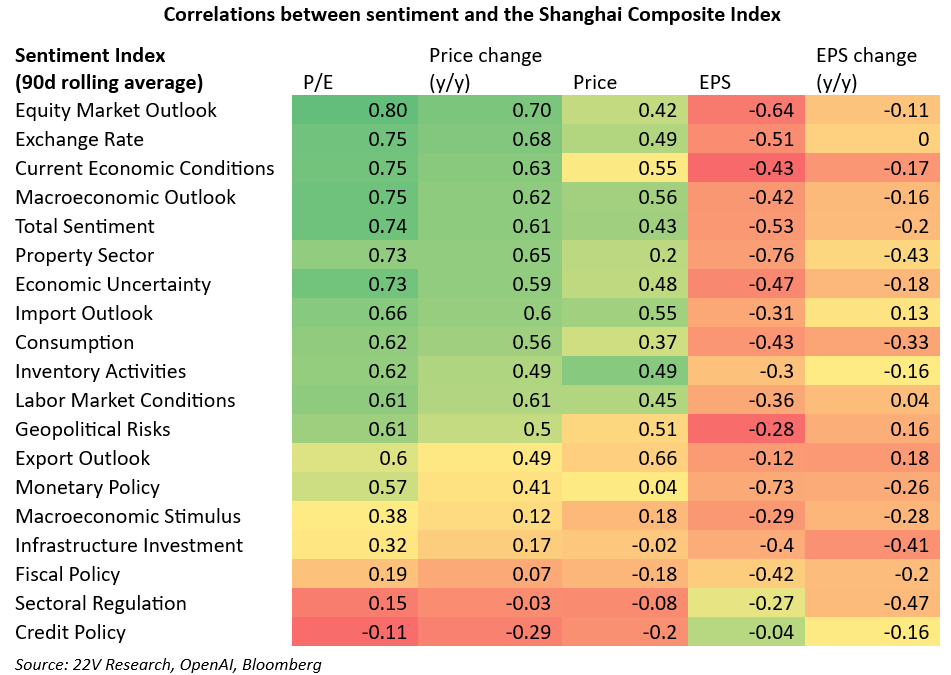
The table below shows the results of initial back-testing of CHESS sentiment data against the Shanghai Composite Index (results are similar for the Shenzhen Composite Index). A few key points stand out:
- Sentiment shows the strongest correlations with (in order) the p/e ratio, year-over-year change in equity prices, and equity prices. (The strong correlations for year-over-year changes likely reflect seasonal patterns with sentiment data rather than with equities themselves.)
- The sentiment indexes with the strongest correlations with equity price dynamics are equity market outlook, exchange rate outlook, property sector outlook, current economic conditions, macro outlook, and finally the export outlook – which has the highest correlation of any sentiment index to equity prices when not adjusted for year-over-year changes. It is thus sentiment towards the financial markets and towards economic conditions that are most correlated with equities; somewhat surprisingly, categories related to stimulus expectations show only a weak correlation to equities.
- It is not clear why sentiment shows a negative correlation with equity market fundamentals (eps and eps growth y/y) though it may be due to a long lead time for changes in the economic outlook to impact earnings.
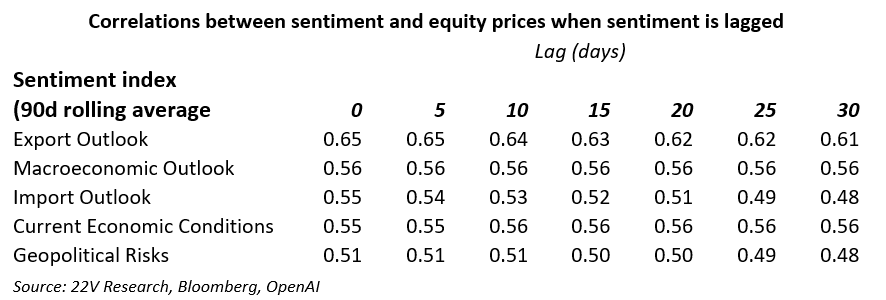
There is significant short-term persistence to sentiment signals. The table below shows correlations between sentiment indexes and the Shanghai Composite price when sentiment is lagged by 0-30 days. The pattern of persistence is similar for sentiment and the p/e ratio and year-over-year changes in price.
Implications: As with the above discussion of economic indicators, sentiment data is likely to be more useful for identifying and confirming inflection points and directional changes in the equity market outlook than as a tool to forecast specific stock price levels. The chart below shows the CHESS macro outlook sentiment index and the year-over-year change in daily equity prices since 2019. There are several instances where sentiment turned well ahead of equities – such early 2020 (market bottom), mid-2021 (market top) and the fall of 2022 (market bottom) – and other periods in which equity price signals have come first.

USING THE FULL CHESS SUITE: SENTIMENT ACROSS CATEGORIES
While the sections above discuss using CHESS with economic and financial data, we also see one of the advantages of CHESS as the ability to compare various categories of sentiment as a way to understand which factors are driving the economic and financial outlook. Below are a few examples, taken from our first two monthly CHESS updates.
Impact of property measures
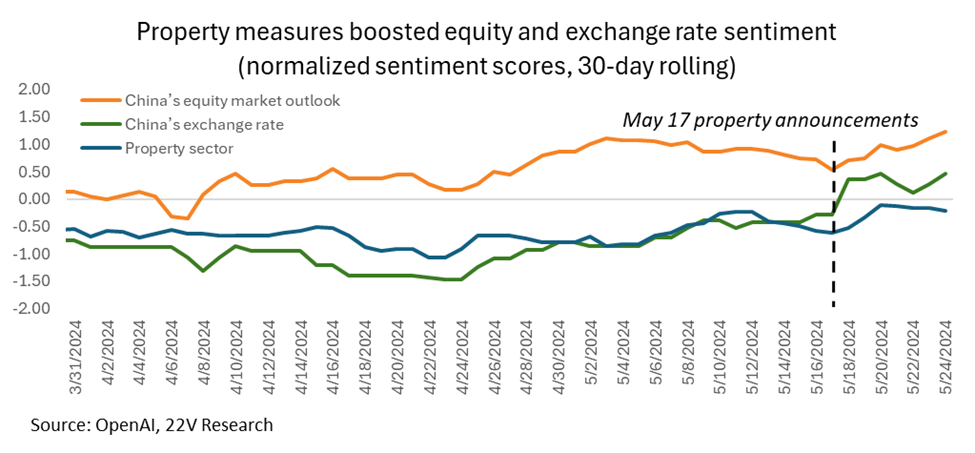
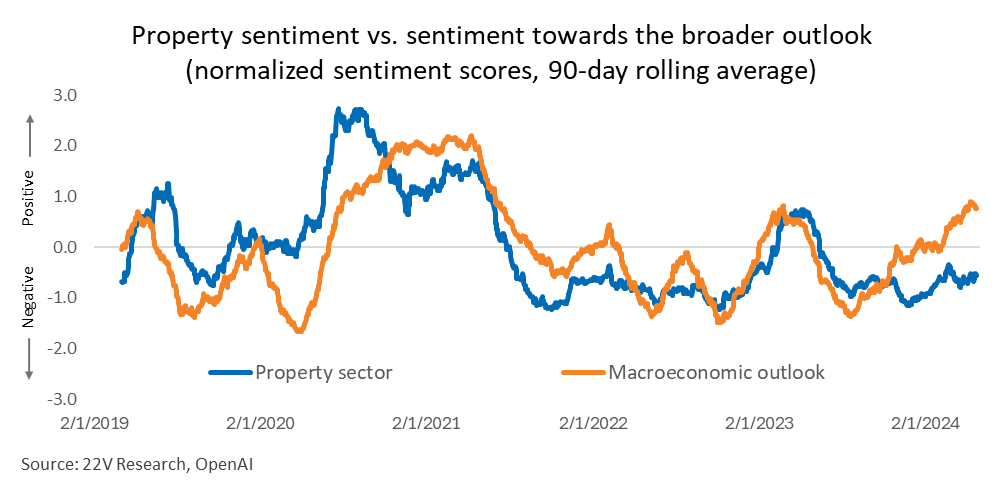
Our May 30 CHESS report (link again HERE) analyzed how recently announced government measures to support the property sector were impacting sentiment across categories. A key takeaway was the measures were boosting confidence in the equity market outlook and the exchange rate but showing a more modest effect on property sentiment itself – pointing to skepticism on the part of analysts as the practical impact of the shift in policies. We noted that this could set up a risk for markets down the road if the property rebound fails to meet those expectations.
Early signals from stimulus sentiment
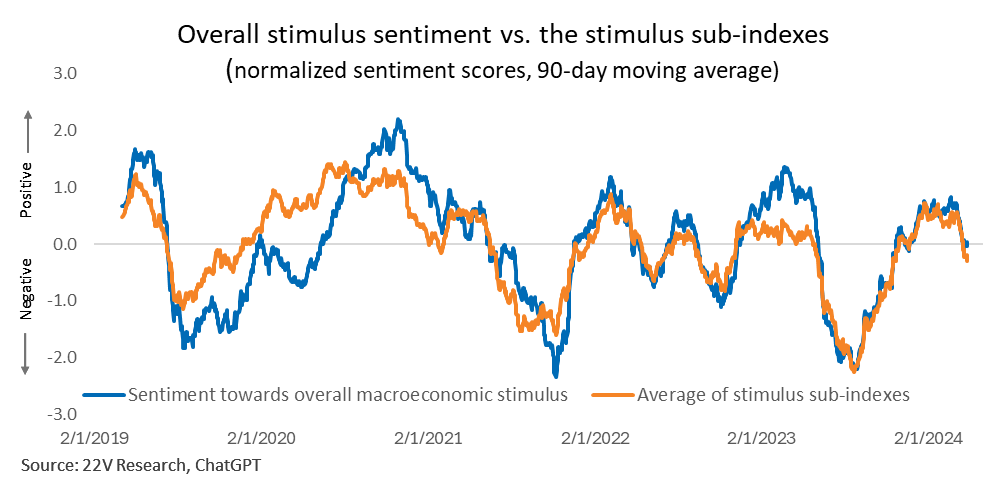
Five of the CHESS indexes focus on expectations towards China’s stimulus policies, a critical issue for investors but one that is otherwise hard to quantify. The macroeconomic stimulus sentiment index reflects analysts’ overall views as to whether stimulus is increasing/decreasing, while the other four indexes focus on specific policy areas: monetary policy, credit policy, fiscal policy, and infrastructure policy. The average of those specific sub-categories broadly tracks the overall macro stimulus index (chart below).
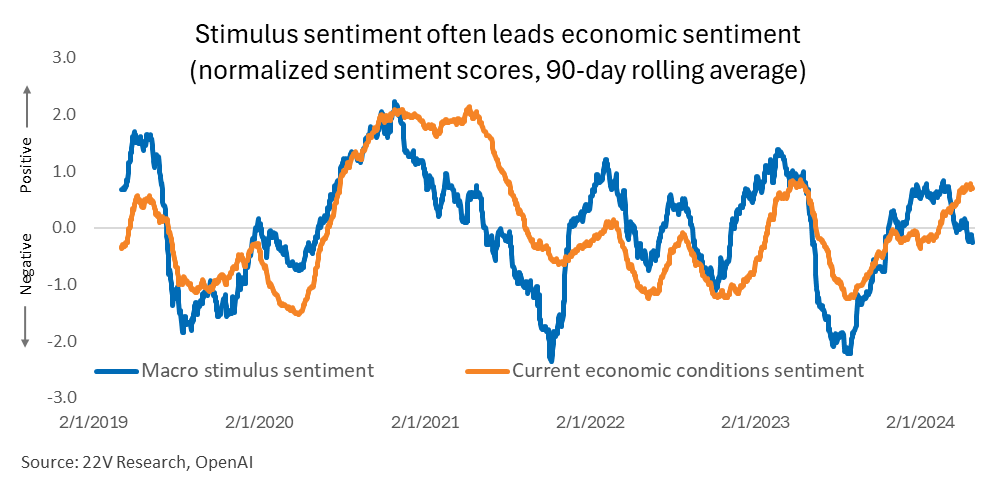
Because the stimulus sentiment indexes reflect expectations for coming policy, they tend to lead sentiment towards the economic outlook – and can thus provide early signals as to when the policy cycle is shifting in ways that will impact growth. The chart below shows macro stimulus sentiment (in blue) and sentiment towards current economic conditions (in orange). Swings in stimulus often come in advance of inflection points in sentiment towards current conditions. We observed in our two monthly updates that waning stimulus was a forward-looking risk for growth, especially if export momentum should fade.
Identifying market catalysts
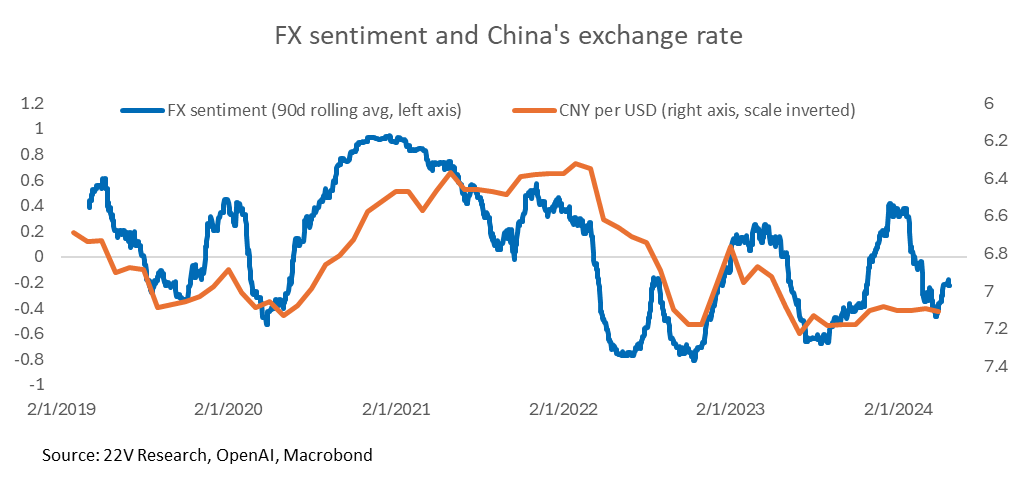
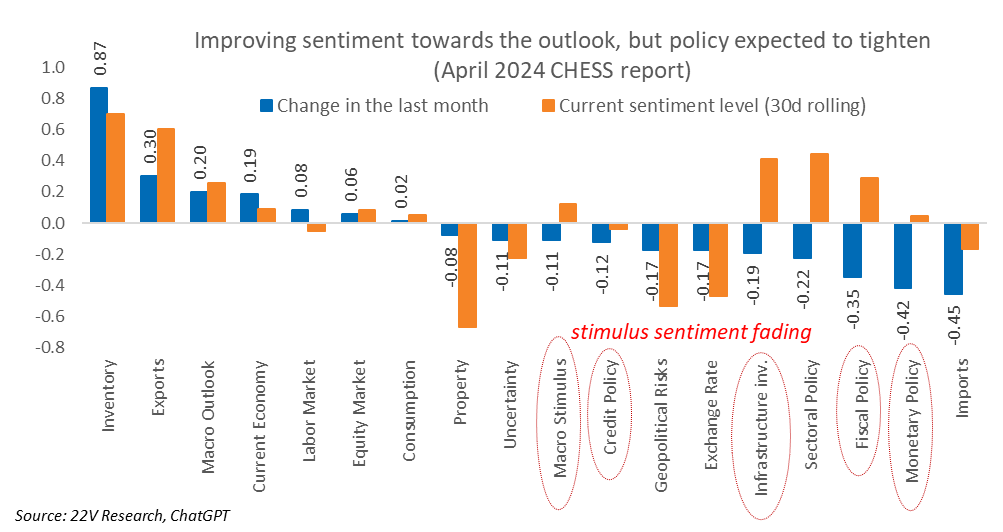
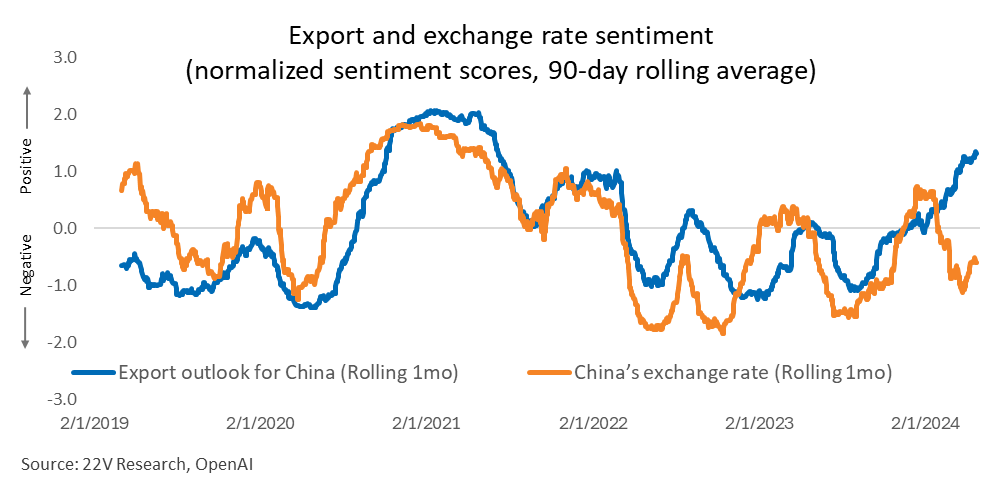
Looking across categories can be useful for understanding which drivers are most important for sentiment towards China’s equity markets or the exchange rate. Our April report noted that sentiment towards China’s exchange rate had diverged sharply from sentiment towards exports. This pointed to the pressure on China’s currency from US-China interest rate differentials, rather than trade-related issues, as the key factor weighing on expectations for the currency.
CONCLUSIONS AND NEXT STEPS
Given that CHESS is a new tool, and with the rapid developments of LLMs, we will continue to iterate the product and applications. We welcome feedback, questions, and requests for more details or data.
CHESS is a collaborative project, leveraging the expertise of Sophia Wang, 22V’s Director of Quantitative Research, and China-based economic consultant Dr. Fei Han. The author expresses thanks for contributions and insights.

