Dennis and the rest of the Portfolio Strategy team recently described the markets as “violently flat” and suggested that type of activity could continue thru year-end (here), After witnessing the trading in November, it is hard to argue with that assessment. All of the major indices saw a sharp decline for the first three weeks of November, only to see most of those losses erased as the market stormed back over the last 5 trading days of the month. Perhaps no group typified this action more than the small caps (IWM) as they declined by over 9% from their late October highs to their November lows, only to rally by nearly that same 9% over the last week of the month. When all was said and done, the small caps ended the month up ~ 1% and are essentially back at the same level they closed on October 28th (see violently flat).
Small Caps (IWM) declined by over 9% from their Oct highs to the November lows, and then recouped most of those losses in only 5 trading sessions to end the month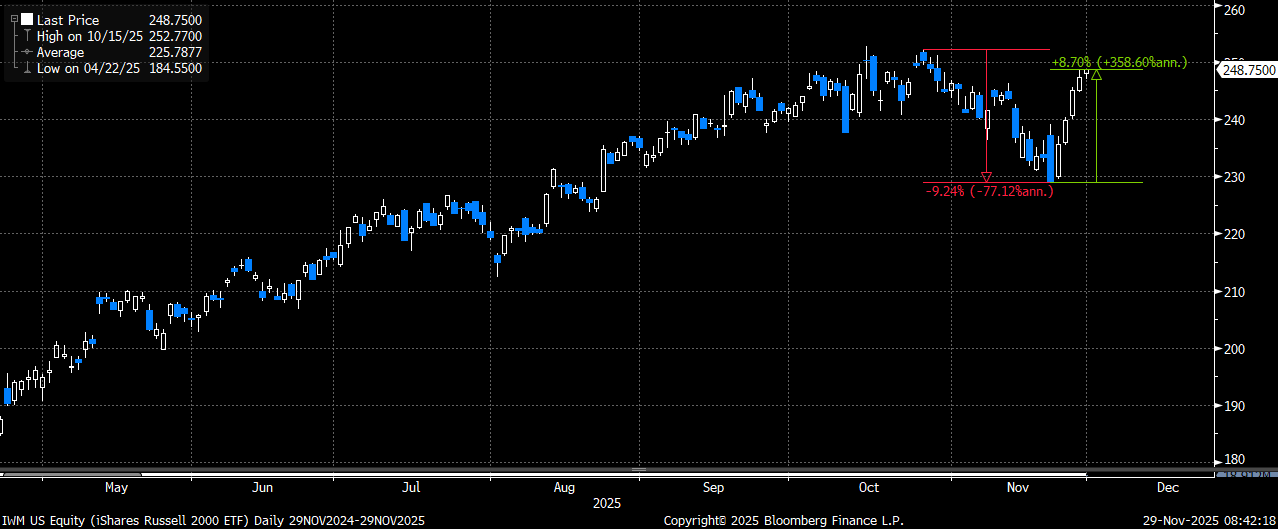
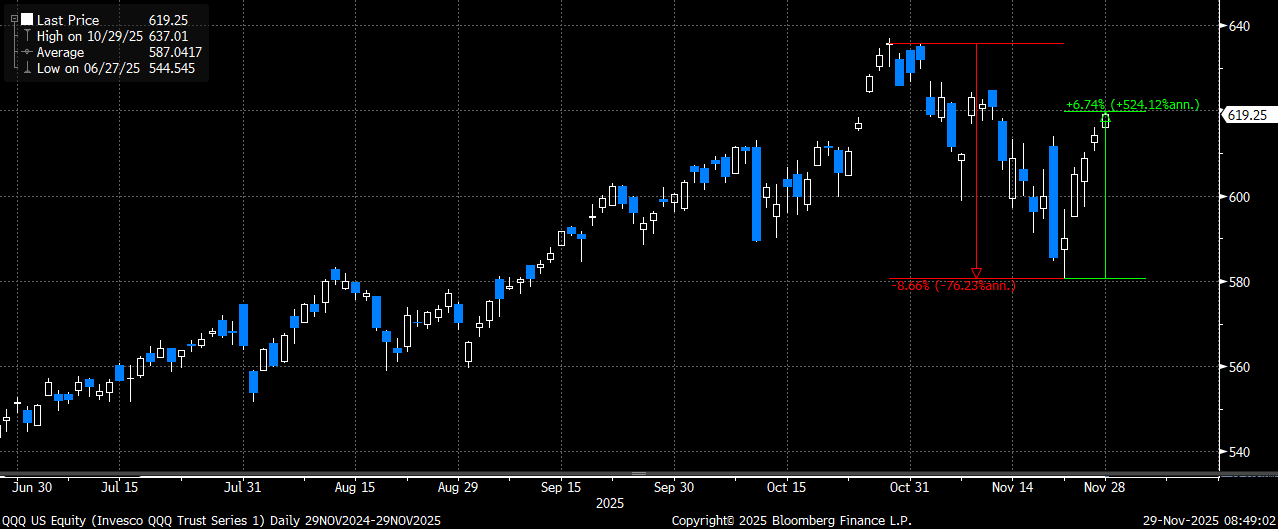
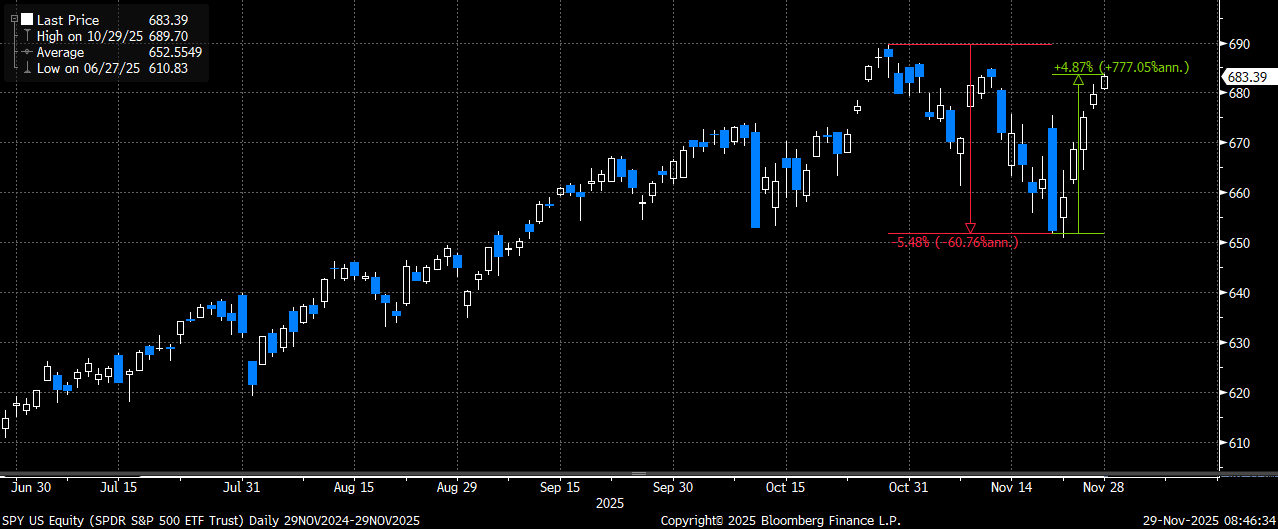
It wasn’t just the small caps that displayed this type of volatility. Both of the other major indices (SPY and QQQ) also had similar drops (and rebounds), but not as extreme as we saw in the small caps.
The tech-heavy Nasdaq (QQQ) also had a sharp pullback from the highs, but not as much of a rebound as the small caps did
The S&P (SPY) also saw a swift decline and subsequent rebound in November (but on a smaller scale)
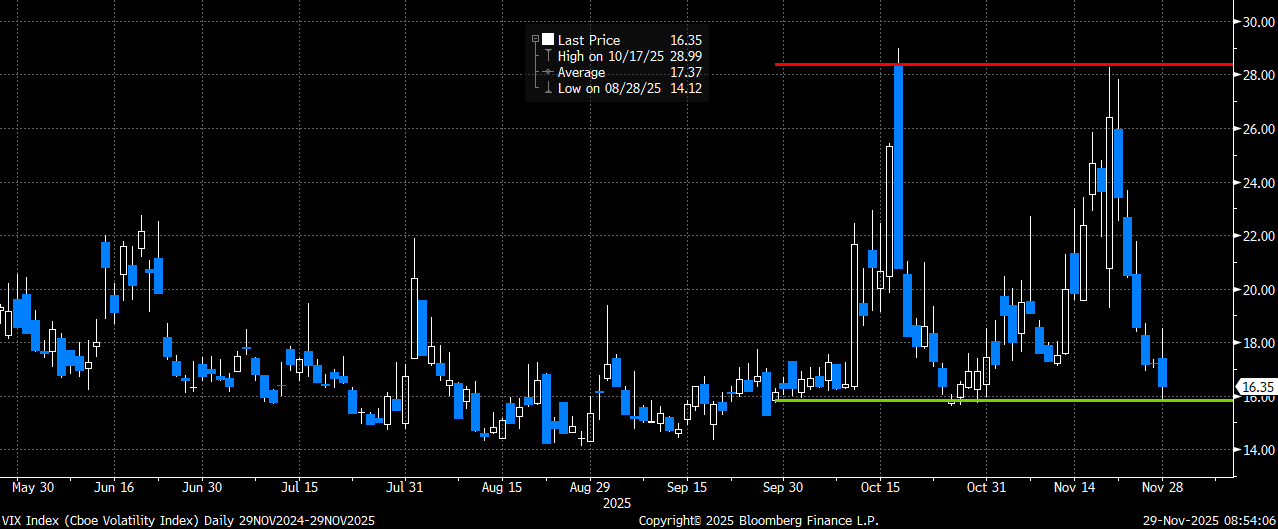
Not surprisingly, given this type of action, the main volatility gauge (VIX) also followed suit as it climbed from a low ~ 16 back to the October highs ~ 28, only to drop back to 16 in very short order:
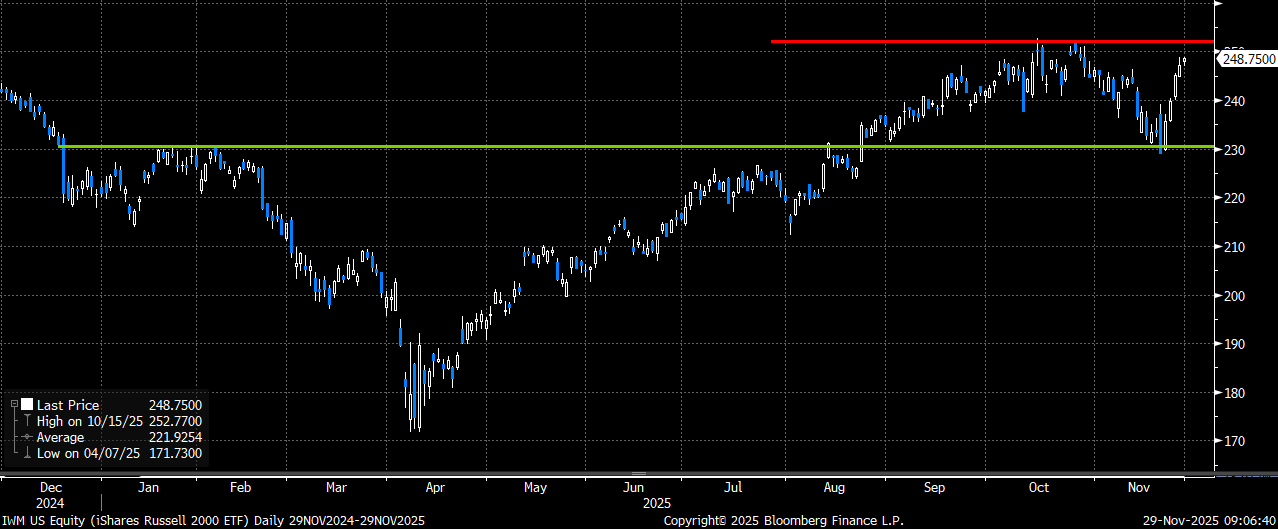
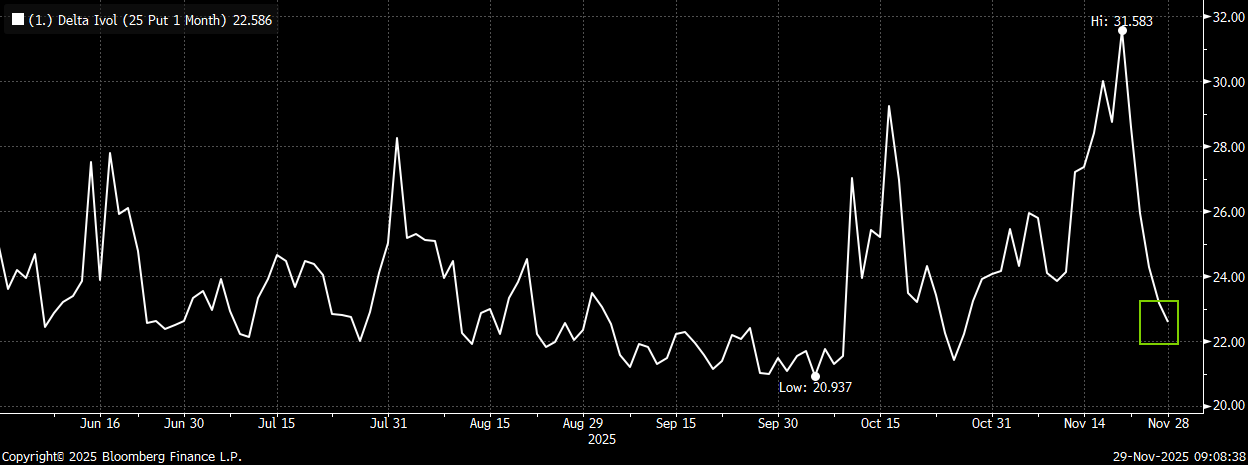
While trying to manage a portfolio/book becomes much more difficult when we see this type of action, owning vol (options) at key levels and monetizing them should we see a reversal move is a great way to minimize/offset some of this increased volatility. I believe the best strategy is to play the ranges in each index and when we get a fast move toward the support/resistance of each it makes perfect sense to position for a move back in the other direction. If we look again at the small caps (IWM), we can clearly see a “new” range has emerged with 230 being support and the 250-252 area being resistance. With the 8%+ rally in the last week, we are now only ~ 1-2% below the October highs (where IWM topped before declining by over 9%). Just as importantly, 1-month implied volatility on the 25-delta puts has also dropped sharply (thanks to the move lower in VIX). Amazingly, the 1-month puts now trade at a vol ~ 22.5 (down from a high of 31.5 and barely above the October lows). So we have had a sharp rally to potential resistance AND a massive decline in implied volatility as we approach the former highs. Therefore, the risk-reward of adding puts into this move has become very attractive in my option. Should we see the rally stall/fail again back near these former highs those puts should be a great way to offset some potential weakness in the market, and I would fully expect that implied volatility would once again move higher should we see a decline (even more reason to take a limited risk shot on the puts).
IWM in a well-defined range between 230 and 252 now. Makes perfect sense to consider adding puts as a tactical hedge/trade as we get near the highs again
IWM 1-month 25-delta put implied volatility is also back near the recent lows after spiking to 31.5 just over a week ago
Trade to consider:
Buy IWM Dec 19th 240 puts for $2.30 (IWM 248.75 ref)
Trade Details:
- Buying the 3-week 25-delta puts in IWM following the nearly 9% rally off the lows back to the top-end of the range
- Implied volatility has also moved back near the lows (another reason why owning puts outright makes sense)
- Dec 19th expiry still captures a lot of macro data – JOLTS, CPI, PPI, FOMC rate decision & BOJ rate decision
- Markets continue to trade very choppy and have turned on a dime (both higher and lower) several times in the past few months
- Limited-risk way to potentially hedge yet another move lower after an extremely sharp rally back near the former highs
- Can consider similar trades in QQQ and SPY should they move closer to their former highs
- Please contact me or the 22V sales team for updated pricing and execution
Trades for potentially higher rates over the next month or two
In their Friday note, Dennis and the Portfolio Strategy team suggested that 10-year yields could have risk of a move back to 4.3% to 4.5% over the next month or so (here). Should that call play out, I wanted to highlight two trades I believe would work very well using options.
Trade #1 – TLT Jan 16th put spreads
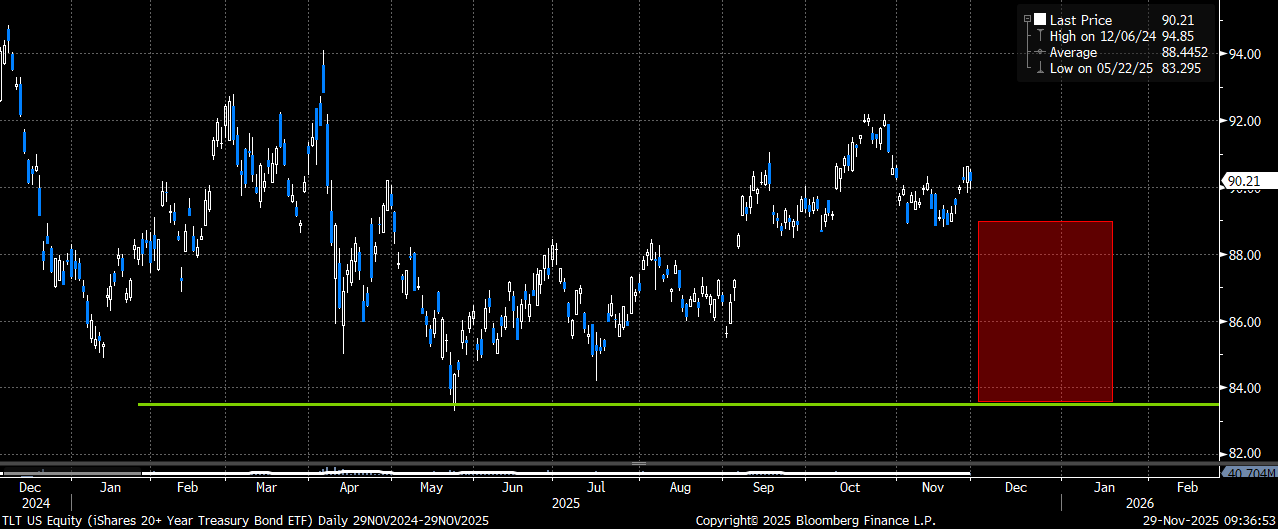
Buy TLT Jan 16th 89/84 put spread for $0.95 (TLT 90.21 Fri close ref)
Trade Details:
- Buying the Jan 5-point put spread following rally in bonds and with 10-year yields having moved back down to the 4% lows yet again
- Put spread starts less than 1% lower (after factoring in the expected next two dividends in December)
- Put spread is also capped to the downside at/near the May/July lows ~ 84. This also roughly would translate to ~ 4.5% yield on the 10-year (the high-end of the range the Portfolio Strategy team mentioned in their note)
- Put spread offers a 4.25x to 1 max payout on the limited-risk structure
- Jan expiration will capture a ton of economic data in both Dec and Jan after months of no data
- Please contact me or the 22V sales team for updated pricing and execution
10-year yields back near the recent lows ~ 4%. The Portfolio Strategy team believes there is risk of a move back to 4.3%-4.5% over the next month or two
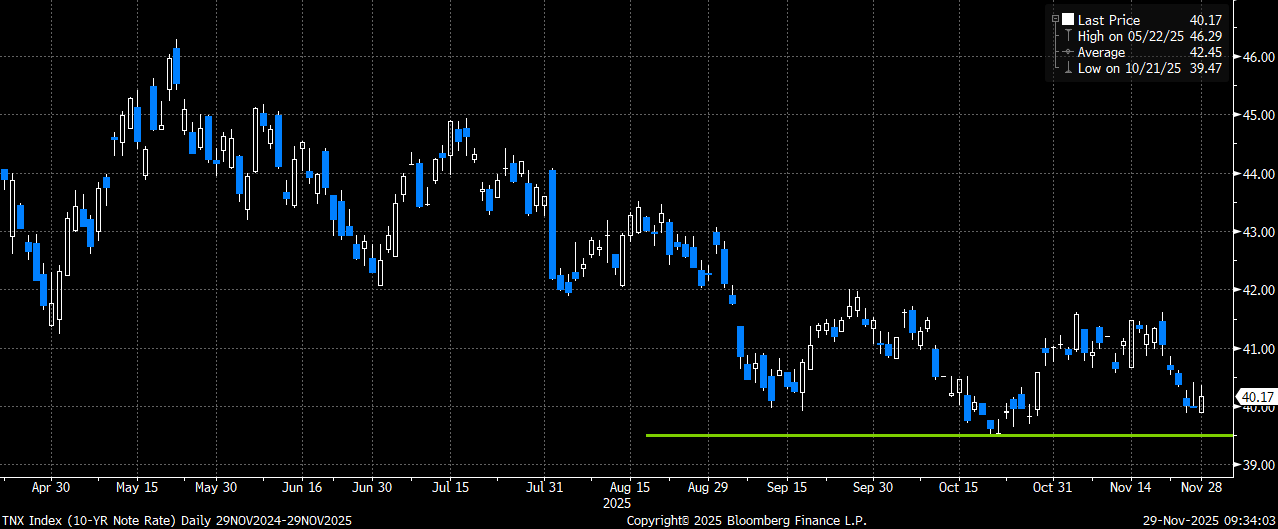
The 89-84 put spread range would come into play should we see a move back higher in 10-year yields to 4.3% and above
Trade #2 – XLP Jan 16th ratio put spreads
Buy XLP Jan 16th 78 put 1x
Sell XLP Jan 16th 73 put 2x
Costs ~ $0.53 (XLP 79.37 Fri close price ref)
Trade Details:
- Trade starts about 1% below spot (after the expected .62 div on 12/22)
- Structure captures 7 points of vol skew between the 78 puts we are buying vs the 73 puts we are overselling
- Trade is short delta, long gamma and positive theta to start
- Trade has a better than 8x to 1 max payoff
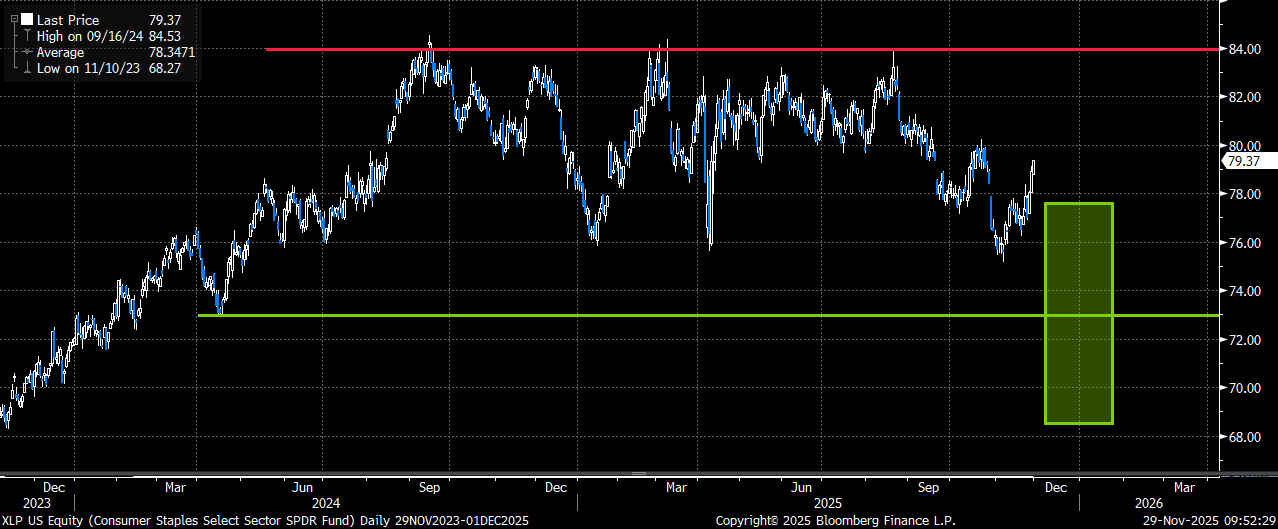
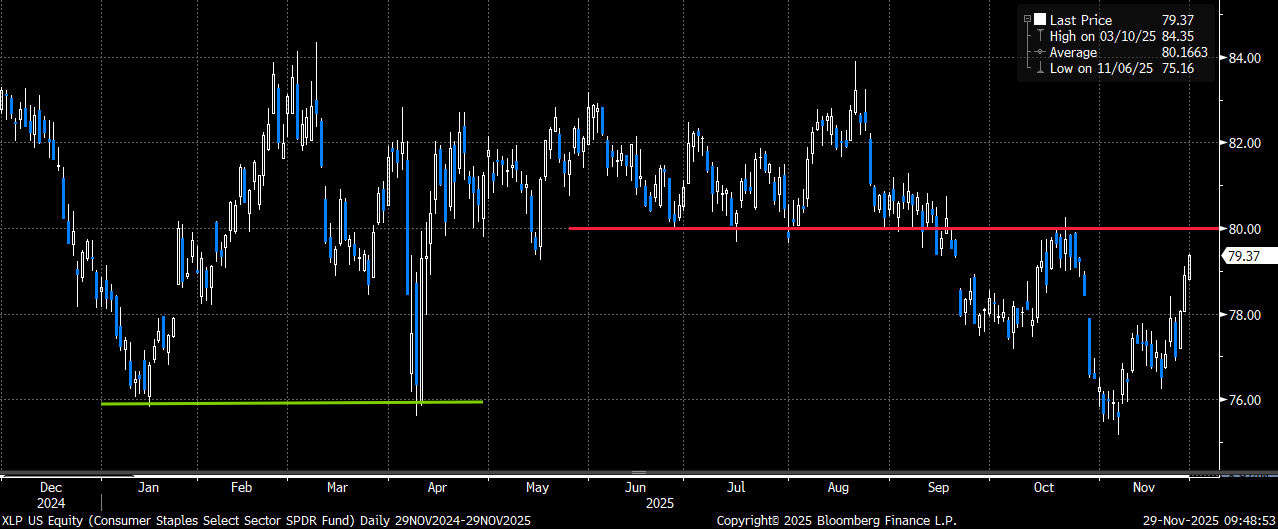
- The 73 put is also the 2024 April lows (why I like selling that “expensive” strike 2x)
- Trade makes $$ between 77.47 and 68.53 by Jan expiry (-1.5% to -12.8%) after factoring in the next expected dividend
- XLP declined from 80.5 to < 78 in Sept when yields moved higher and then from 80 to < 76 as yields moved higher again between late Oct and early Nov. Staples tend to trade inversely to yields.
- Please contact me or the 22V sales team for updated pricing and execution
Staples (XLP) have also rallied with the market. They are now just below recent resistance ~ 80 after dropping below the Jan/April lows in early November
The GREEN area shows where trade makes $$ at Jan 16th expiry. The max P&L is at 73, which was also the April 2024 low