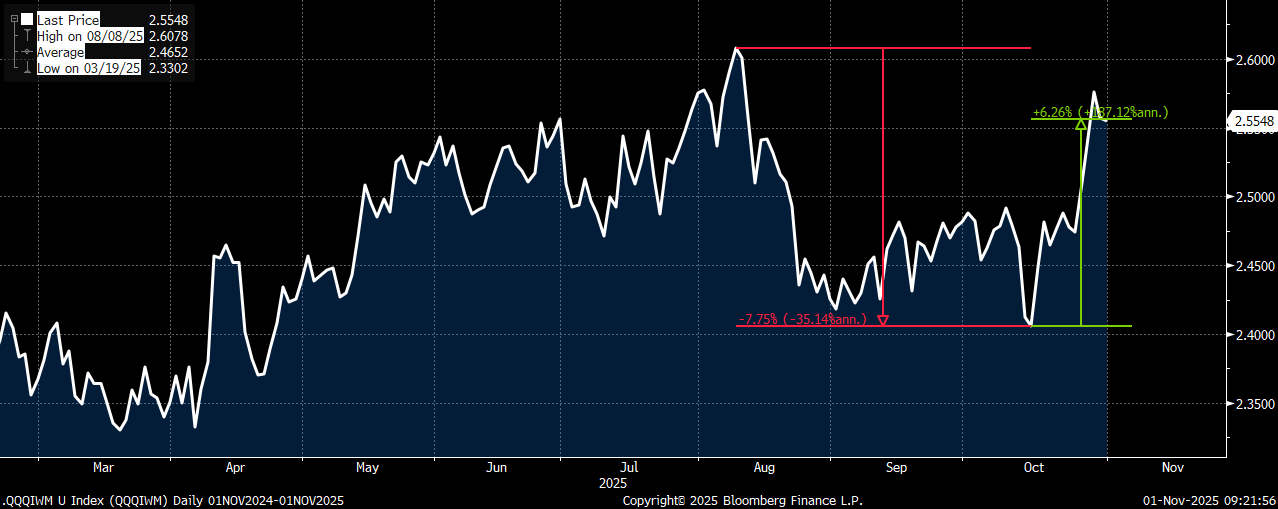
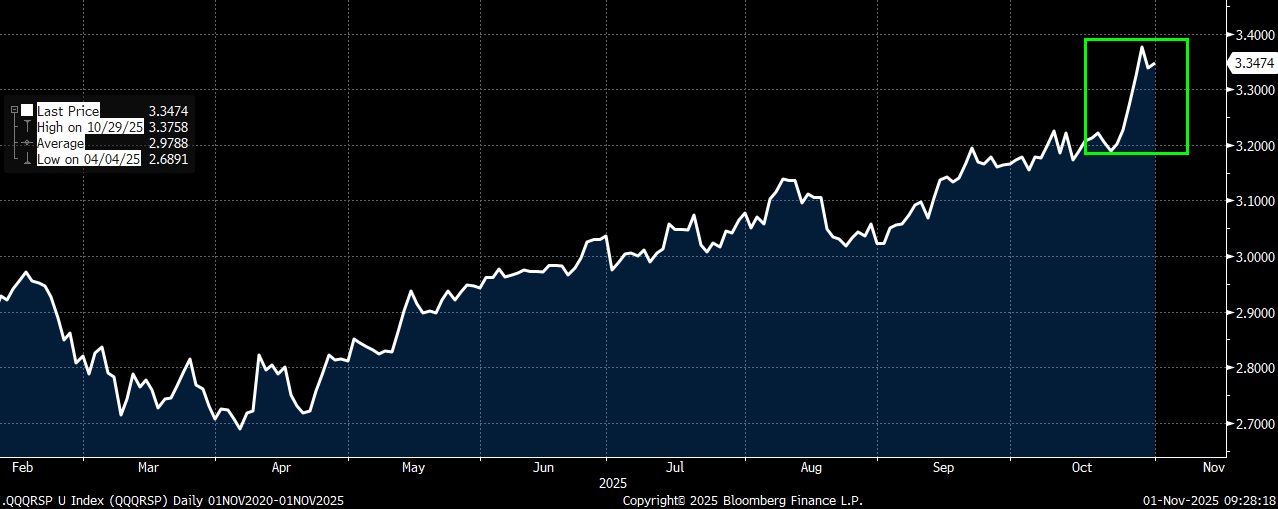
October ended another strong month for the major equity indices with tech (QQQ), SPY and small caps (IWM) up 4.78%, 2.38% and 1.76% respectively. What is of note, however, is the relative performance of the small caps to tech (IWM/QQQ) over the course of the month. After outperforming the main tech etf by more than 3% for the first half of October, we saw IWM underperform QQQ by a massive 6% over the past 2+ weeks. While part of this sharp underperformance could be attributed to some of the large earnings spikes we saw this past week from names such as Amazon (AMZN) and Alphabet (GOOGL), I also believe we are starting to see real weakness/selling in some of the non-tech/AI areas of the market. In fact, since closing at a record high on 10/15, IWM is now down 1.64%, while QQQ has risen by nearly 4.5%. Clearly, tech has regained a leadership position once again in the market. Not only are we seeing tech “pull away” from the small caps, but the spread between QQQ and equal-weighted S&P (RSP) also moved up by a massive 5% just since 10/22 and is now up nearly 25% from the April lows. I believe this outperformance to the “average” stock not only speaks to the narrowness of the advance (in predominantly tech names) but perhaps continues to hint at weakness in other areas of the market?
QQQ/IWM relative spread declined by ~ 8% in 2 months, and in 2 weeks we have seen most of the underperformance reversed
QQQ/RSP (Equal-Weight) spread also with a huge move higher to end October as large-cap tech momentum continues
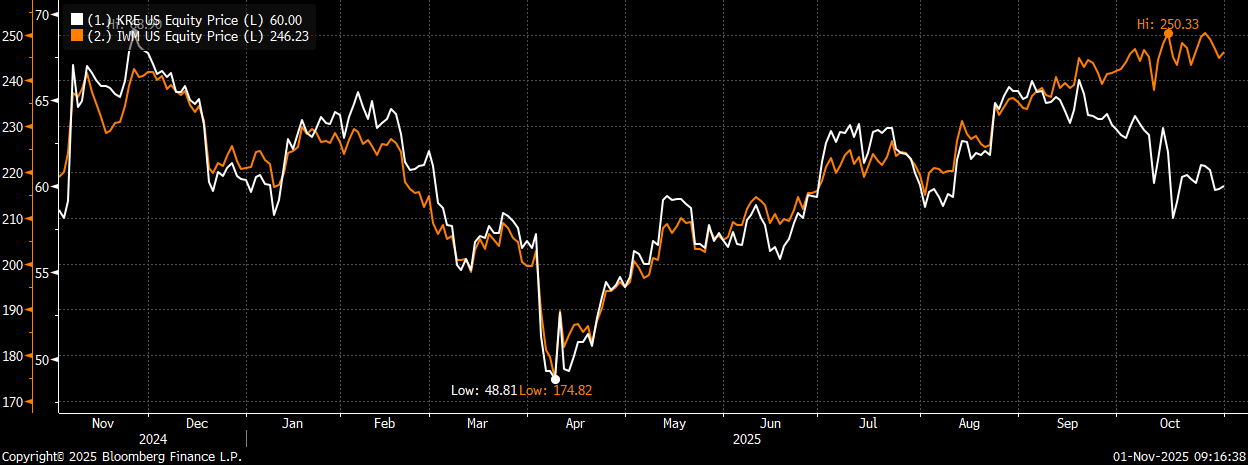
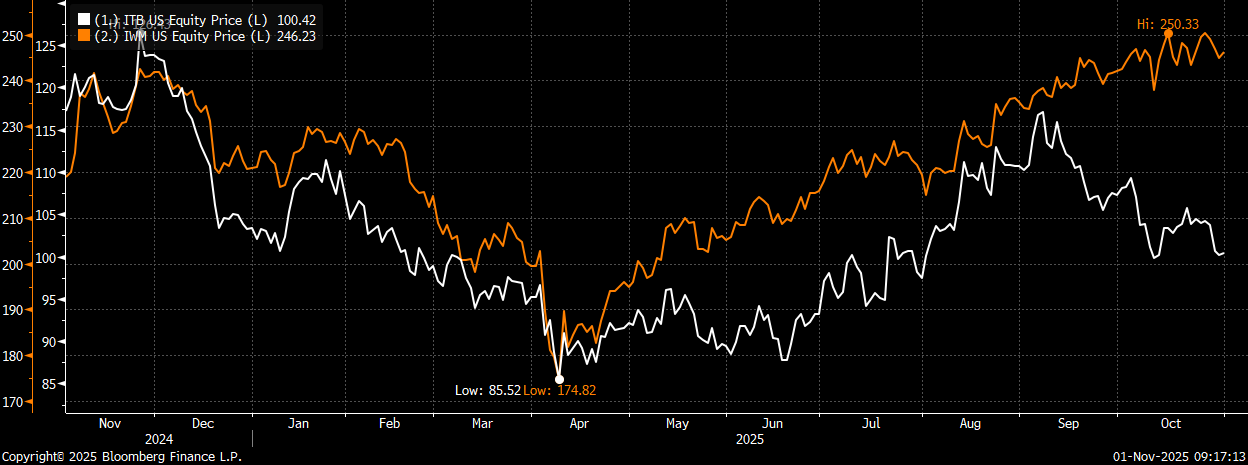
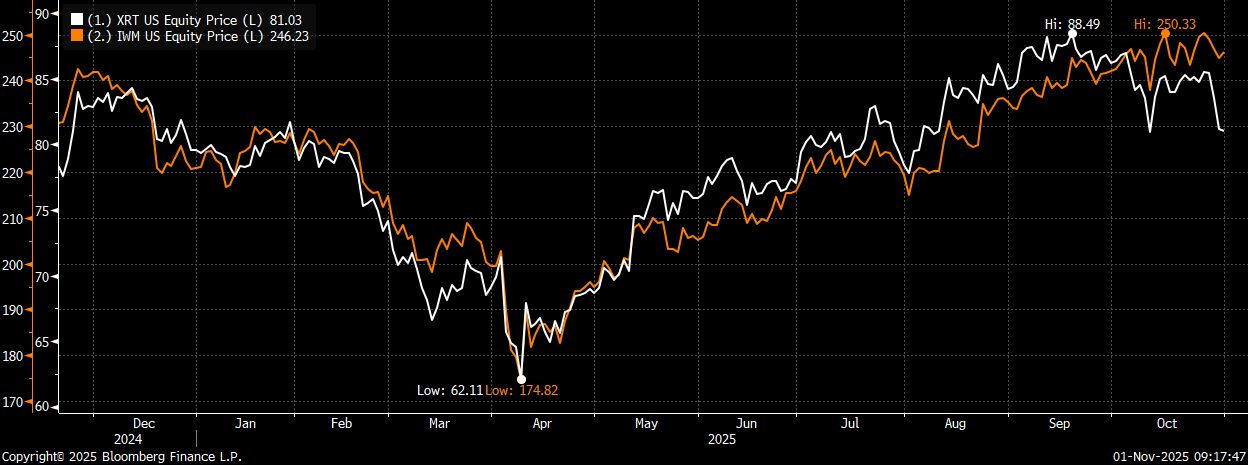
When I noticed that small caps had stopped outperforming tech in mid-October, after an 8%+ outperformance from the August lows to the October highs, I had suggested using IWM hedges as my preferred market hedge (here). The action the past two weeks, even though IWM is still up small, has reaffirmed my belief that small caps should be most at risk should we actually see a risk-off trade take hold. Not only has IWM been led higher by unprofitable tech, as the 22V Portfolio Strategy team has pointed out, but now I am seeing multiple sectors of the market that all are traditionally more correlated to small caps (housing, regional banks and retailers) all starting to really dislocate from both the SPX as well as IWM. Should we “lose” the bid in unprofitable (riskier) tech names, I believe IWM is at risk of a decent decline (and likely large underperformance to both QQQ and SPY). Lastly, on Wednesday when Chair Powell hinted that a December rate cut may not be a given (rate cut probabilities moved from over 92% to a current 68%) we saw IWM end the day down 85bps while QQQ was UP 45 bps. Further speculation that a December cut may be off the table should also work against the small caps given their rate sensitivity.
Regional banks (KRE) have been diverging from IWM since September
Homebuilders (ITB) are also exhibiting sharp underperformance to IWM since September
Now retailers (XRT) are starting to dislocate lower as well from IWM
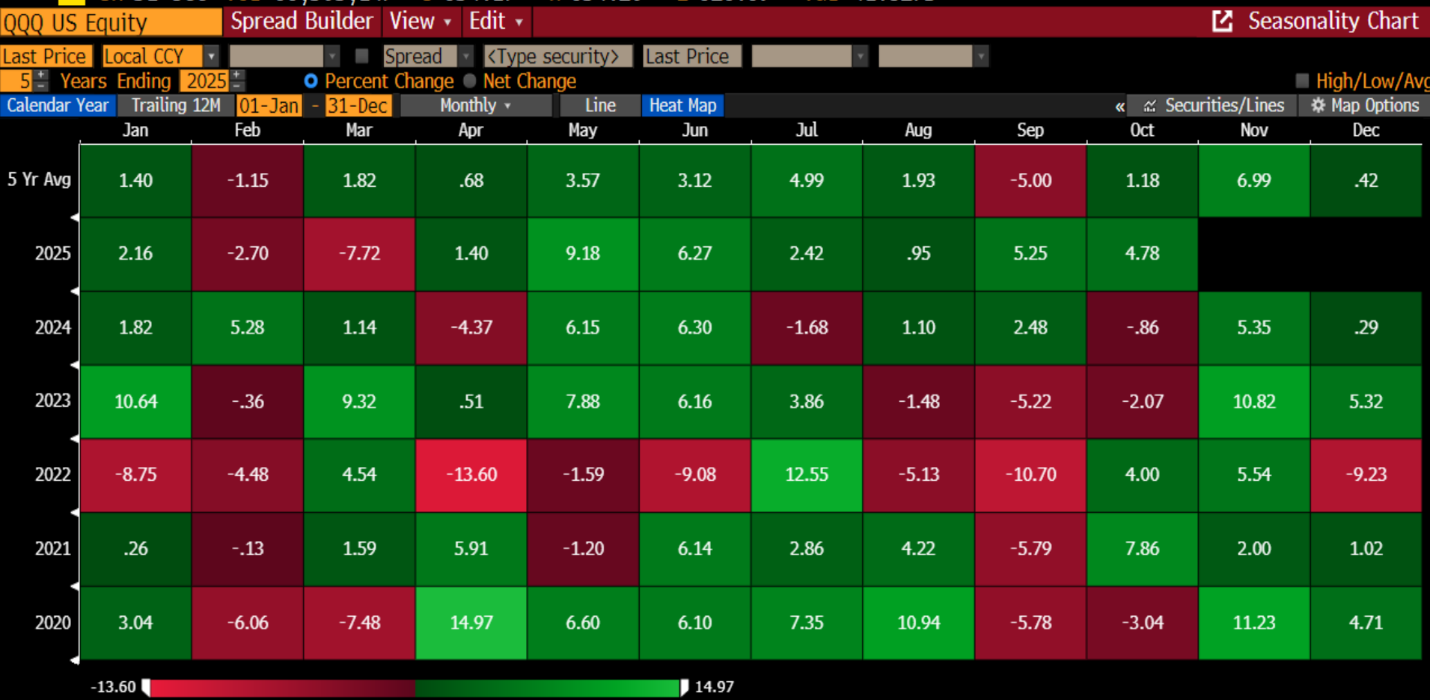
Against this backdrop, we enter November with SPY and QQQ essentially at their all-time highs WITH tech now outperforming. In addition, November has been, by far, the best month for equity returns of the past five years. The Nasdaq has averaged a 7% gain in November over the last five years, with gains each year. The SPX (SPY) has averaged a 6.15% gain in November over the last five years, with only one negative return (-0.80% in 2021). With momentum (and history) on the markets side as we head into November, it’s hard to fight the tape. With that being said, I do believe staying long (specifically the tech-led areas of the market), while continuing to hedge with IWM put spreads, is an attractive way to play the market here likely thru year-end.
November has been the best month by far for markets over the past five years
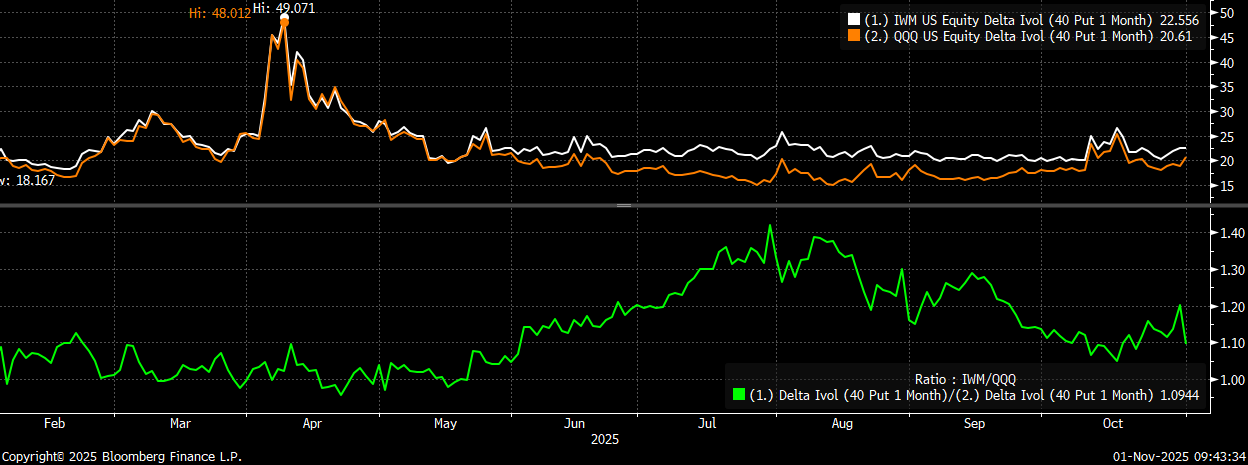
Making this setup even more compelling is that IWM put vol remains on the “cheaper’ side to QQQ put vol. My base case remains that IF we do see a risk-off trade that I would expect to see the relative underperformance we have seen from the small caps over the last two weeks start to pick up more steam to the downside. Again, we are already seeing weakness in several areas of the market that are more levered to the consumer/small caps. On a risk-off trade I fully expect the unprofitable/riskier areas of the market to underperform the cash-rich large-cap tech names that just reported and for the most part have jumped higher (AMZN, AAPL and GOOGL for example). In fact, I think we could even see these names become “defensive” longs on a risk-off event, which should also buffer some of the selling pressure.
One-month IWM 40-delta puts continue to trade “cheap” to same duration/delta QQQ puts (bottom chart)
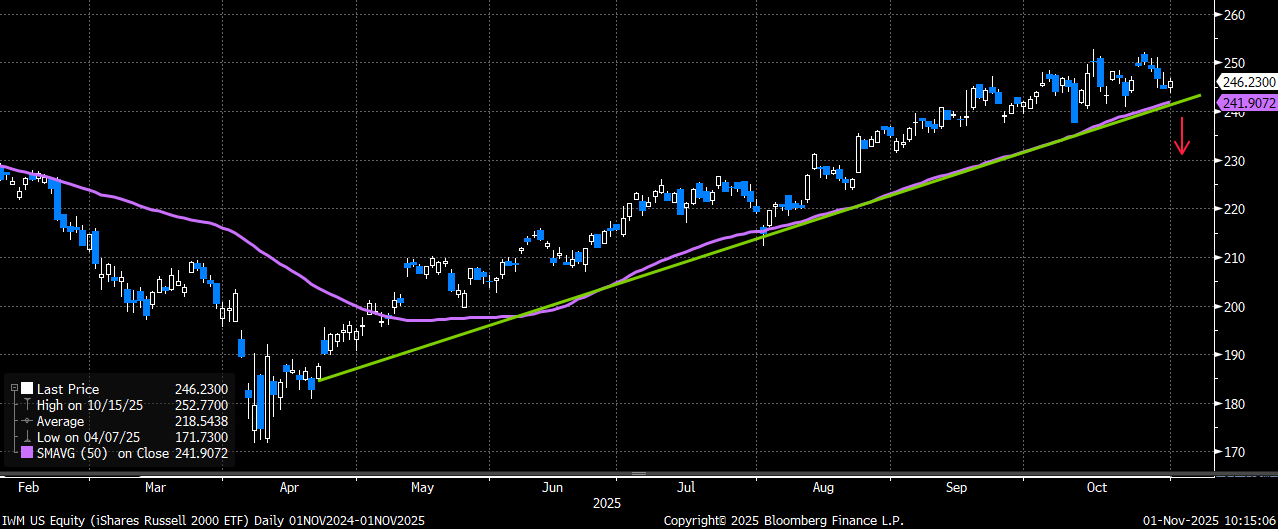
As far as IWM and what hedges I like, I think if buying put spreads you need to target a true break of the April uptrend support. This support also happens to correspond to the rising 50-day moving average (which is currently ~ 242 or about 2% lower). That being said, I want to own put spreads that start just below that support level and target a pullback to the 200-day moving average (currently ~ 219). Here are two hedge trades I would consider now that I favor against a long (mostly tech) portfolio:
Trade #1 – Shorter-term November hedge
Buy IWM Nov 21st 241 puts
Sell IWM Nov 21st 225 puts
Costs $2.50 (IWM 246.23 Fri close ref)
Trade Details:
- Buying the Nov regular put spread that starts 2% below spot and targeting a potential break below the longer-term uptrend support and the 50-day moving average
- Spending 1% of the underlying IWM etf to hedge against a possible 8.6% decline over the next three weeks
- Put spread has a 5.4x to 1 max payoff at expiry
- IWM has already turned lower vs QQQ and SPY even as markets continue to rally
- Please contact me or the 22V sales team for updated pricing and execution capabilities
Trade #2- Longer-term December hedge
Buy IWM Dec 19th 238 puts
Sell IWM Dec 19th 215 puts
Costs ~ $3.75 (IWM 246.23 Fri close ref)
Trade Details:
- Buying the December regular put spread that starts just over 3% below spot and below the longer-term uptrend support and the 50-day moving average
- Spending ~ 1.5% of the underlying etf to hedge against a possible 12.7% decline before year-end
- Put spread has a better than 5.1x to 1 max payoff at expiry and is capped to the downside just below the 200-day moving average
- IWM has already turned lower vs QQQ and SPY even as markets continue to rally
- Please contact me or the 22V sales team for updated pricing and execution capabilities
IWM chart – targeting a potential break below the April uptrend support as well as the rising 50-day moving average