

Back on September 1st I suggested that volatility (VIX) had reached peak complacency (here), and recommended owning VIX call spreads out to October 22nd as my preferred macro portfolio hedge. Since then, VIX has moved up by more than 35% (was up 70% as of Friday morning) and that is WITH the NDX having rallied 6%, and both the SPX and RTY each up over 3% over that time. While I do believe we can continue to see volatility move higher for a myriad of reasons, it gets harder to monetize VIX hedges when starting at a level ~ 21 (vs 15 when I suggested owning in early September). Considering that we have also seen VIX move higher, even as the three major indices have all still rallied, I believe index (ETF) hedges now look more attractive as a market hedge and want to own them here over VIX call spreads.
VIX nearly doubled from the Sept 1st lows (when I suggested owning) to the highs hit on Friday morning

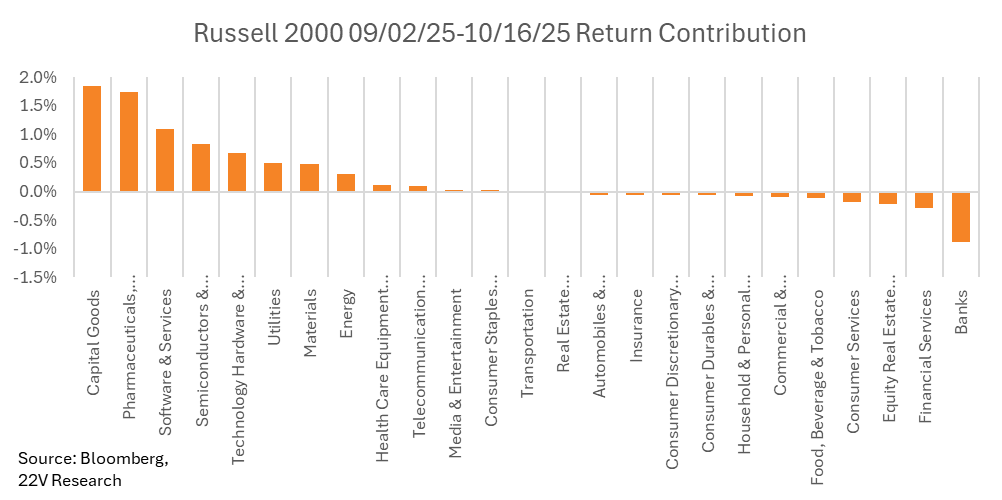
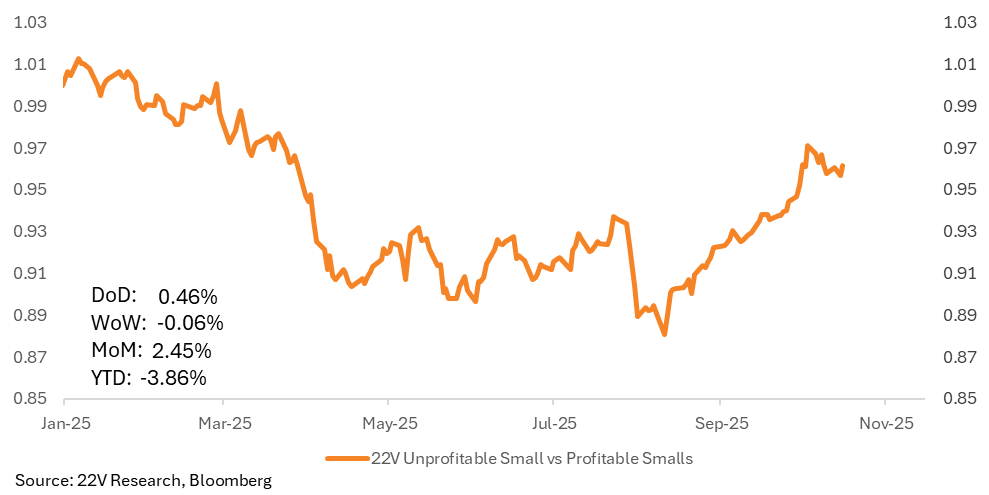
The question now is which hedge looks most attractive? Looking at small caps (IWM), large caps (SPY) and tech (QQQ), I believe IWM hedges look most compelling currently for several reasons. First, we saw a significant period of outperformance by IWM to both SPY and QQQ between the start of August and mid-October (+8% vs both). Second, we are starting to see some “cracks” in the credit story in both regional banks (KRE) as well as private credit. IWM has traditionally had a higher correlation to these groups (especially the regional banks), and if those concerns continue to mount, I believe IWM could play catch-up to that sector given the historical relationship. Lastly, I asked our portfolio strategy team to investigate which sectors have been behind the bulk of the outperformance we have seen by the small caps as of late, especially given the sharp relative weakness we have seen from the smaller regional banks. The Portfolio Strategy team ran a decomp of small cap returns since the beginning of September and concluded that returns have been dominated by Cap Goods, Health Care, Software, Tech, and Utilities. Simultaneously, it appears that unprofitable small caps have been substantially outperforming profitable small caps as well. They believe this is the AI trade moving into the more speculative (unprofitable) part of the AI food chain. Therefore, should we see any weakness in the riskier parts of the tech/AI trade, it would stand to reason that IWM could come under even more pressure than QQQ (especially after outperforming by a wide margin of late), and coupled with what we are seeing in the credit/regional bank story. I also suggested selling Jan QQQ puts to buy Jan IWM puts yesterday (here) as a way to play this theme.
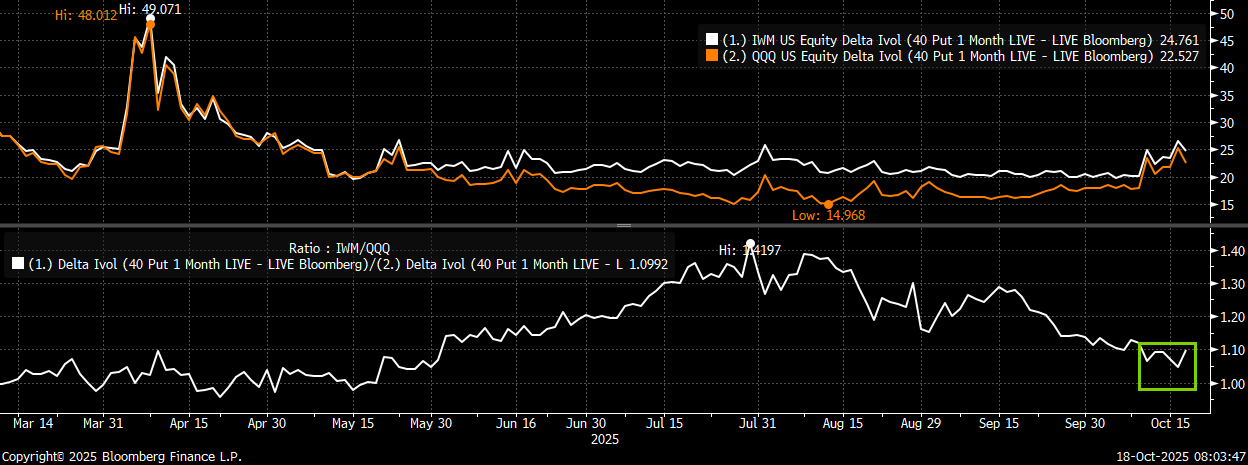
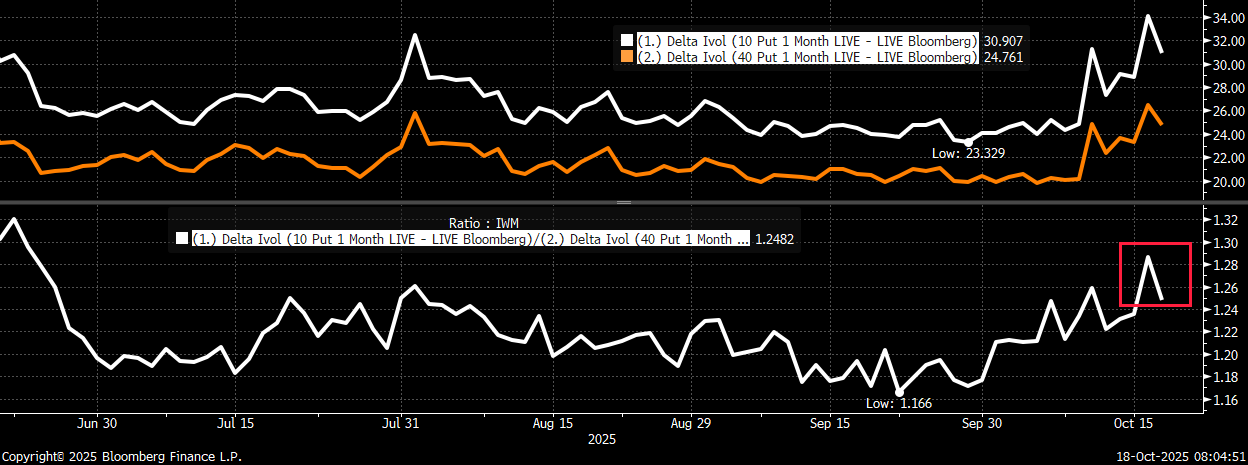
What I also especially like about owning IWM puts/put spreads here over both QQQ and SPY is that IWM puts have recently gotten much cheaper to both on a relative basis. Looking at the 1-month (Nov) 40-delta put skew between IWM and QQQ, we can see that IWM puts currently trade at only a 10% vol premium to the same delta/duration QQQ puts. They had been trading at a 40% premium in late July, and the 10% premium now just above the smallest skew since April. In addition, IWM 10-delta/40-delta put skew has moved up sharply since mid-September as well (making a November put spread an attractive proposition and a way to offset the recent bump in overall volatility).
IWM 1-month (Nov) 40-delta puts now trading “cheap” to QQQ 1-month 40-delta puts (bottom chart)
IWM 1-month 10-delta/40-delta put skew has also moved up sharply since mid-September (makes owning put spreads more appealing)
Trade:
Buy IWM Nov 21st 238 puts
Sell IWM Nov 21st 215 puts
Costs ~ $3.80 (IWM 243.40 Fri close ref)
Trade Details:
- Buying the IWM November put spread as a macro portfolio/market hedge
- IWM has outpaced both QQQ and SPY since August and with could see a period of underperformance if the credit/regional bank issues widen and/or we see the riskier tech/AI names start to move back lower
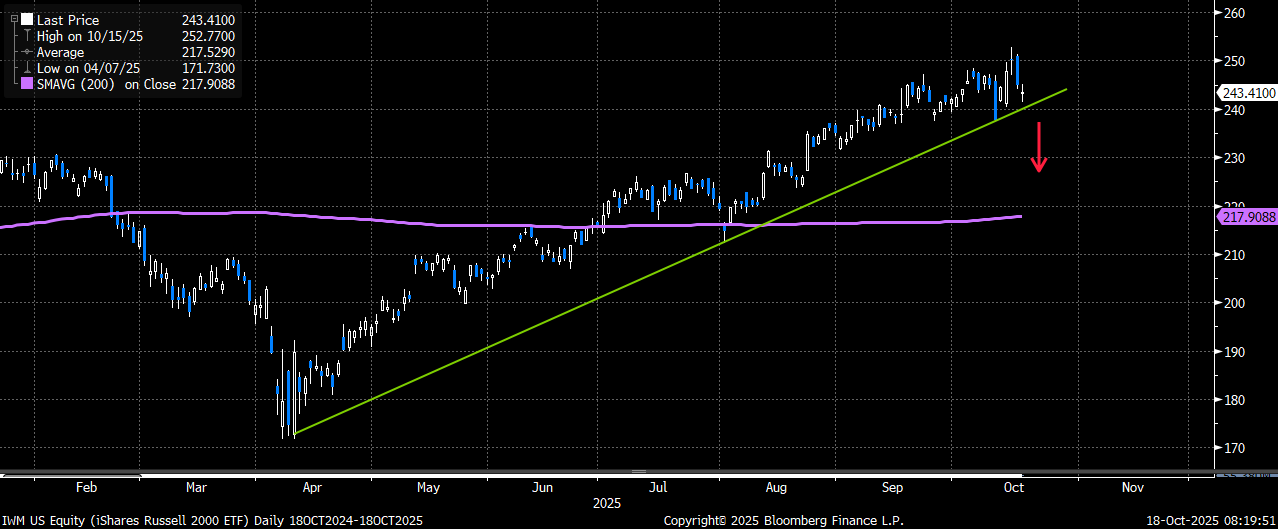
- Put spread starts just over 2% below spot and is capped to the downside just below the current 200-day moving average
- Trade offers a better than 5x to 1 max return at expiration on the limited-risk structure
- Please contact me or the 22V sales team for updated pricing and execution capabilities
Put spread hedge is also targeting a potential break below the April uptrend support
Buy XOP December put spreads to hedge crude weakness thru year-end
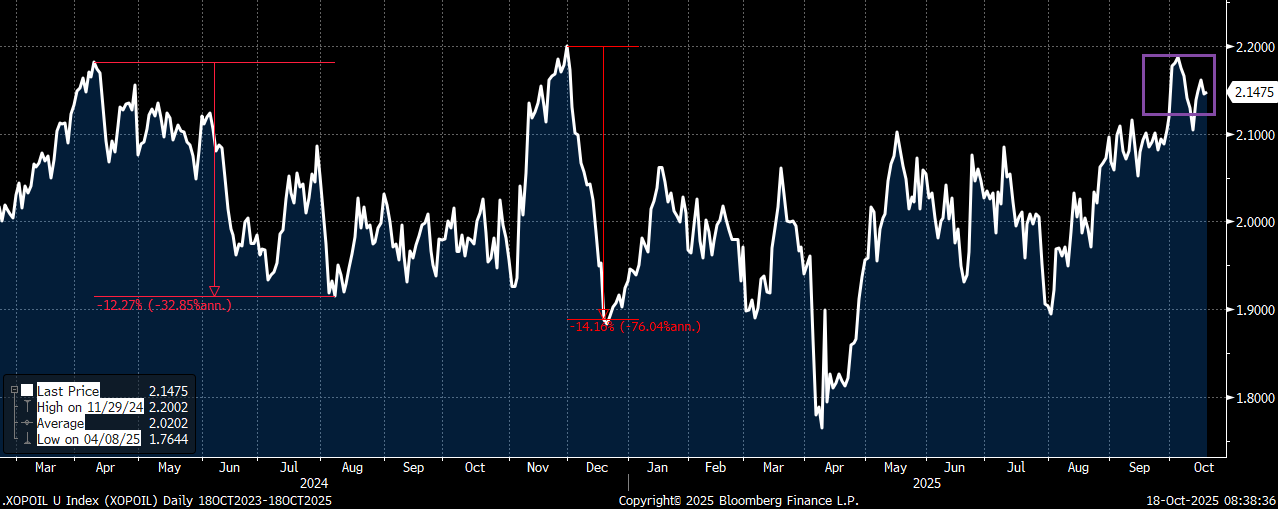
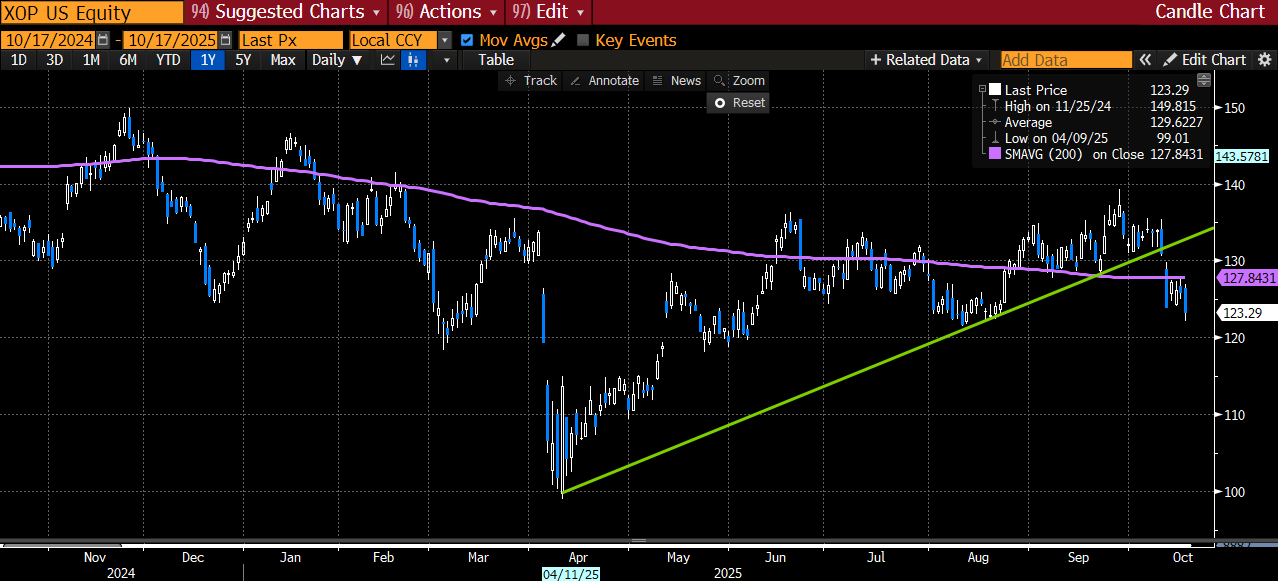
Crude oil continues to trade very poorly, as it hit a 5-month low yesterday. This is something that 22V commodity analyst, Colin Fenton, has been warnings about since late August (here). What stands out to me given the 22% decline in oil from the June highs is how well the energy names (XOP) have held up. XOP is down less than 10% during the time that crude has plunged my more than 20%. This dynamic has moved the XOP/oil relative spread back to the 18-month highs. The last two times we saw the spread at these levels (April ’24 and Nov ’24) we saw XOP sharply underperform oil going forward (see below). In addition, the XOP technical picture is also not pretty. It gapped below both the 200-day and April uptrend last week on the China headlines (is still below) and has also broken below the April uptrend support level.
XOP/Oil relative spread back at the highs. We have seen XOP sharply underperform oil once this level has been reached previously
Ugly technical picture for XOP. Gap below both the April uptrend AND the 200-day on the China headlines last week
I believe that should we see either continued weakness in crude (move to $50 ahead of the Saudi state visit in Nov?) and/or just a risk-off trade in equities, that XOP could quickly play “catch-up” to where it has historically traded to crude. Therefore, for investors that either have large exposure to the energy names or who want to position for a move lower on a limited-risk basis, I really like the setup here to own XOP Dec put spreads:
Trade:
Buy XOP Dec 120 puts
Sell XOP Dec 100 puts
Costs ~ $4.00 (XOP 123.57 Fri close ref)
- Starts less than 3% below spot
- Has a 4x to 1 max payout at expiry
- Put spread is capped to the downside AT the April lows of $100
- Dec expiry captures both earnings AND the MBS White House visit in November
- Please contact me or the 22V sales team for updated pricing and execution capabilities

