

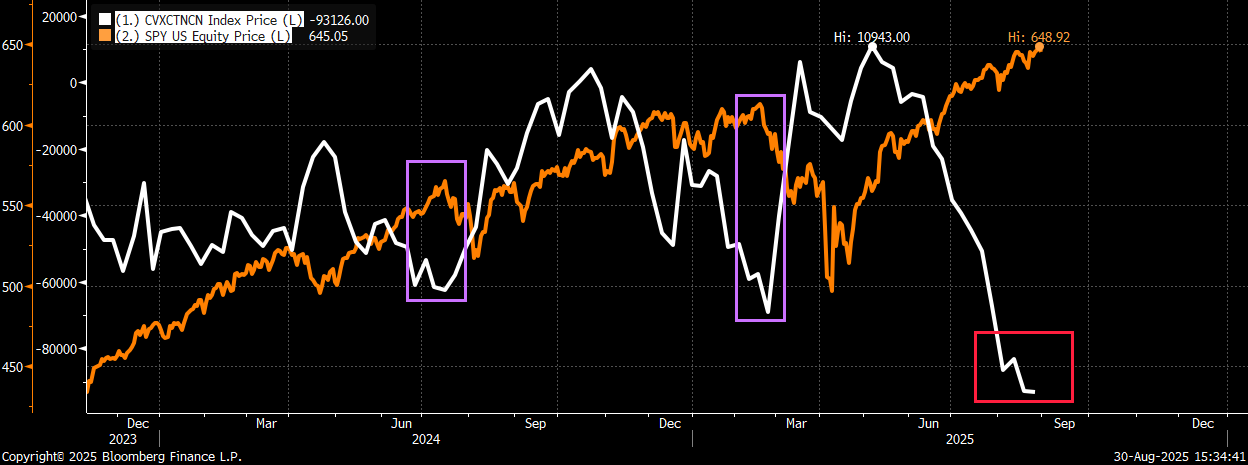
The main volatility index (VIX) made a new yearly low on Thursday before bouncing on Friday as the main indices declined. While VIX continues to trade just above the YTD support lows ~ 14, what has caught my eye recently is the large net short position in VIX futures. As of 8/19 the net short position in VIX futures hit ~ 93k (the largest net short position in three years), and this past week that number moved up slightly (as of 8/26). The fact that investors are still betting heavily on new lows in vol, even with VIX at what appears to be a “floor”, and with markets up sharply from their April lows to all-time highs, should be viewed with caution. In fact, the last two times the net short position was greater than 60k (July ’24 and Feb ’25) preceded the last two significant declines for the SPX (-9.6% and -21.4%). Net short positioning in VIX futures is now ~ 50% greater than either of those times and likely speaks to the current complacency in the market, in my opinion. In addition, this short positioning in futures could further intensify a risk-off trade should they be forced to cover (like in March/April). With VIX call skew just below the YTD highs, VIX call spreads are an attractive way to “own” volatility here and hedge for a possible spike higher given possible “offsides” in positioning.
Trade:
Buy VIX Oct 22nd 22.5 calls
Sell VIX Oct 22nd 50 calls
Costs ~ $1.35 (VIX Oct futures ref of 19.34)
Trade Details:
- Buying the VIX Oct call spread with VIX index just above the YTD lows and net short positioning in VIX futures at a three-year high
- Call spread is essentially the 40-delta/10-delta call spread, and call skew is now just below the recent highs (selling the 50 calls covers ~ 25% of the cost of the 22.50 calls)
- The last 2x net positioning in VIX futures was this high we saw decided declines in the indices as well as significant spikes in volatility (July ’24 and Feb ’25) shortly after
- Call spread has a 19x to 1 max payoff and nearly two-months of duration to expiry
- Low-cost/high-payout macro tail-risk hedge
- Please contact me or the 22V sales team for updated pricing and execution capabilities
VIX futures net short positioning at a 3-year high ~ -93k. This is ~ 50% more than the July ’24 and Feb ’25 highs which both times preceded market declines and spikes in volatility
Why QQQ remains my preferred large cap portfolio hedge
With markets still up sharply from their April lows, it makes sense to at least start considering index hedges here, especially as we start the worst month for the market over the past 5 and 10-year periods. SPX has averaged a 4.4% decline over the past 5 years and a 2.24% decline over the last 10 years in September, with NDX a bit worse. If considering hedges, I firmly believe that QQQ should be considered over SPY at this time. There are several reasons why I believe that QQQ is the “better” vehicle to hedge large cap portfolios at this time:
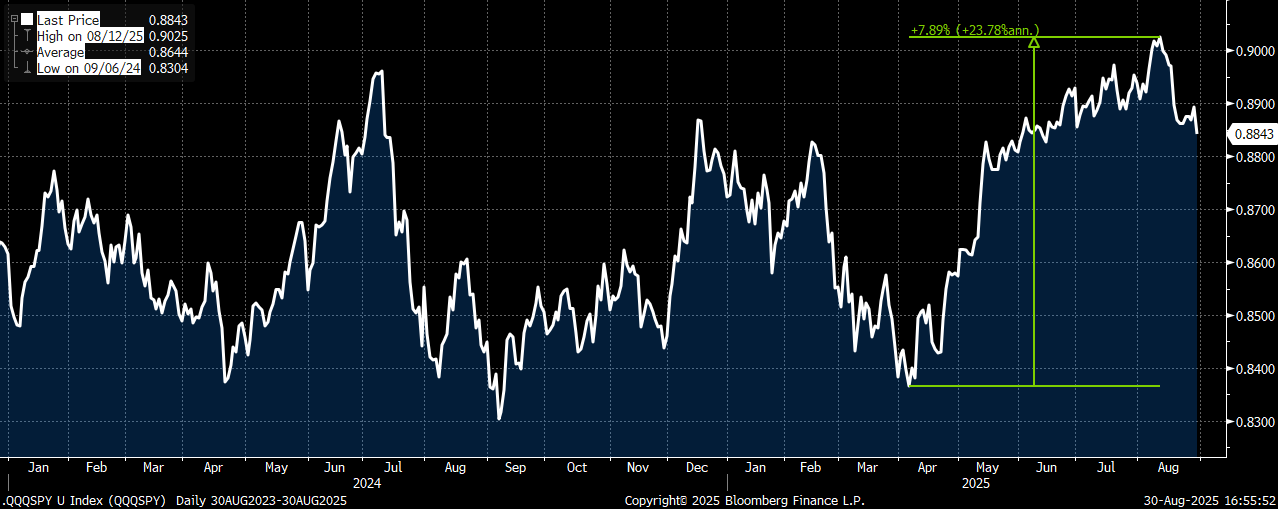
1) QQQ outperformed SPY by nearly 8% off the April lows to the Aug highs. Should we see weakness in the markets over the next few months I would fully expect that tech would “lead” lower after being the main reason for the sharp rally back to new highs.
QQQ/SPY relative spread gained ~ 8% from the April low to the Aug high and has since started to move back lower
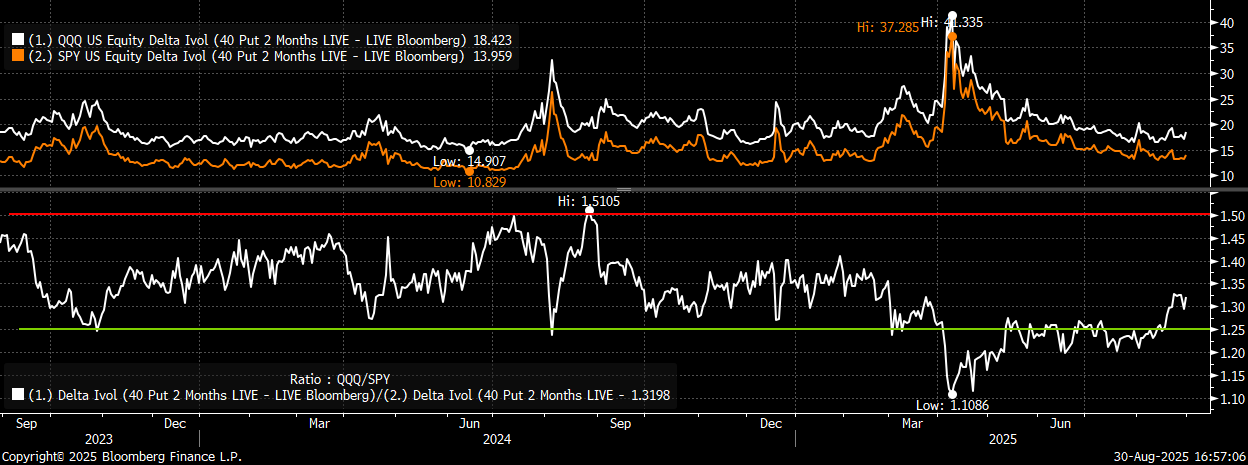
2) QQQ 2-month 40-delta puts currently trade at a roughly 30% vol premium to SPY 2-month 40-delta puts. While this skew is higher than it was between April and July, as tech was outperforming, it still trades near the low-end of the 2-year range it had been trading in prior to the April selloff. Since the QQQ/SPY relative spread peaked on 8/12 (at a new all-time high) we have seen QQQ underperform SPY to a 2.2x beta on the three times QQQ was down 50bps or more (far more than the current 1.3x put vol skew suggests).
QQQ 2-month 40-delta puts trading at a 1.3x vol premium to SPY 2-month 40-delta puts. While up from the April lows, this remains near the low-end of the 2-year range
3) Given the large current weighting of technology stocks in the SPX, it stands to reason that if we don’t see a decline by tech stocks then it’s unlikely we see a meaningful drop in SPY. However, IF tech shares are substantially lower then it’s very likely you would do much better in the higher technology concentration QQQ hedge. This is especially true coming on the heels of the large outperformance we just witnessed from the April lows to the August highs in the QQQ/SPY relative spread.
4) When tech has been weak, we continue to see money rotate to other areas of the market. Therefore, that has been limiting the “damage” in SPY given its higher “non-tech” weighting and exposure.
A few weeks ago I suggested buying QQQ Oct ratio put spreads as a tactical market/tech hedge (here). With QQQ down ~ 1% since that time (and SPY up small), I still prefer the QQQ Oct ratio put spread hedge at this time that continues to target the 515 area as support (200-day moving average). Here is an updated version of the trade I suggested on 8/17:
Trade:
Buy QQQ Oct 17th 565 puts 2x
Sell QQQ Oct 17th 515 puts 3x
Costs ~ $6.90 (QQQ 570.40 Fri close ref)
Trade Details:
- Buying the Oct 2×3 QQQ ratio put spread as a “preferred” large-cap portfolio hedge
- Spread starts less than 1% below spot and has a max P&L~ 10% lower (at the 200-day moving average)
- Trade is profitable between ~ 558 and 422 at Oct expiry (-2% to -26%)
- Trade has very attractive Greeks – short Delta, long Gamma, long Vega and positive carry (Theta) to start
- Put skew remains near the 1-year highs (why I favor the ratio put spread)
- I continue to favor QQQ over SPY as a large-cap portfolio index hedge
- Have seen QQQ underperform SPY to a 2.2x beta on the last three times QQQ has declined by 50bps or more. This is far above the current vol skew which only implies a 1.3x beta
- Please contact me or the 22V sales team for updated pricing and execution capabilities

