Back Derivatives Strategy

Tech (QQQ) Ratio Put Spread Hedges Look Extremely Attractive With Markets Up Sharply and Put Skew at 3-Year Highs

Published on August 17, 2025

∙ Download the PDF Report

By

Jeff Jacobson

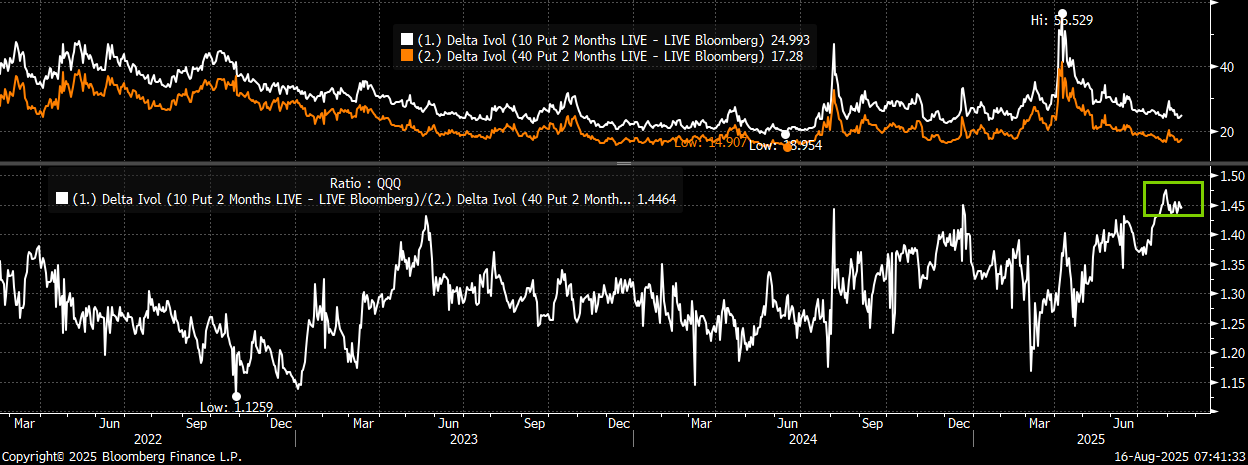
With the main tech index (QQQ) up more than 43% from the April lows, I want to highlight that 2-month (October) put skew is now just below the 3-year highs. This attractive put skew is likely a function of both VIX moving back to the YTD lows, while there remains a bid for “tail hedges” (perhaps due to the lasting memory of the April tariff-related selloff?). Regardless of why put skew is this wide, I believe with the market up this much in such a short period of time, and all the talk regarding concentration at the top (Mag 7), this skew should be considered when establishing protective hedges at this time.

QQQ 2-month (Oct) 10-delta/40-delta put skew is at a 3-year high (bottom chart)
A screenshot of a graph

AI-generated content may be incorrect.

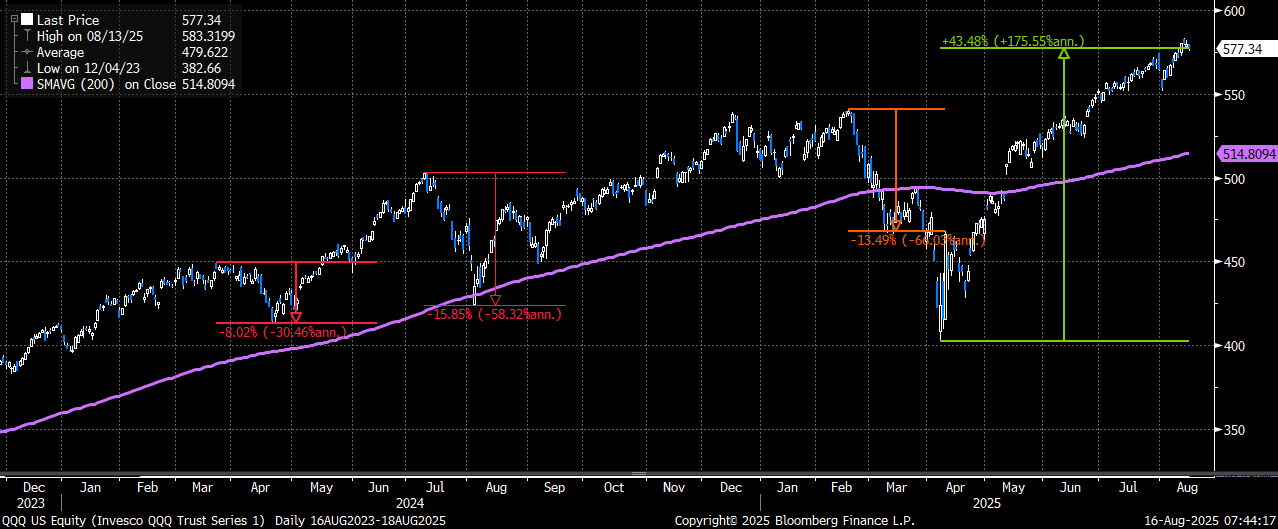
When looking specifically at the October 10-delta/40-delta put skew, I see that lines up approximately with the 570 strikes and the 515 strikes. Coincidentally, that 515 put strike also happens to be to current 200-day moving average for QQQ (and ~ 10.8% below where QQQ closed on Friday). I believe that should we see a pullback in tech that is more than just a shallow one, then the 200-day would be a likely level of support. It also happens to be just above the level where the market gapped higher in May once the tariff deadlines were extended out. In addition, I also looked at the last three (non-tariff related) significant declines for QQQ in the last 18 months, and the average decline was ~ 12.5%. If, in fact, the high that was put in last week in QQQ ~ 583 were to be a short-term “top”, that 515 level also happens to be ~ 12% lower.

QQQ is up more than 43% from the lows. The last three (non-tariff) declines averaged a 12.5 move lower. The 200-day is 12% below the highs hit last week
A graph with lines and numbers on it

AI-generated content may be incorrect.


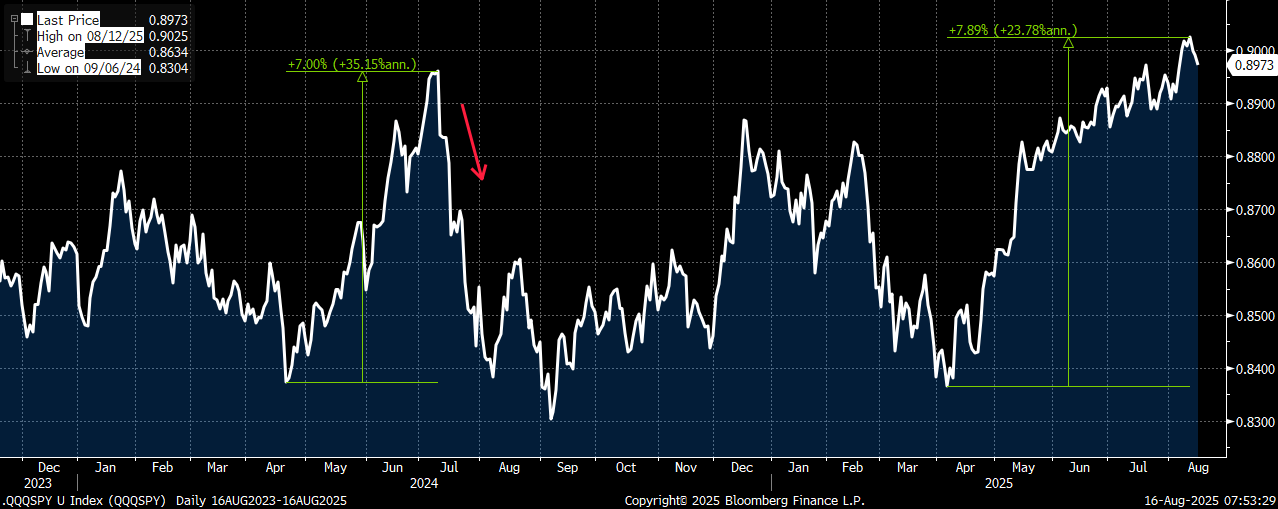
While put skew for SPY is also very attractive, I prefer to look at establishing QQQ hedges using the skew since tech has far outpaced the overall market off the April lows, and should we see a decent pullback from here I believe tech would have to be leading market lower (especially given the ever-increasing weighting in the index). In addition, the QQQ/SPY relative spread just moved up by nearly 8% off the April lows to the recent highs. We saw a very similar move in that relative spread last April thru July, only to see it reverse the entire move shortly after as QQQ underperformed SPY by ~ 7% from July ’24 thru early Aug ’24. Therefore, I prefer to focus on QQQ hedges currently if considering a way to protect the sharp gains from April over the next few months.

The QQQ/SPY relative spread gained nearly 8% off the lows. This move looks a lot like the April ’24 – July ’24 move (which then reversed as QQQ led both lower)
A graph with lines and numbers

AI-generated content may be incorrect.

With put skew this attractive not only do I prefer put spreads, but I believe ratio puts spreads (where you oversell that “expensive” tail put) make a lot of sense at this time. I am less in the camp that we see a significant drop/pullback from here, and believe that should we see a decline it would be in the more “typical” 5-15% range (which supports using the ratio spread trade).

Here are 2 trades to consider using that 515 level (10d) put as part of a ratio hedge trade that I wanted to highlight:

Trade #1 – QQQ Oct 1×2 put spread

Buy QQQ Oct 570 puts 1x (39d, 17.2 vol)

Sell QQQ Oct 515 puts 2x (11d, 24.5 vol)

Costs ~ $5.35 (QQQ 577.34 Fri close ref)

> Buying the Oct 1×2 ratio put spread as a tech hedge following 43% rally off the April lows and sharp outperformance by QQQ to SPY

> The 10d/40d put skew is at 3-year highs (why ratio spreads make sense)

> Trade has short delta (17d), is long vol (Vega), long gamma and starts off with positive carry (theta)

> Selling the 515 puts 2x (at the 200-day) covers ~ 55% of the cost of the puts that are less than 1% lower

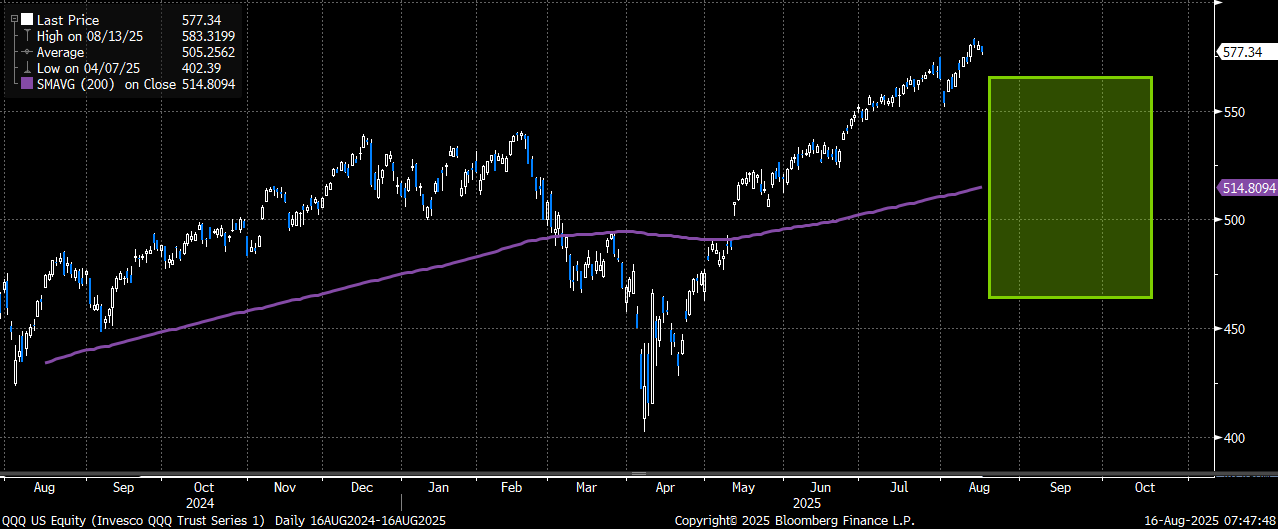
> Trade makes money between ~ 565 and 465 (-2% to -20%) by October expiry

> Hedge doesn’t cap further upside and effectively paying less than 1% of the underlying QQQ to hedge against a decent pullback for the next 2 months

The GREEN area highlights where the 1×2 ratio put spread is profitable at Oct expiry. The max profit would be at the 200-day moving average ~ 515
A graph with lines and a line

AI-generated content may be incorrect.

Trade #2 – QQQ Oct 2×3 ratio put spread

Buy QQQ Oct 570 puts 1x (39d, 17.2 vol)

Sell QQQ Oct 515 puts 1.5x (11d, 24.5 vol)

Costs ~ $6.95 (QQQ 577.34 Fri close ref)

> Buying the Oct 2×3 ratio put spread as a tech hedge following 43% rally off the April lows and sharp outperformance by QQQ to SPY

> The 10d/40d put skew is at 3-year highs (why ratio spreads make sense)

> Trade has short delta (23d), is long vol (Vega), long gamma and starts off exactly theta neutral

> Selling the 515 puts 1.5x (at the 200-day) covers ~ 41% of the cost of the puts that are less than 1% lower

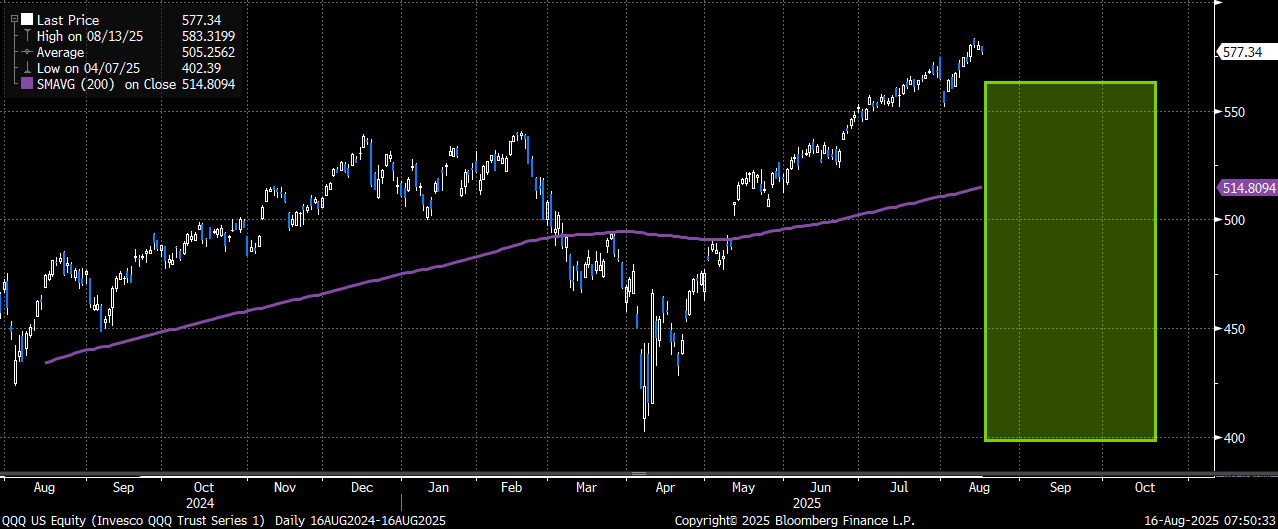
> Trade makes money between 563 and 400 (-2.5% to -37%) by October expiry – the 400 level was also the dead lows back in April

> Hedge doesn’t cap further upside and effectively paying just over 1% of the underlying QQQ to hedge against decent pullback for the next 2 months

The GREEN area shows where the 1×1.5 ratio put spread is profitable at Oct expiry. Max profit also at the 200-day ~ 515 and makes $$ all the way down to the April lows
A graph with lines and a line

AI-generated content may be incorrect.

Please reach out to me or the 22V sales team for updated pricing and execution capabilities for either structure.


DISCLOSURES AND DISCLAIMERS

Analyst Certification

The analyst, 22V Research Group, primarily responsible for the preparation of this research report attests to the following: (1) that the views and opinions rendered in this research report reflect his or her personal views about the subject companies or issuers; and (2) that no part of the research analyst’s compensation was, is, or will be directly related to the specific recommendations or views in this research report.

Analyst Certifications and Independence of Research.

Each of the 22V Research analysts whose names appear on the front page of this report hereby certify that all the views expressed in this Report accurately reflect our personal views about any and all of the subject securities or issuers and that no part of our compensation was, is, or will be, directly or indirectly, related to the specific recommendations or views of in this Report.

22V Research (the “Company”) is an independent research provider. The Company is not a member of the FINRA or the SIPC and is not a registered broker dealer or investment adviser. 22V Research has no other regulated or unregulated business activities which conflict with its provision of independent research.

22V Research, LLC is a professional services and independent publication organization. 22V Research, LLC is not a securities broker-dealer, not a member of the Financial Industry Regulatory Authority (FINRA), not a registered investment advisor (RIA) and not a member of SIPC.

Securities transactions, when offered, are offered by 22V Securities, LLC through LPS Capital, LLC. Certain employees of 22V Securities, LLC are dually registered as securities representatives of LPS Capital, LLC or Analyst Hub Securities, LLC. 22V Securities, LPS Capital and Analyst Hub Securities are members FINRA, SIPC.

https://brokercheck.finra.org/

Current Ratings Definition.

SECTOR OUTPERFORM: An “outperform” rating anticipates the company will outperform the S&P Regional Banking Index (peer group).

SECTOR PERFORM: A “market perform” rating anticipates the company will perform in line with the S&P Regional Banking Index (peer group).

SECTOR UNDERPERFORM: An “underperform” rating anticipates the company will underperform the S&P Regional Banking Index (peer group).

Limitation Of Research And Information.

This Report has been prepared for distribution to only qualified institutional or professional clients of 22V Research Group. The contents of this Report represent the views, opinions, and analyses of its authors. The information contained herein does not constitute financial, legal, tax or any other advice. All third-party data presented herein were obtained from publicly available sources which are believed to be reliable; however, the Company makes no warranty, express or implied, concerning the accuracy or completeness of such information. In no event shall the Company be responsible or liable for the correctness of, or update to, any such material or for any damage or lost opportunities resulting from use of this data. Nothing contained in this Report or any distribution by the Company should be construed as any offer to sell, or any solicitation of an offer to buy, any security or investment. Any research or other material received should not be construed as individualized investment advice. Investment decisions should be made as part of an overall portfolio strategy and you should consult with a professional financial advisor, legal and tax advisor prior to making any investment decision. 22V Research Group shall not be liable for any direct or indirect, incidental or consequential loss or damage (including loss of profits, revenue or goodwill) arising from any investment decisions based on information or research obtained from 22V Research Group.

Reproduction And Distribution Strictly Prohibited.

No user of this Report may reproduce, modify, copy, distribute, sell, resell, transmit, transfer, license, assign or publish the Report itself or any information contained therein. Notwithstanding the foregoing, clients with access to working models are permitted to alter or modify the information contained therein, provided that it is solely for such client’s own use. This Report is not intended to be available or distributed for any purpose that would be deemed unlawful or otherwise prohibited by any local, state, national or international laws or regulations or would otherwise subject the Company to registration or regulation of any kind within such jurisdiction.

Copyrights, Trademarks, Intellectual Property.

22V Research Group, and any logos or marks included in this Report are proprietary materials. The use of such terms and logos and marks without the express written consent of 22V Research Group is strictly prohibited. The copyright in the pages or in the screens of the Report, and in the information and material therein, is proprietary material owned by 22V Research Group unless otherwise indicated. The unauthorized use of any material on this Report may violate numerous statutes, regulations and laws, including, but not limited to, copyright, trademark, trade secret or patent laws.