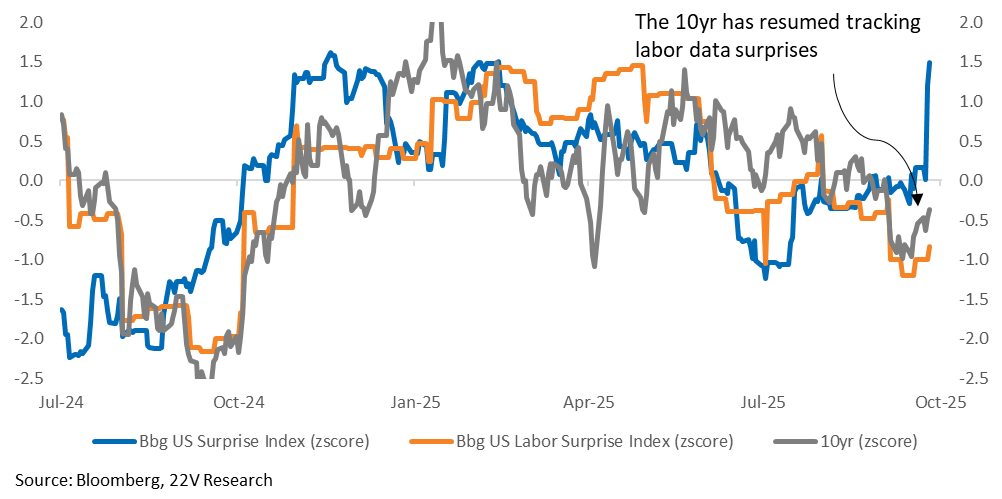
Weekly – Economic data has been consistent with our call for 10yr yields to revert higher off their recent ~4% low. Our call for a continued grind higher in 10yr yields is NOT based on inflation accelerating more quickly than expected. It was and is based on lower recession probabilities. Data last week did more than just reduce recession probabilities, though.
Last week’s data suggested trend GDP is higher than the 1-1.5% assumed. That is important because if trend GDP is 1.5% and the economy is growing above that level, as it is today, core inflation would be biased higher. Thanks to much stronger implied productivity growth, it looks like the US economy can growth at a faster pace (closer to 2%) without inflation being a major issue.
Main Positive Economic Activity Data Points – GDP estimates for Q3 are expected to improve, led by consumer spending. Real personal consumer spending data on Friday suggests spending is running at 2.6% for 3Q25 and trending in the 2.5% range. For context, in the post-GFC period, real spending was in the 1.25% range. Income data points to a 5% nominal income trend. Revisions to the GDP data suggest core aggregate demand growth was stronger in 1H25 than previously recognized, and stronger in Q2 than Q1. That is interesting, given there was supposed to be a post-tariff pothole in 2Q. It appears that final sales to private domestic purchasers, which matter most for earnings, were growing at a 3% AR in 3Q. Bottom line – demand growth is running WELL above what many investors thought, and demand growth IS NOT just an AI capex story.
Labor Market Questions Starting to Clear – The combination of strong demand growth and slow employment growth implies that the already solid productivity data are likely to be revised higher. This points away from risk of a “landslide” in labor demand.
Productivity is generally associated with stronger topline AND margins. Hence, there is less labor market risk in strong productivity backdrops. Bottom line – the breadth of data suggests 10yr yields have upside risk and 10yr yields increasing is not “bad” for markets when associated with lower recession risk and stronger productivity (higher trend growth).
Not Out of the Woods On Labor Risk – Even if we have high confidence that most of the slowdown in labor demand is driven by demographics (immigration reversal), slowing labor demand combined with uncertainty on how tariffs will impact the economy is a risky backdrop. The Fed IS more concerned with labor markets slowing than inflation. That is restrained 10yr yields while financial conditions have eased aggressively. From here, though, we should be more confident that the labor market will NOT unwind and cause a recession.
From an internal market return point of view, expect Debt risk, Homebuilders and Value to lag as 10yr yield increases and Momentum and Growth factors to outperform. Profitable small caps should outperform unprofitable small. Banks should outperform as the yield curve steepens (particularly the 5yr-2yr curve).
Some Factor Points –
- EPS Momentum factor NTM PE, sector neutral, has dropped below its 25th percentile, despite its recent outperformance.
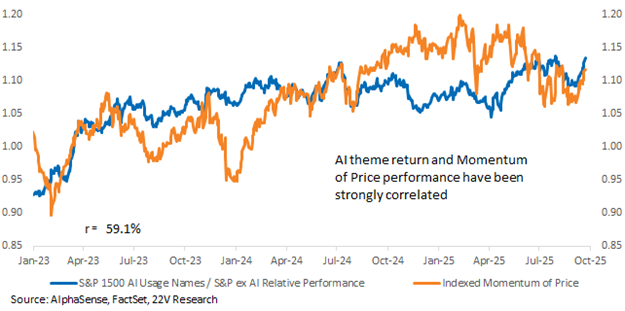
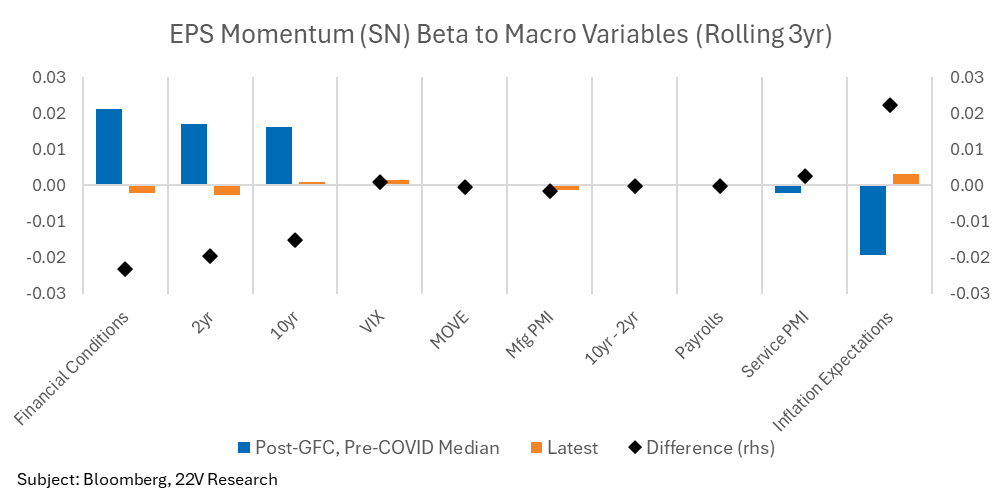
- Momentum’s beta to macro variables (employment, inflation, spending, and financial conditions) is near 0. Within Price Mo, the major driver of gains has been the AI theme. Historically, there is a high correlation between the two groups. But the two have become highly correlated since August. As goes the AI theme, so goes Momentum.
- Low Vol outperformed last week and has potential to bounce back more if investors worry that increasing 10yr yields will weigh on risk. We would fade low vol though. 10-year yields moving higher with lower recession risk increases the odds that the U.S. economic expansion continues. Normal economic expansion backdrops are a headwind for the Low Vol factor.
- During non-recessionary rate cuts, factor leadership tends to be more risk-on tilted. Earnings Turbulence and Liquidity usually lead at the expense of Low Volatility. Most fundamental factors have also outperformed, including Value, Momentum, and Growth, all of which align with our regime-based expectations.
See our China trip comments below on why Chinese stocks have a long-term flow of funds tailwind.
Charts & Commentary Below…
Indicators: Unemployment claims were better than expected last week, and, along with continued solid economic activity data (Atlanta Fed GDPNow 3Q tracking at 3.3%), suggest a continued decline in recession probabilities. Weakness in labor market data is the main recession risk today, which helps explain why 10yr yields have been tracking labor market surprises. Firm economic activity data, along with positive GDP revisions, suggest labor SURPRISES should be more to the upside vs downside from here. That will continue to bias 10yr yields higher…
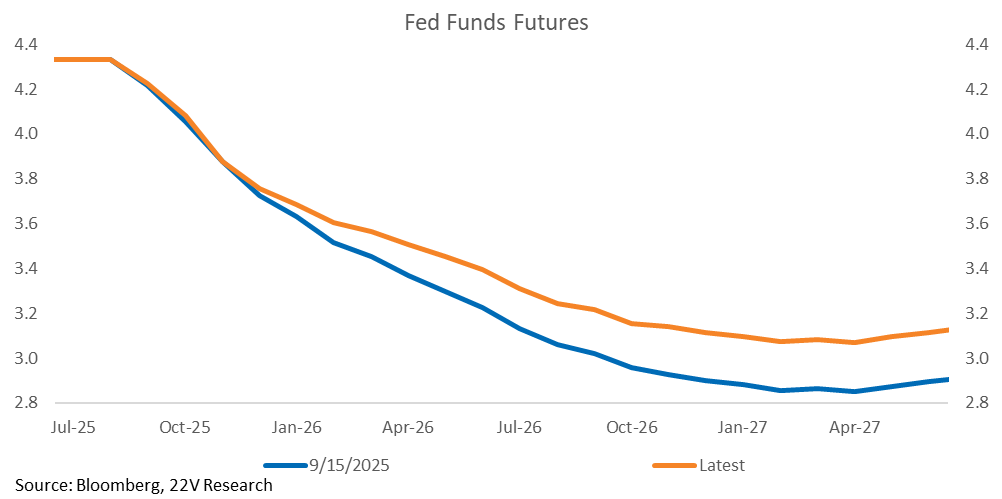
…and some reduction in rate cut expectations in 2026. The successive cuts to finish 2025 and start 2026 are still priced. Investors are pricing in the Fed stopping the cutting cycle at a higher level than two weeks ago. That is consistent with a stronger economic growth backdrop.
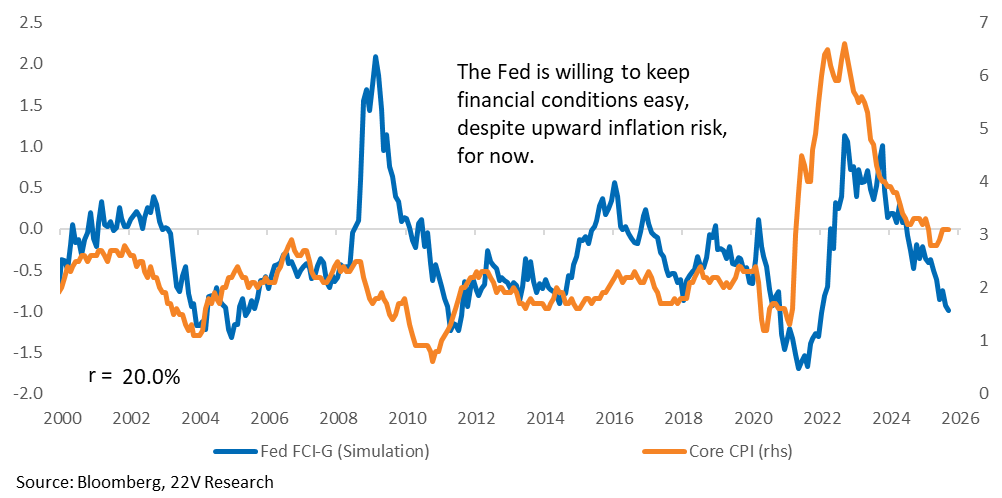
10yr yields moving higher is not “bad” if associated with lower recession risk. Since 1990, during non-recessionary cuts, the S&P has continued to rise for several months. One risk would be a sharp tightening of the spread between financial conditions and inflation. We would likely need significantly stronger than expected labor market growth for that to play out. Or a quick move into a recession (CPI collapses on FCI). We are relatively positive on the labor market (HERE), but the immigration headwinds to payroll growth suggest much stronger than expected payroll numbers (above 100k) are unlikely.
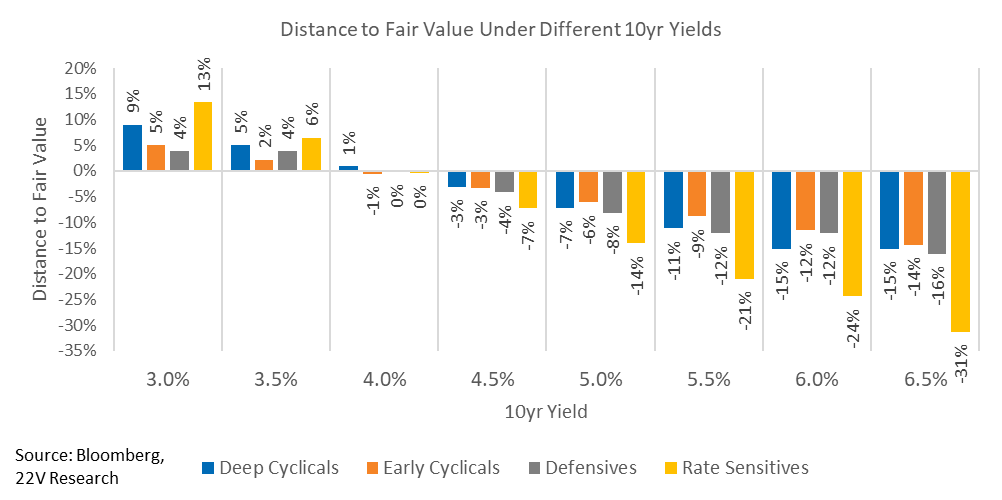
Below, we chart fair value for Early Cyclicals (Tech, Comm Svcs, Discretionary), Deep Cyclicals (Materials, Industrials, Energy), Defensives (Health Care, Staples, Utilities) and Rate Sensitives (Financials, Real Estate) dependent on different 10yr yields. Rate Sensitives (unsurprisingly) have the highest sensitivity, and Early Cyclicals the lowest. That’s an intuitive result, but the way the 10yr flows through the modeling is more via the sustainable long-term cash return ratio than via the required stock return. We set the terminal value of nominal earnings growth equal to the risk free rate and calculate the sustainable cash return ratio as the portion of earnings that can be paid out while still supporting long-term growth. Specifically, it is expressed as a payout ratio of (𝑅𝑂𝐸−10yr Yield)/𝑅𝑂𝐸, ensuring that the retained earnings finance growth at a rate consistent with the economy. Since Rate Sensitives have the lowest ROE, the 10yr has a largest impact on their sustainable payout ratio. Vice versa for Early Cyclicals.
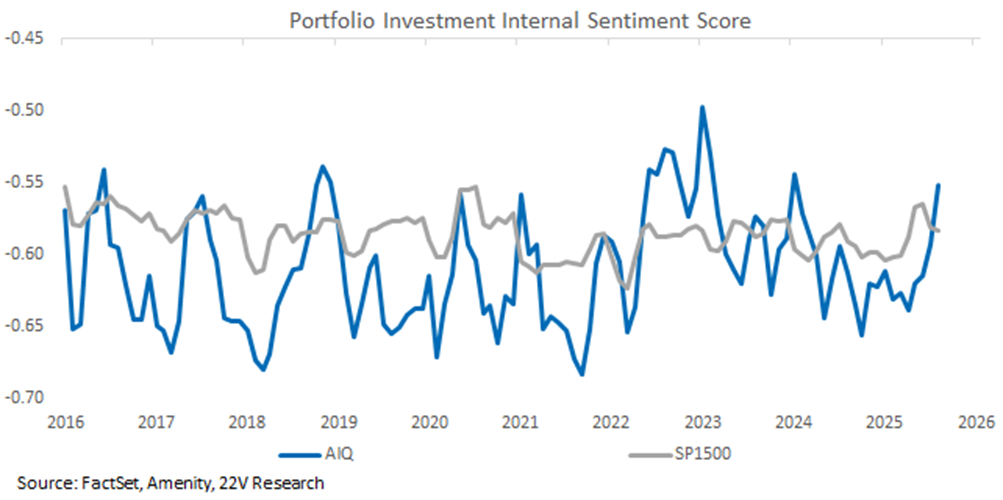
HOMEBUILDERS: Our economic thesis is that housing is a cyclical stabilizer, not an amplifier. The large beat in New Home Sales does not change our housing thesis. Consumption and AI capex spending are too strong for Housing to contribute much to growth without causing an inflation problem. 10yr yields rise when activity firms, acting as a governor on interest-rate sensitive sectors. It’s difficult to estimate where AI capex will go from here, but capex sentiment – how management teams sound about their own company’s capex outlook – for the constituents of the AIQ ETF, a popular AI ETF, rose to a cycle high in 2Q, while overall capex sentiment for the SP1500 has rolled.
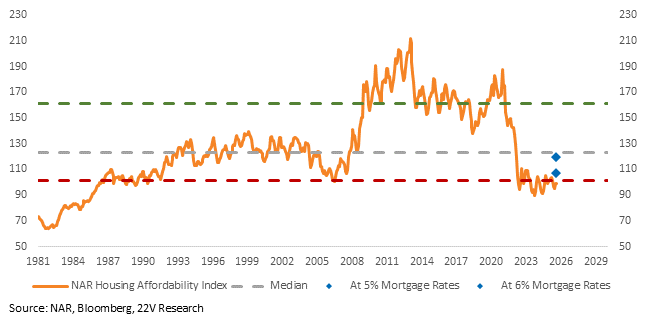
Marking to market last week’s data, housing can contribute a bit to growth, with rates having come down. But that’s not a massive change. Affordability remains low with mortgage rates at 6%. Meaningful changes to affordability require larger changes to mortgage rates or outright housing deflation. With underlying demand still strong (despite lower Payrolls growth), that outcome depends on a recession.
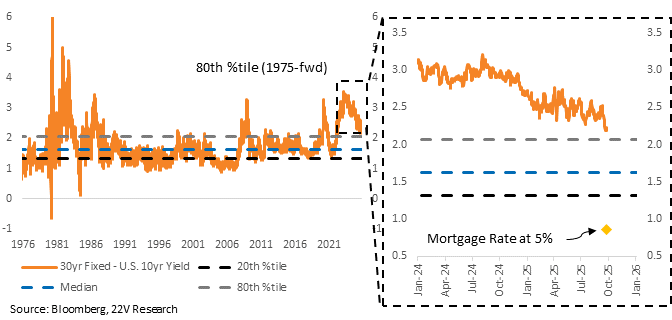
Further compression of mortgage rates would be an out from this framework, but to get mortgage rates low enough to significantly impact affordability, mortgage spreads would have to compress significantly from here.
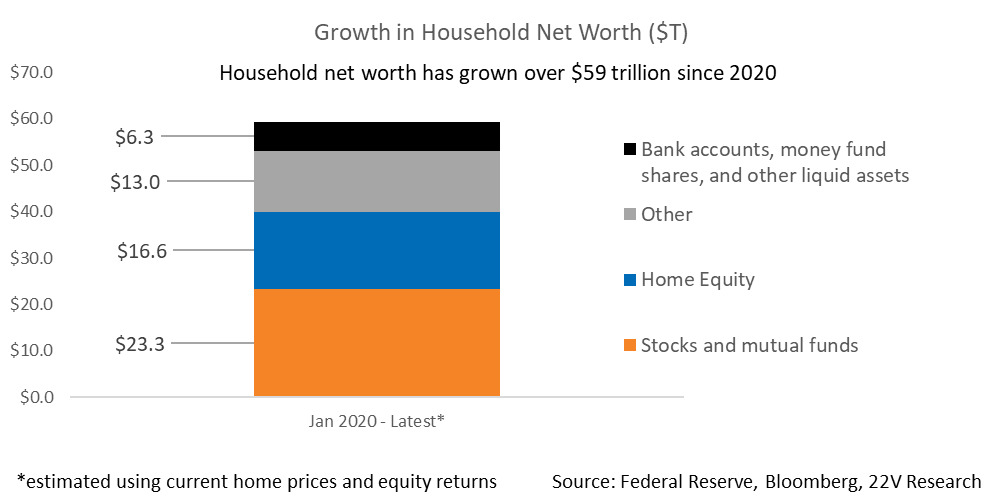
As Gerard noted (HERE), personal income has been better than job growth, likely via a longer workweek or higher average wages offsetting jobs. Record gains and levels of household net worth are a support for home prices.
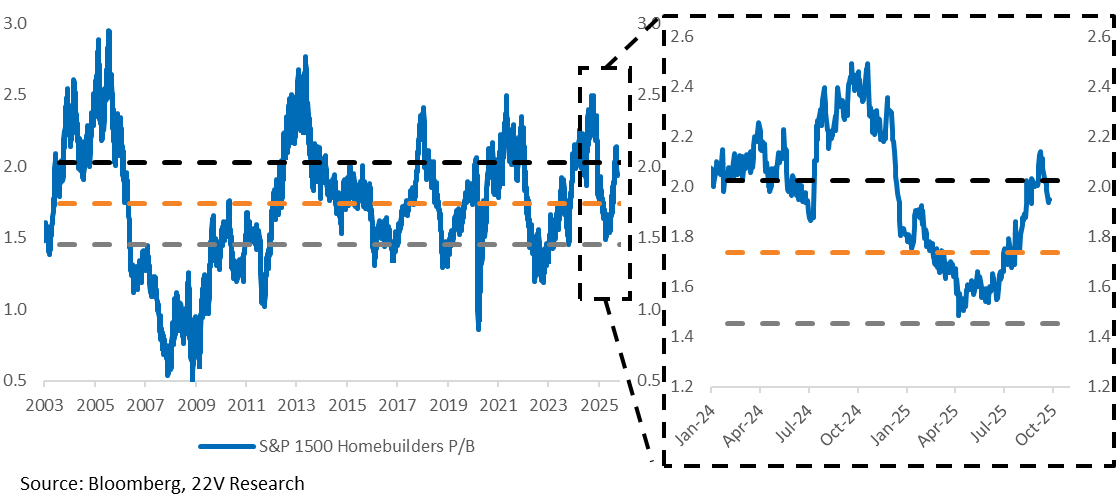
Durable gains by homebuilders, given the economic case laid out above, seem unlikely. Also because the price-to-book ratio for the group is at its 70th percentile. A very mild recovery in housing activity seems to already be discounted.
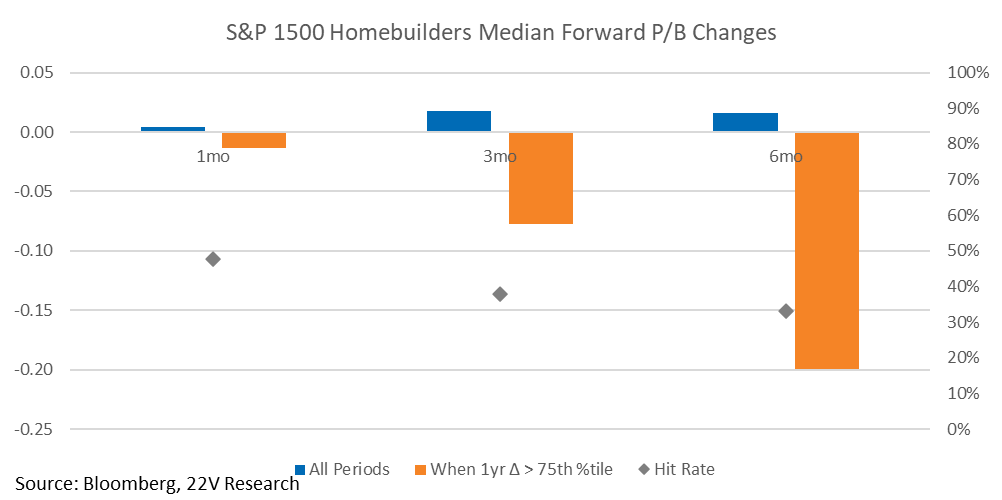
The historic forward return profile under similar valuations is poor.
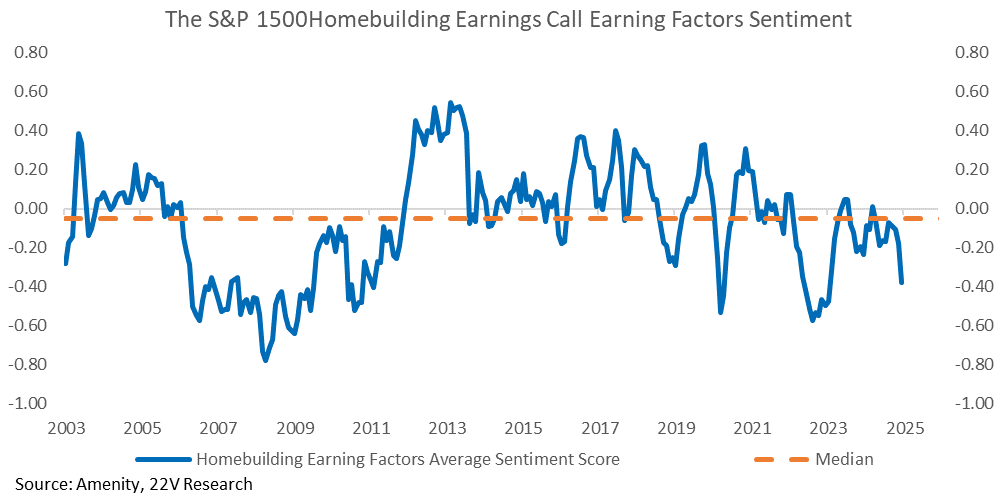
In Homebuilder earnings calls, they mentioned rolling out incentives to reduce supply. From Lennar, “Sales volume was difficult to maintain and required additional incentives in order to achieve our expected pace and to avoid building excess inventory.” Most of the excess supply is in the South, and the South contributed most to the beat in New Home sales. Housing activity bouncing a bit not just because of lower rates but also because of incentives is not great for Homebuilder margins. Earnings sentiment expressed by the Homebuilders, measured using Amenity’s natural language processing tool, rolled this quarter.
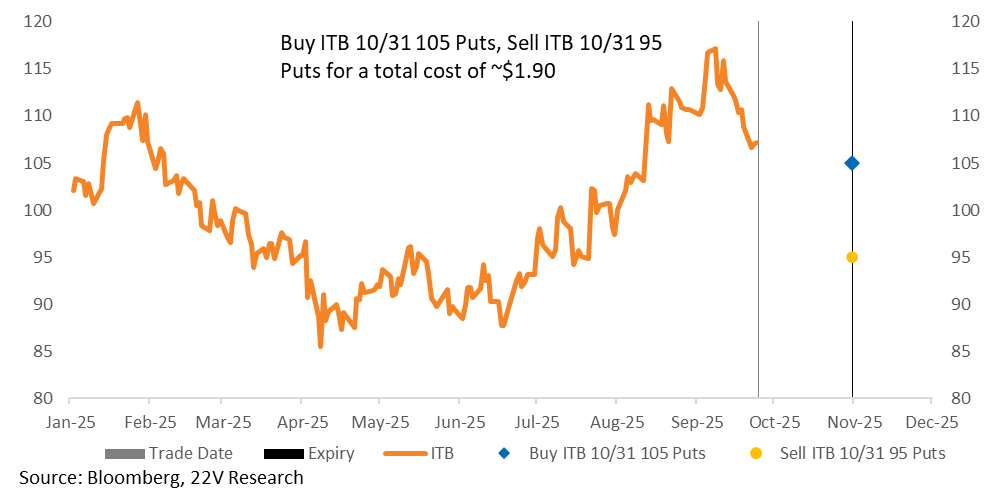
Jeff Jacobson, 22V’s Derivatives Specialist, likes hedging Homebuilders here. Details HERE.
Trade:
Buy ITB Oct 31st 105/95 put spread for ~ $2.40 (ITB 107.03 stock ref)
MOMENTUM: Continued Momentum gains are supported by the current macro regime; fundamental factors – like EPS Mo – tend to perform well when the economy is growing stably, as it is now. The macro is supportive, but the idiosyncratic themes that impact Mo, like AI, are equally as important. Mo is strongly correlated to our AI basket’s relative performance…
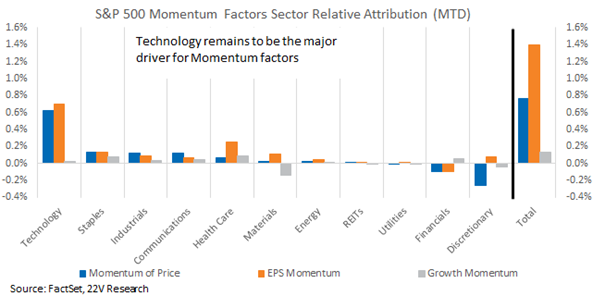
… and Tech is a large contributor to sector-neutral Momentum returns.
Momentum’s beta to macro variables spanning employment, inflation, spending, and financial conditions is near 0 across the board. There have been instances in which macro narratives cause a Mo reversal, like the Sahm scare in the summer of 2024 and the initial tariff scare in February of 2025, but for the most part, Mo is trading invariant to macro.
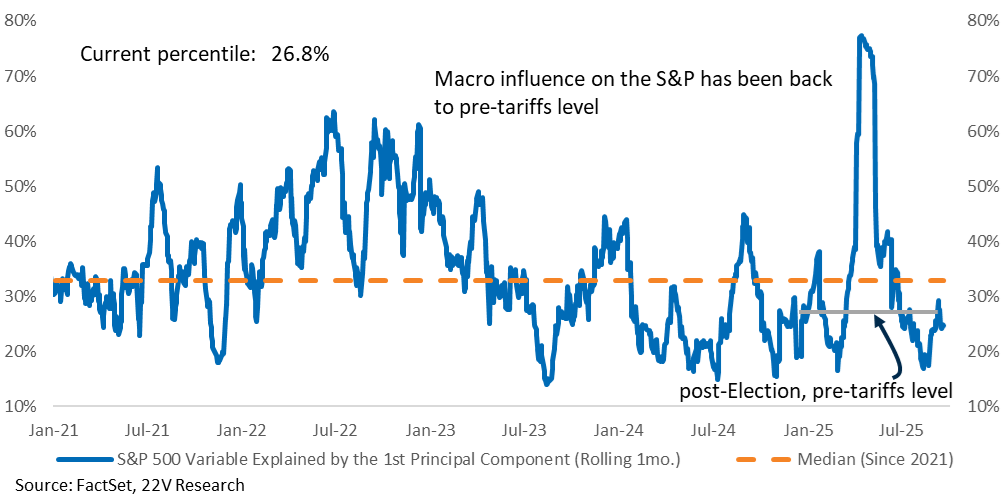
This dynamic makes sense given the low level of volatility explained by the 1st principal component – our proxy for macro’s influence on the market. Idio themes will continue to drive returns, absent macro shocks. Those themes should remain in focus.
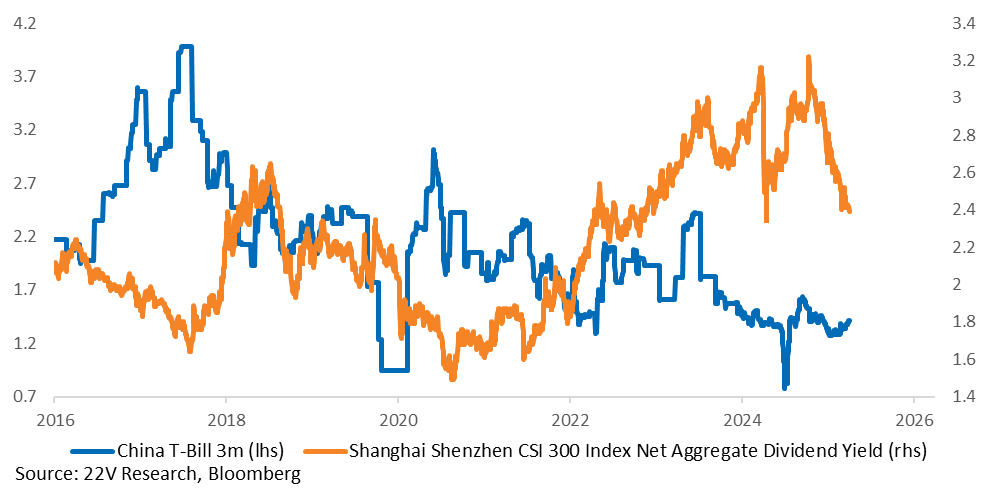
CHINA TAKWAYS: We wanted to highlight these two important points on China stocks that we picked up during our China trip (let me know if you want to discuss the trip with Michael or me). 1) Direct household participation in the equity rally has been modest, but there has been indirect participation through bank wealth management products. With cuts to interest rates, the return on deposits and low-risk money market funds are only slightly above 1%, while the trailing dividend yield for stocks in the CSI 300 is 2.4%. Outlook: Contacts see more room for households to shift savings into equities over the long term, given the limited attractiveness of alternatives in property and fixed income. Policy is in direct support of this (HERE).
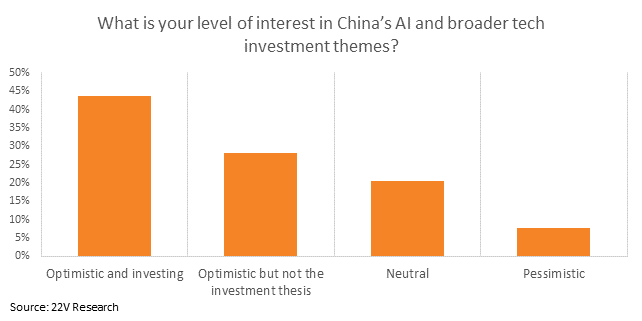
2) Greater confidence in China’s tech story. The DeepSeek moment of January 2025 was one part of a broader surge of confidence in China’s tech and advanced manufacturing prowess, which include: the inroads of China’s electric vehicle brands, the progress of domestic semiconductor companies in designing advanced chips, approval of advanced treatments by domestic biotech firms, and ongoing competitiveness of domestic AI models and applications within China and overseas. The government is VERY much supporting these sectors and is not interested in pushing back against internationally known tech company stock prices going up. Outlook: the domestic innovation story is very real, but the patriotic narratives around self-sufficiency in AI and chips are already at a fevered pitch. FYI the investors we polled ahead of the trip are optimistic about China’s tech investment themes.