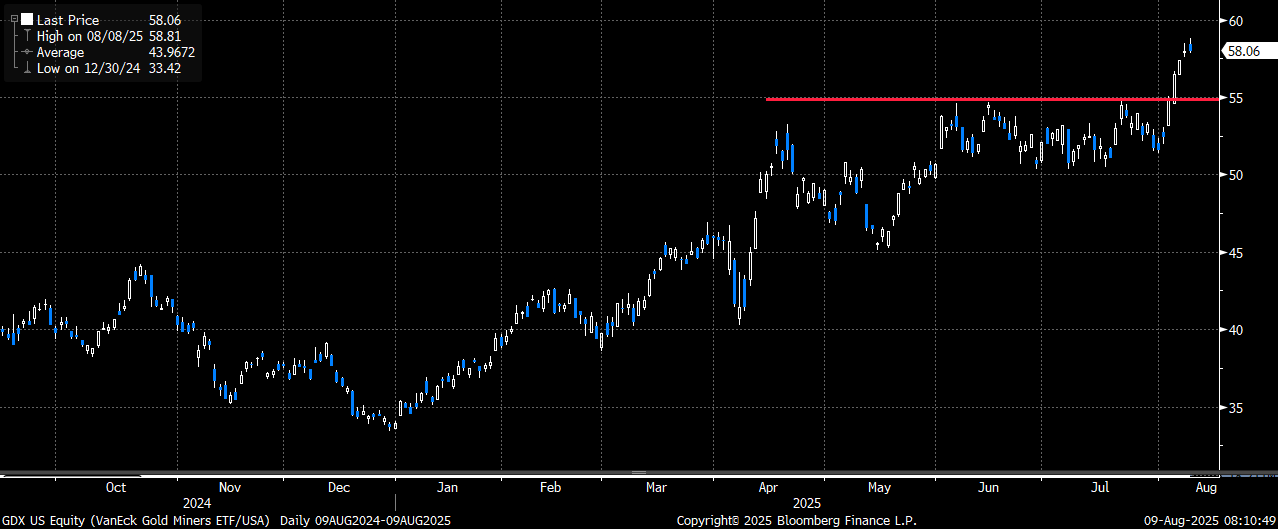
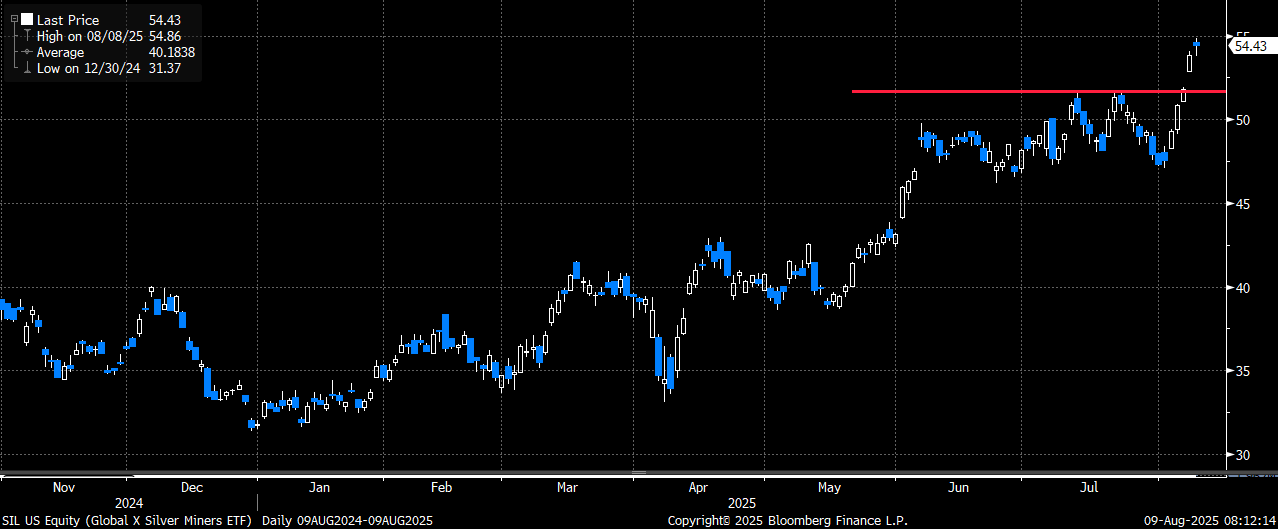
With all the talk surrounding the bullish tech/AI trade last week, the mining companies were the real upside standout group. Not only did the gold miners (GDX) and the silver miners (SIL) both breakout to new relative highs, but they both massively outperformed their underlying commodities. The gold miners were up 10.7% (with gold only up ~ 1.3%), while the silver miners staged an even more impressive 14.4% rally (with silver up less than 4%). Miners typically have a beta to the underlying of somewhere closer to 2x, so this type of relative outperformance speaks to the underlying strength/momentum in the group.
The main gold miner etf (GDX) with a breakout to new highs last week even though gold was only up small
The silver miner etf (SIL) with a similar-type breakout move last week as well
What has helped buoy this rally/outperformance has been stellar earnings from some of the top-weighted names in each etf. For the gold miners, Newmont (NEM), which is the largest weighting in GDX at over 13.5%, helped kick-start the sector back in late July when the shares rallied nearly 7% on a substantial earnings beat. As for the silver miners, Pan American Silver (PAAS), which is the 2nd largest weighting in SIL at 12.7%, rallied more than 7% when they announced earnings last week. After several years of underperformance to the underlying metals, the miners are finally starting to get their due. This is likely a function of both their costs coming down as well as the price of the commodities staying elevated (thus helping margins significantly). It also likely speaks to the fact that the miners in general are still likely under-owned and should continue to attractive more money flows as they make new highs and the commodities continue to work.
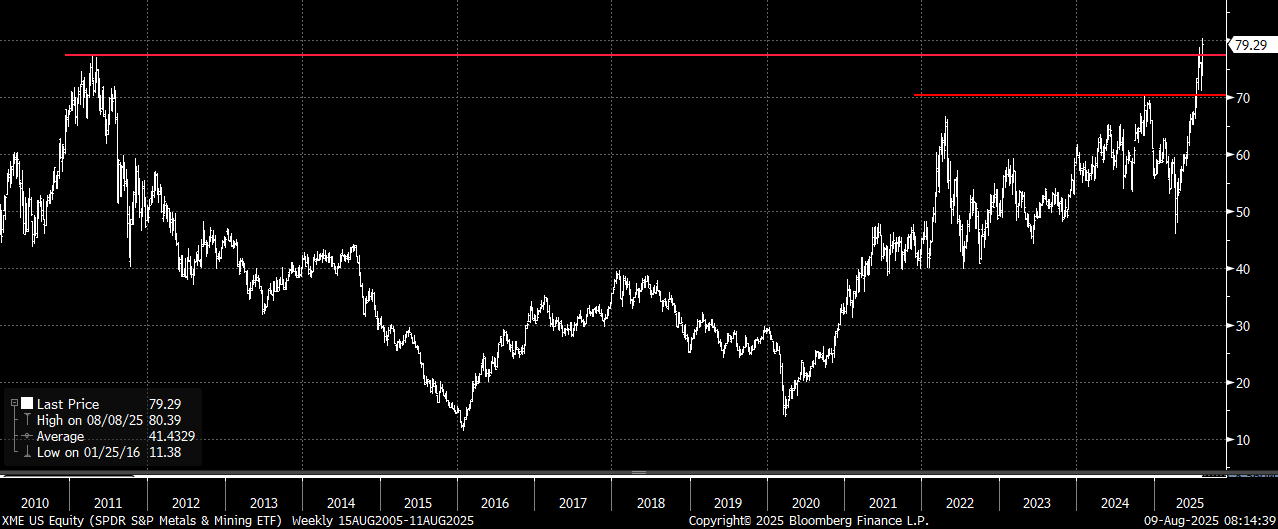
While I do believe the outperformance by the gold/silver miners to the underlying commodity still has legs, I want to highlight the S&P Metals & Mining etf (XME). This etf just broke out to a 15-year high, and there are two things that stand out to me regarding it. First, it is very diversified as it has exposure to gold, silver, copper, coal, uranium and rare earth materials (MP is the largest weight at 8.5%). Second, implied vol for this name just screens cheap. Looking at where 2-month (Sept) implied vol trades (~ 27), this is not only towards the low-end of the recent range but is now also trades at a discount to where 30-day realized vol trades (which is closer to 30). It also screens cheap when you compare the implied vol to where some of the vols trade in the top-weighted names (MP vol is 71, UEC is 64, CLF is 61 and HCC is 45). So not only do you get a very diversified way to play the commodity boom, but you can own it at a stark discount to where most of the underlying names trade on an implied vol basis. Consider this, over the last six weeks XME has averaged a 5,4% weekly move with no move less than 2.8%. You can own the Sept 80 calls (50-delta) for the next six weeks and that will cost you ~ 3.4% of the underlying.
Trade:
Buy XME Sept 80 calls for $2.70 (XME 79.29 Fri close ref)
Trade Details:
- Buying the Sept 50-delta calls in XME with the etf breaking out to a 15-year high
- Not only are commodities rallying, but we are starting to see real outperformance by the mining companies relative to the underlying commodity (GDX and SIL being prime examples)
- XME call vol back near the 6-month lows and 2-month (Sept) implied vol now trading at a discount to the 30-day realized vol
- XME also screens cheap to the underlying basket of names (many of which carry a vol that is 2x or more where XME vol trades)
- The Sept calls will cost ~ 3.4% of the underlying etf. XME has AVERAGED a 5.4% weekly move over the past 6 weeks and the smallest move was still 2.8%
- Calls can be added to an existing bullish view/bet on the commodity trade, or as an entry-point trade into the group on the impressive breakout
- 22V commodity analyst, Colin Fenton, remains steadfastly bullish on commodities. Something he highlighted recently (here).
- Please contact me or the 22V sales team for updated pricing and execution capabilities
XME not only broke out above the 2024 highs, but is now at a 15-year high after the sharp rally last week
XME 2-month (Sept) implied vol has moved back towards the 6-month lows, and now also trades at a discount to 30-day realized vol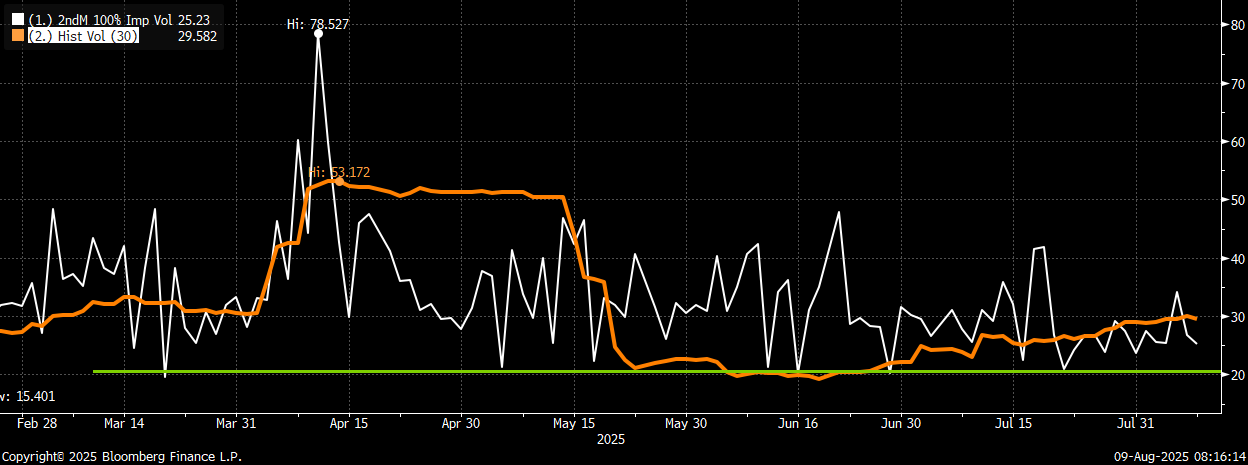
Short-Term credit hedge for CPI and other data this week
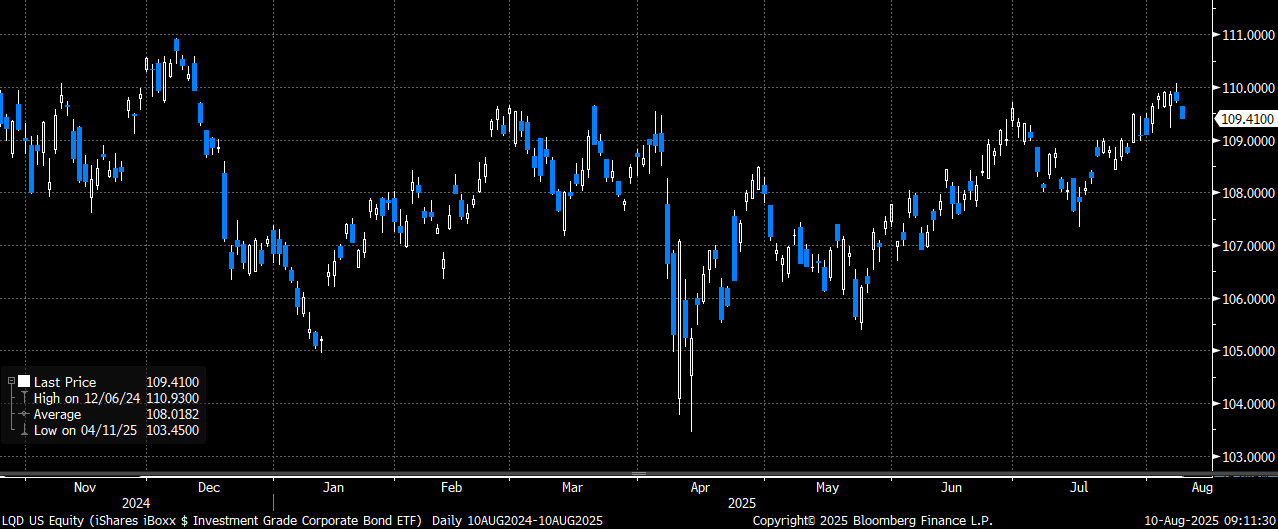
The big economic data point this week will be the CPI release on Tuesday morning. In general, I believe vol in most products looks very attractive to own for the event as I would expect either a continued sharp risk-on rally with an inline to weaker number, or the potential for a decent pullback in both stocks and bonds should we get a surprisingly “hot” number. With that being said, I wanted to highlight a trade in the main Investment Grade etf (LQD) that I believe could perform well should we see a hotter than expected report. For some background, LQD trades off of rates as well as IG spreads. Not surprisingly, it has rallied off the April lows as IG credit spreads have tightened back to the lows, and rates have also moved back towards their recent lows. LQD current duration is ~ 8.6, so it tends to trade very tightly with 10-year yields.
My thought is IF we get a hotter CPI print then not only would we expect to see yields move back higher (especially after the very sharp rally on the July payroll report and 3-month revisions), but that could also spark a risk-off trade in general which could widen IG spreads which are also basically at their “tights”. With LQD weekly vol still towards the low-end of its range I like the risk/reward of owning low-cost Aug (weekly) put spreads here into the event given the possibility of a backup in yields which could trigger a risk-off event.
Trade:
Buy LQD Aug 109/107.5 put spread for ~ .18-.19 (LQD 109.41 Fri close ref)
Trade Details:
- Buying the weekly LQD put spread ahead of CPI data on Tuesday, 8/12
- Could see a decent pullback in LQD should we see a hotter than expected report which could spark both a selloff in bonds and a widening in spreads on any risk-off trade
- Put spread starts less than 40bps below spot and is capped ~ 2% lower (2% weekly moves for LQD tend to be at the high-end – which is why I prefer the put spread)
- Trade offers a 7x to 1 max payoff
- We also get PPI data on 8/14 and then Retail Sales on 8/15 – two more data points than could certainly impact rates (our Portfolio Strategy team highlighted strong credit card spending which supports a possible strong retail sales report (here))
- LQD structure can be used as a cheap hedge to a long Investment Grade portfolio, or as a limited risk “cheap” bearish bet on the upcoming data given attractive setup
- Please contact me or the 22V sales team for updated pricing an execution capabilities
LQD with a sharp rally off the April lows as yields have moved lower and spreads have tightened
10-year yields had moved back towards the low-end of their recent range on the July payroll data. Could see a move back higher on a “hot” CPI print.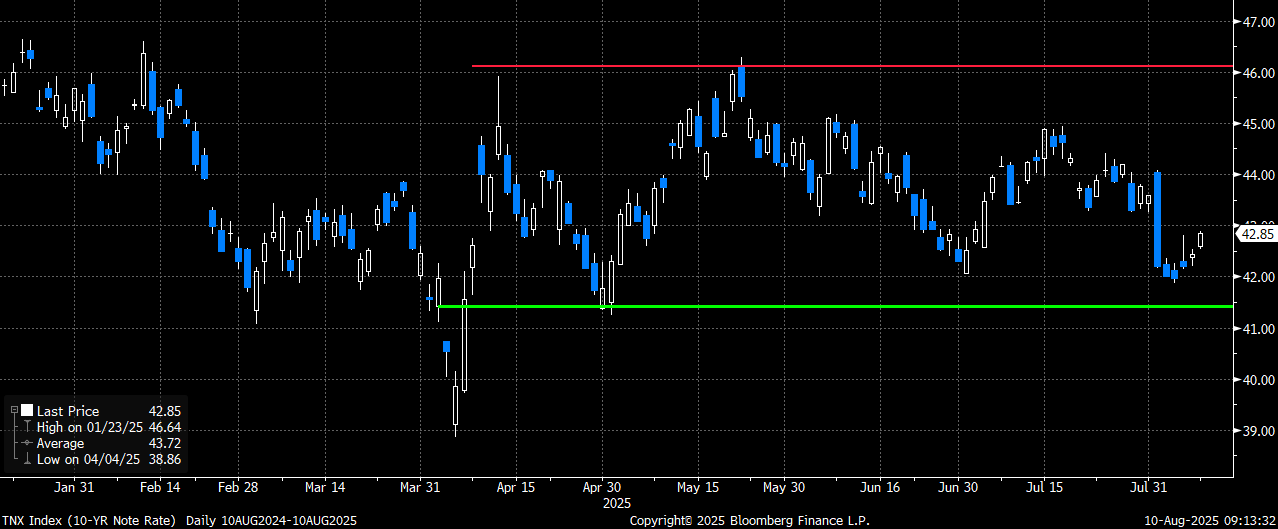
Investment Grade (IG) spreads have also moved back down to just above their tightest levels. Could see a widening in spreads on a risk-off event