

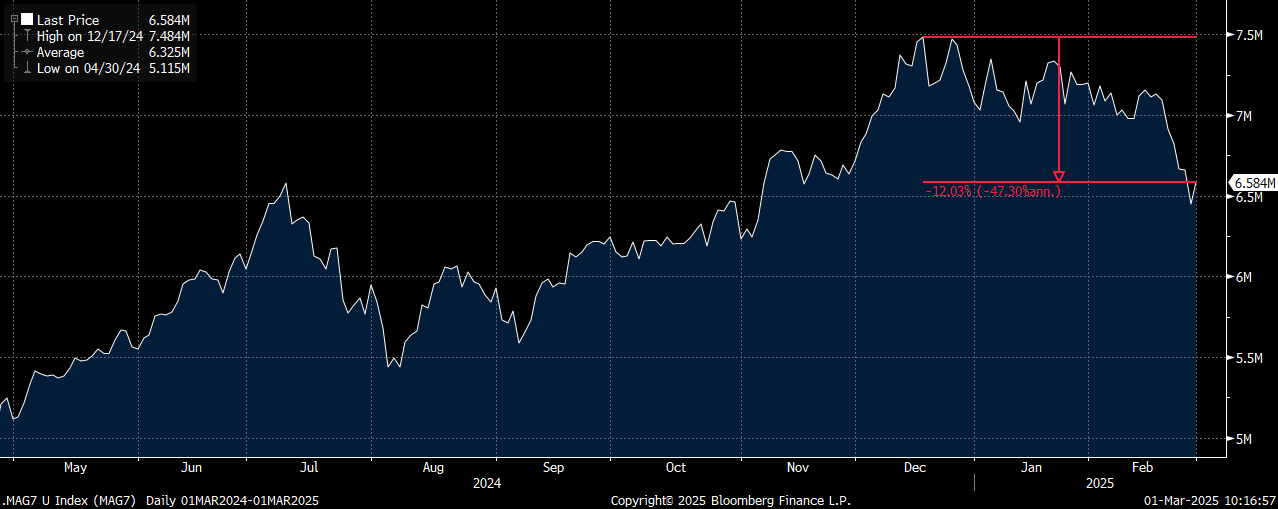
With NVIDIA (NVDA) declining 8.5% post-earnings on Thursday, the “Mag-7” has now become the “Lag-7”. META is now the only member of the group that remains up year-to-date, and with the main SPX index still up small, the other six continue to underperform the overall market. This is a far cry from the past few years where these top-weighted names in the S&P (SPY) did much of the heavy lifting when it came to upside outperformance. The equal-weight Mag-7 index that I created is now down ~ 12% from the December highs and has underperformed SPY by nearly 11% over that time. With earnings for the group now behind us, and only TSLA and META being able to rally on their reports (both small), I’m not sure what the catalyst will be to see this group regain its market leadership in the shorter term?
The equal-weight Mag-7 index that I created is now down ~ 12% from the December (all-time) highs
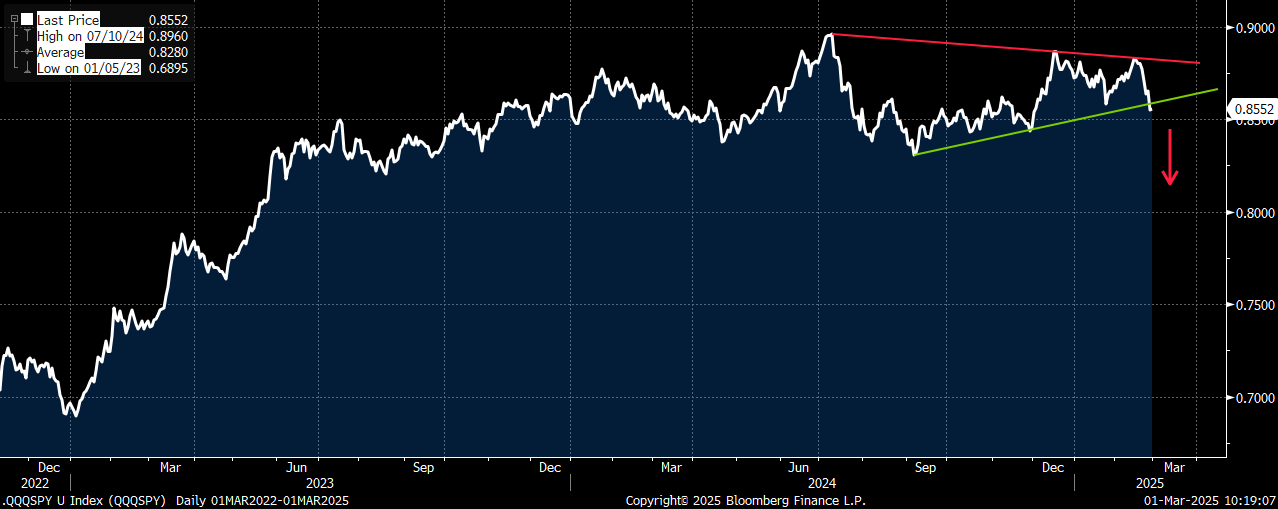
I have previously discussed the Mag-7 weighting in QQQ vs SPY as a reason to own tech hedges when considering a large-cap macro hedge (here) , and given the current weakness we continue to see from the group, I want to reiterate why I believe QQQ hedges are still the “better” large-cap portfolio protection vehicle at this time. As mentioned above, the Mag-7 peaked on an absolute basis back in December. Not surprisingly, the QQQ/SPY relative spread has declined by ~ 3.75% since. With the QQQ underperformance, the QQQ/SPY relative spread has now broken below the September uptrend support as well. While it appears that the spread is at the lower end of its recent range, if we look at a longer-term picture, we can see that tech potentially has a lot more room to the downside on a relative basis.
The QQQ/SPY relative spread just broke below the September uptrend support. With the huge outperformance we have seen by tech since the start of 2023, could see further weakness
Besides the larger weighting of the Mag-7, there are other reasons why I still prefer to own QQQ hedges over SPY at this time. First, even with the recent weakness and relative underperformance, QQQ 1-month 40-delta puts still trade near the lower-end skew vs same duration/delta SPY puts. For example, the March 31st QQQ 500 strike puts (38-delta) trade at an implied vol of ~ 23.6, while the SPY March 31st 586 strike puts (38-delta) trade at an implied vol of ~ 17.8. This put vol skew means that QQQ puts are ~ 32.5% more expensive than SPY puts. However, because the market has been led lower by tech we continue to see much larger realized moves lower on down days in QQQ. Over the last 6x where QQQ was down at least 1% in a day the average decline has been 1.91% with SPY being down only 1.10%. Therefore, on the larger down days QQQ has been realizing to a 1.74x beta vs SPY, even though the current implied vol skew has been closer to 1.32x. This is an important distinction, in my opinion, because even though QQQ puts/hedges appear more expensive, I believe on a vol/beta adjusted basis they look rather attractive vis-à-vis SPY hedges. Second, with the tariff/growth concerns being the reason why we have seen some market weakness as of late, there has been a flight to safety trade back into treasuries. Because of this, the defensive/yield sectors have also performed rather well. Since those sectors carry a much higher weighting in SPY, it tends to “soften” the blow to the index (thus explaining some of the “outperformance” we have seen by SPY on the larger down days). Put another way, because tech is still such a large component in SPY if it rallies then neither QQQ or SPY hedges are likely to work. However, IF the tech trade remains weak then why not own the instrument that not only has a much higher weighting in the sector, but also continues to realize better on a volatility and beta adjusted basis on selloffs?
I believe now is not the time where you want to abandon market hedges. QQQ just broke below the August uptrend support last week and the market still has several known potential catalysts to deal with over the next month (start of Mexico and Canada tariffs on March 4th, Feb payrolls on 3/7, CPI on 3/12, possible government shutdown deadline on 3/14, and FOMC rate decision on 3/19) not to mention all the unknowns. The surprising end of day rally on Friday also will make buying new hedges a bit cheaper as we start the new month. Therefore, if currently not hedged, I would look at the 1-month (quarter-end) QQQ put spreads for the reasons I stated above. I would also consider swapping existing SPY hedges into QQQ hedges where it makes sense to do so.
Trade I suggest:
Buy QQQ March 31st 495/450 put spread for ~ $6.25 (QQQ 508.17 Fri closing price ref)
Trade Details:
- Buying the 1-month QQQ put spread following break below September uptrend support last week as NVDA joined the “Lag-7”
- QQQ continues to underperform SPY on both an absolute, and more importantly, a vol and beta adjusted basis
- Put spread starts just a bit over 2% below spot (QQQ traded < 497 on Friday) and is capped to the downside just above the September lows
- Structure offers a better than 6x to 1 max payout at expiration
- Have seen 1-month implied move up sharply as of late, why I prefer the wide put spread at this time (selling the 450 put covers 20% of the cost of buying the 495 put)
- Can also consider selling an upside call to help finance the downside protective put spread (for example the March 31st 540 calls are ~ 1.40 and that was the highs for QQQ before recent selloff)
Please contact me or the sales desk for updated pricing and execution capabilities
QQQ with a clear break below the August uptrend support (after a “double-top at the 540 area). A break below the Jan lows and the rising 200-day could trigger further technical selling
Timely European Market Hedge Idea
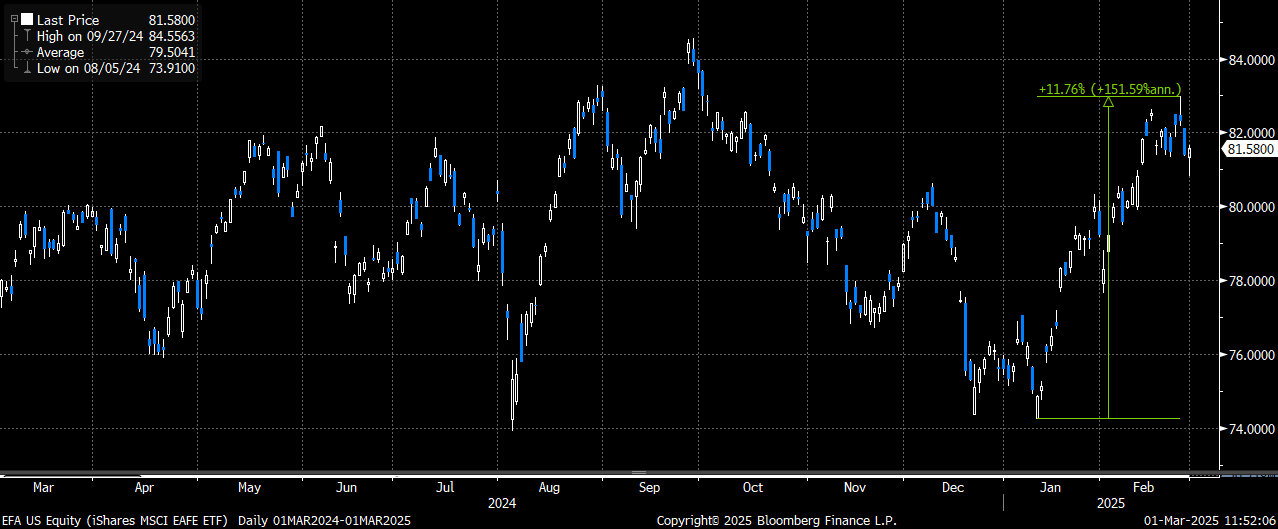
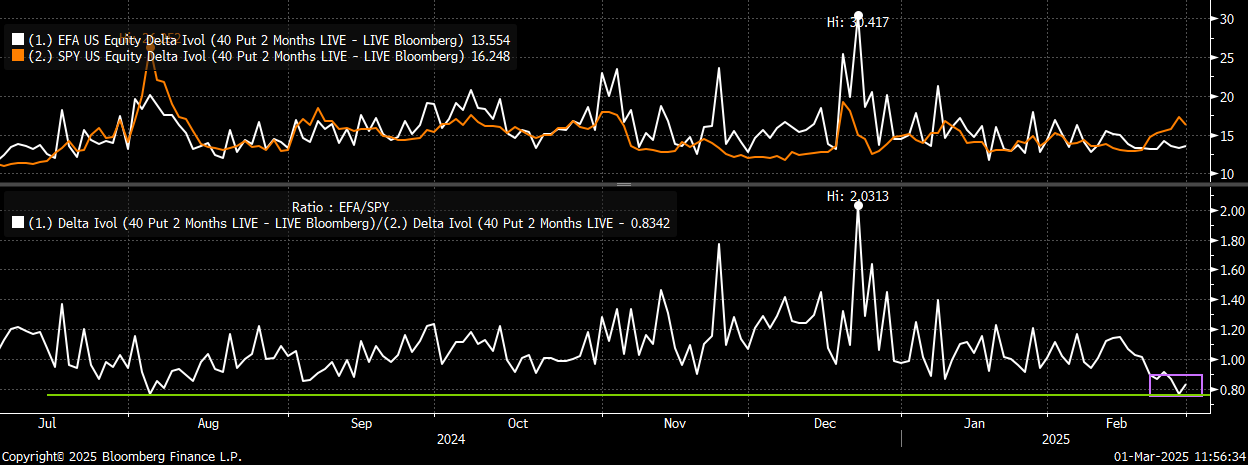
As the market has shown us lately, the time to buy hedges is after a sector/stock has performed well and when implied vol is cheap. Europe (EFA) checks both those boxes as we have seen a sharp move higher in most of the European indexes and EFA put vol is trading at/near the cheapest skew to SPY put vol. EFA had rallied nearly 12% from the Jan lows to the Feb highs (before the small pullback) and put spread hedges here remain very attractive in my opinion. Here are just a few reasons why I really like the setup to tactically establish EFA April downside structures:
1. EFA had rallied as much as 11.76% off the January lows and is now just below the September highs
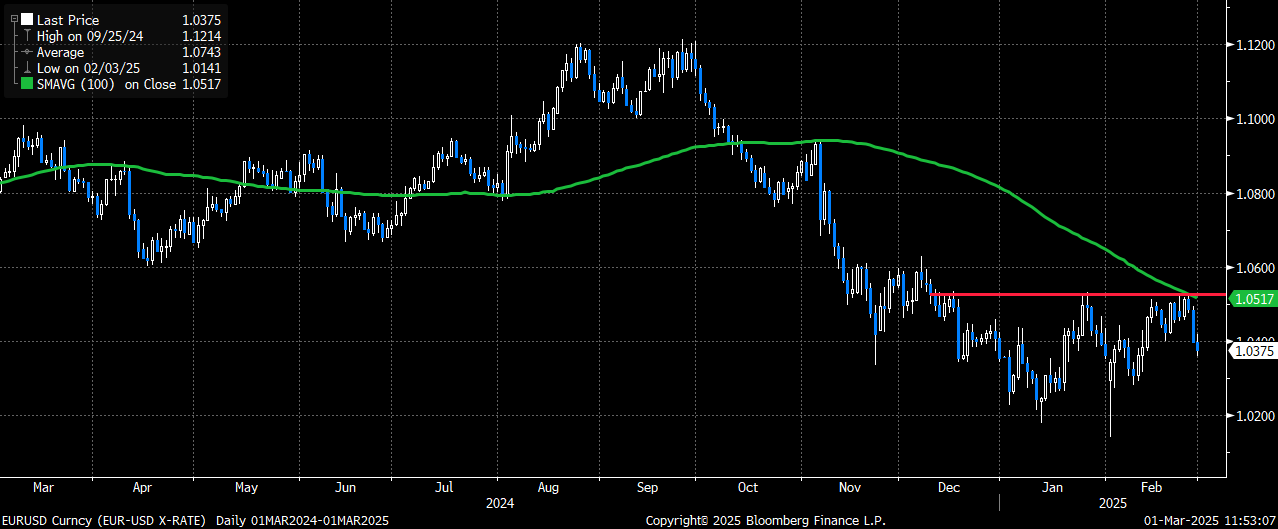
2. Euro/US$ spread just tested (and failed for now) the Dec-Jan highs and the 100-day (a technical level it also was rejected at in November)
3. EFA already trading at widest spread to Euro/$. A weakening Euro at this point should likely start to weigh on EFA given past relationship and sharp outperformance
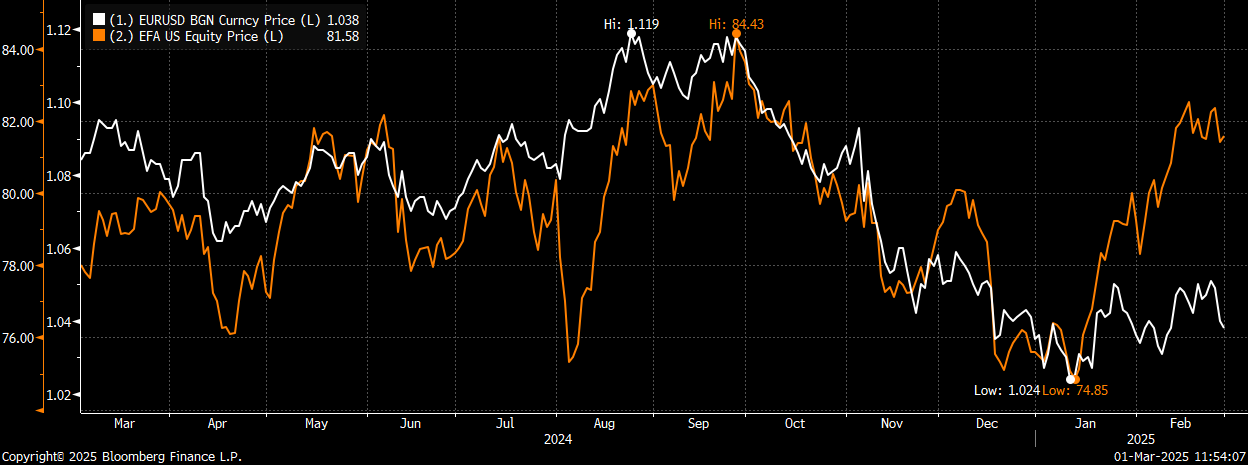
4. EFA 2-month 40-delta puts trading near cheapest skew to SPY 2-month 40-delta puts (bottom chart)
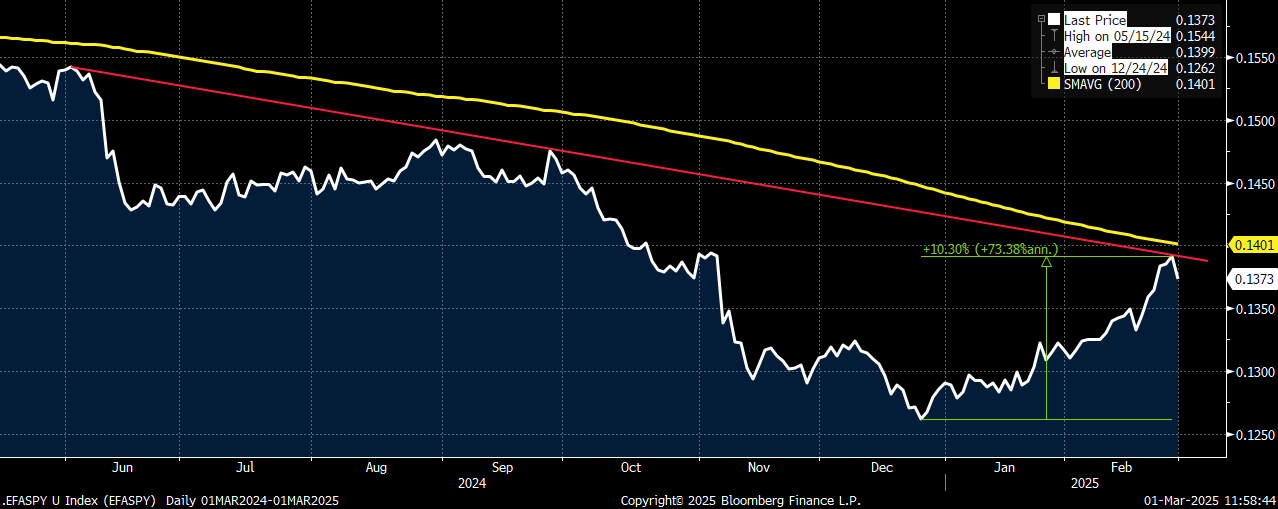
5. EFA/SPY relative spread moved up 10%+ from the Dec lows and just below the June downtrend resistance and 200-day
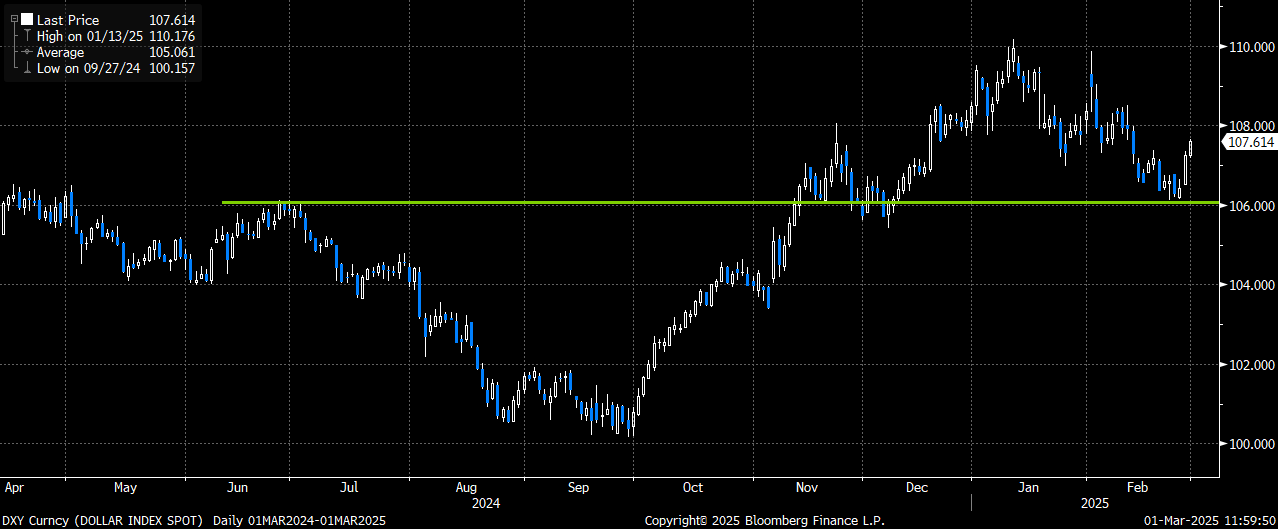
6. US $ index (DXY) just pulled back to support ~ 106. When it went from 106 up to 110 between Dec and Jan, EFA declined from 80.5 to 74
As you can see, a lot of things do line up here to establish low-cost hedges. I prefer to go out to April for a few reasons. First, with vol this cheap (esp relative to SPY), prefer to “lock-in” here. Second, given the tariff concerns that could be levied against the EU, I want to hedge that risk at least thru April as well. The Friday events from the oval office should also keep volatility in the region elevated up for some time.
Trade:
Buy EFA April 81/74 put spread for ~ $1.05 (EFA 81.58 Friday closing price ref)
- Buying the April EFA put spread following sharp rally and outperformance to US by European stocks
- EFA already trades at a sharp premium to Euro/$ spread – could see EFA play “catch-up” to the downside should Euro start to weaken here vs $
- Put spread starts less than 1% below spot, offers a nearly 6x to 1 payout at April expiry and is capped to the downside at the August/Jan lows
- Structure can be bought to hedge European exposure (EFA is ~ 70%+ in European names), or as a limited-risk bearish bet given very attractive setup
Please reach out to me or the sales team for updated prices and execution capabilities

